 American Journal of Plant Sciences, 2013, 4, 2049-2059 Published Online November 2013 (http://www.scirp.org/journal/ajps) http://dx.doi.org/10.4236/ajps.2013.411257 Open Access AJPS 2049 Epidemiologic Study of Ramularia areola under Different Soil Covers and Spacings, for Cotton Crops Jaqueline Aguilla Pizzato1, Dejânia Vieira Araújo1, Milson Evaldo Serafim2, Kelly Lana Araújo3, Rivanildo Dallacort1, Thiago Alexandre Santana Gílio4, Jair Romano Jr.5, Vanderlei Antunes Maciel5 1Programa de Pós-graduação em Ambiente e Sistemas de Produção Agrícola, Universidade do Estado de Mato Grosso, Tangará da Serra, Brasil; 2Instituto Federal de Educação, Ciência e Tecnologia de Mato Grosso—IFMT, Cáceres, Brasil; 3Laboratório de Melhoramento Genético Vegetal. Universidade do Estado de Mato Grosso, Cáceres, Brasil. 4Programa de Pós-graduação em Genética e Melhoramento de Plantas, Universidade do Estado de Mato Grosso, Tangará da Serra, Brasil; 5Laboratório de Fitopatologia, Universidade do Estado de Mato Grosso, Tangará da Serra, Brasil. Email: japizzato@gmail.com Received July 9th, 2013; revised August 9th, 2013; accepted September 15th, 2013 Copyright © 2013 Jaqueline Aguilla Pizzato et al. This is an open access article distributed under the Creative Commons Attribution License, which permits unrestricted use, distribution, and reproduction in any medium, provided the original work is properly cited. ABSTRACT The objective of this work was to evaluate the progress of the areolate mildew of cotton under different soil cover and spacing conditions. The experiment was carried out using randomized blocks and a 2 × 3 factorial design, with two spacings (0.45 m and 0.90 m) and three soil covers (no cover, Pennisetum glaucum and Crotalaria spectabilis) with four replications. The plants were inoculated with R. areola, sixty DAS. A total of 14 evaluations of disease severity were performed. At the lower, middle and upper thirds of plants, a diagram scale with nine levels of severity was used and the resulting data were converted into the AUDPC. Gompertz, logistic, and monomolecular mathematical models were tested in the disease severity curves for each third. Agronomics characteristics were evaluated as well. Significant differences of AUDPC were found for the cotton plants thirds, and the middle third was the highest AUDPC. Signifi- cant difference for the lower and upper thirds, whose AUDPC were highest on 0.90 m spacing, was observed too. The disease progress curves of the thirds did not fit the tested models. Significant results to the both covers situations, where the treatments grown on crotalária cover and without cover had highest AUDPC, were evidenced. The treatments with C. spectabilis cover were taller than other treatments. Significant data were observed for the cover crops used and in the treatments grown at 0.90 m spacing, to residual cover and crop yield, respectively. Keywords: Pennisetum glaucum; Crotalaria spectabilis; Areolate Mildew; High-Density Crops and No-Till 1. Introduction Areolate mildew, caused by fungus Ramularia areola G.F. Atk., [syn. = Ramularia gossypii (Speg.) Cif., Cer- cosporella gossypii Speg.], is among the main diseases affecting cotton crops, standing out for its early onset, leading to early defoliation and leaf lesions, decreasing photosynthetic leaf area and resulting in losses in pro- duction and fiber quality, in addition to high management costs [1,2]. The management of this disease has been based on in- tegrated measures, such as the use of partially resistant cultivars, sowing season, and especially fungicide appli- cation [3]. Thus, chemical control has been the measure most used by growers in Brazil’s Center-West region to reduce the R. areola inoculum when the disease reaches 25% of the leaf area in the lower third of plants [4-7], given that productivity losses can reach 30% when ways of control not are adopted, under the edaphoclimatic conditions prevailing on region [8]. In that context, the use of cover crops to improve the cultivation conditions has yielded positive effects on the chemical, physical and biological properties of soil, promoting nutrient cycling and providing adequate nutri- tional balance for plants. With that, plants can better re- act to diseases, improving growth conditions for crop sequencing, in addition to providing greater soil conser- vation, recovery and maintenance and improving its productive potential in the middle and long term [9]. Another alternative for optimizing yield is to adopt 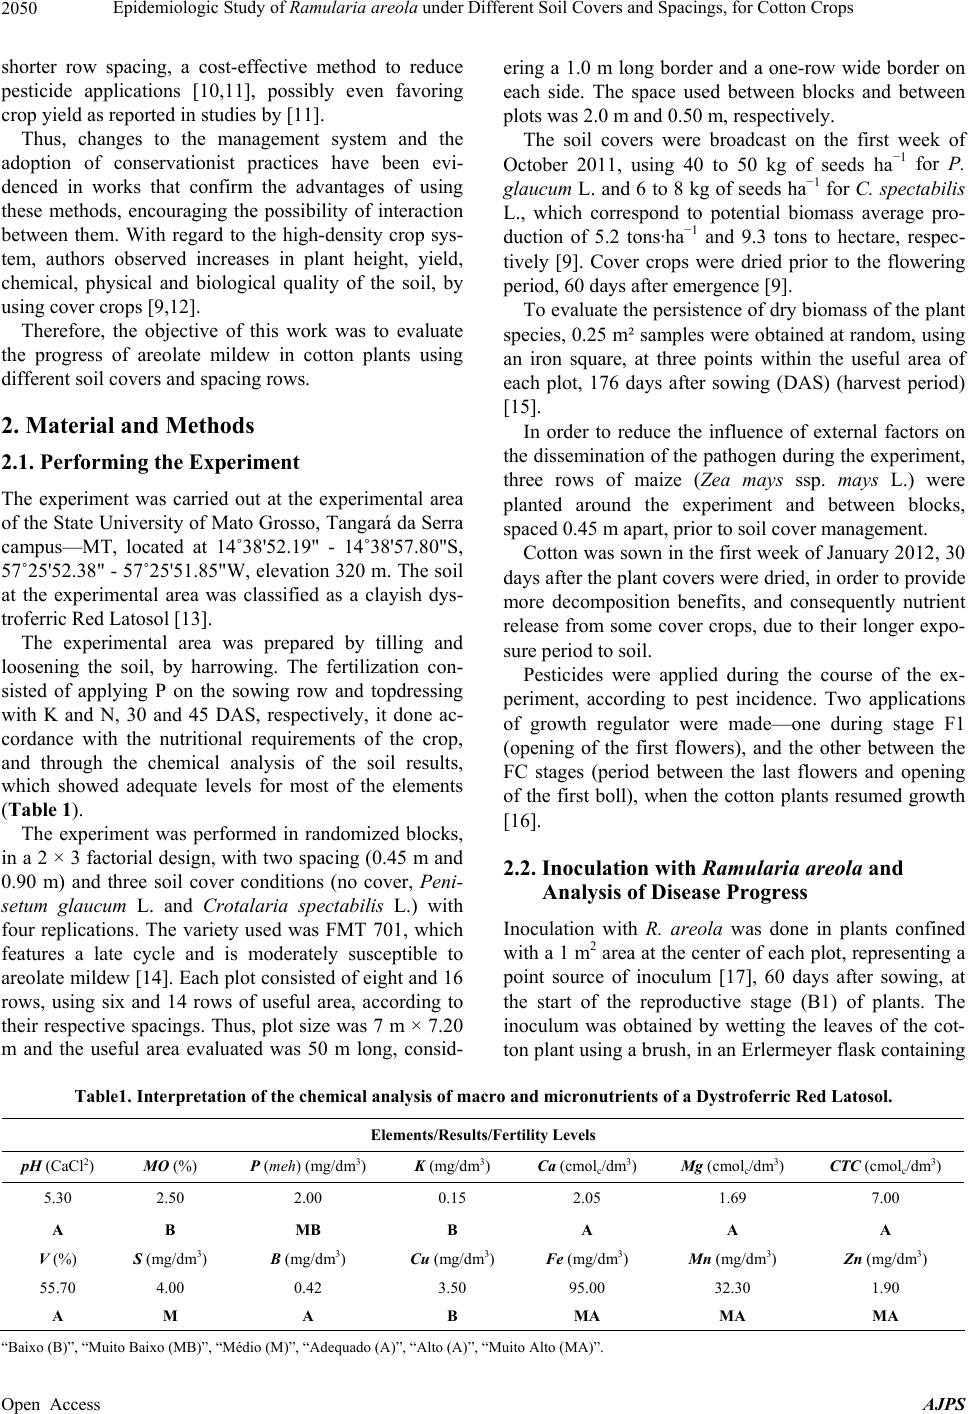 Epidemiologic Study of Ramularia areola under Different Soil Covers and Spacings, for Cotton Crops 2050 shorter row spacing, a cost-effective method to reduce pesticide applications [10,11], possibly even favoring crop yield as reported in studies by [11]. Thus, changes to the management system and the adoption of conservationist practices have been evi- denced in works that confirm the advantages of using these methods, encouraging the possibility of interaction between them. With regard to the high-density crop sys- tem, authors observed increases in plant height, yield, chemical, physical and biological quality of the soil, by using cover crops [9,12]. Therefore, the objective of this work was to evaluate the progress of areolate mildew in cotton plants using different soil covers and spacing rows. 2. Material and Methods 2.1. Performing the Experiment The experiment was carried out at the experimental area of the State University of Mato Grosso, Tangará da Serra campus—MT, located at 14˚38'52.19" - 14˚38'57.80"S, 57˚25'52.38" - 57˚25'51.85"W, elevation 320 m. The soil at the experimental area was classified as a clayish dys- troferric Red Latosol [13]. The experimental area was prepared by tilling and loosening the soil, by harrowing. The fertilization con- sisted of applying P on the sowing row and topdressing with K and N, 30 and 45 DAS, respectively, it done ac- cordance with the nutritional requirements of the crop, and through the chemical analysis of the soil results, which showed adequate levels for most of the elements (Table 1). The experiment was performed in randomized blocks, in a 2 × 3 factorial design, with two spacing (0.45 m and 0.90 m) and three soil cover conditions (no cover, Peni- setum glaucum L. and Crotalaria spectabilis L.) with four replications. The variety used was FMT 701, which features a late cycle and is moderately susceptible to areolate mildew [14]. Each plot consisted of eight and 16 rows, using six and 14 rows of useful area, according to their respective spacings. Thus, plot size was 7 m × 7.20 m and the useful area evaluated was 50 m long, consid- ering a 1.0 m long border and a one-row wide border on each side. The space used between blocks and between plots was 2.0 m and 0.50 m, respectively. The soil covers were broadcast on the first week of October 2011, using 40 to 50 kg of seeds ha−1 for P. glaucum L. and 6 to 8 kg of seeds ha−1 for C. spectabilis L., which correspond to potential biomass average pro- duction of 5.2 tons·ha−1 and 9.3 tons to hectare, respec- tively [9]. Cover crops were dried prior to the flowering period, 60 days after emergence [9]. To evaluate the persistence of dry biomass of the plant species, 0.25 m² samples were obtained at random, using an iron square, at three points within the useful area of each plot, 176 days after sowing (DAS) (harvest period) [15]. In order to reduce the influence of external factors on the dissemination of the pathogen during the experiment, three rows of maize (Zea mays ssp. mays L.) were planted around the experiment and between blocks, spaced 0.45 m apart, prior to soil cover management. Cotton was sown in the first week of January 2012, 30 days after the plant covers were dried, in order to provide more decomposition benefits, and consequently nutrient release from some cover crops, due to their longer expo- sure period to soil. Pesticides were applied during the course of the ex- periment, according to pest incidence. Two applications of growth regulator were made—one during stage F1 (opening of the first flowers), and the other between the FC stages (period between the last flowers and opening of the first boll), when the cotton plants resumed growth [16]. 2.2. Inoculation with Ramularia areola and Analysis of Disease Progress Inoculation with R. areola was done in plants confined with a 1 m2 area at the center of each plot, representing a point source of inoculum [17], 60 days after sowing, at the start of the reproductive stage (B1) of plants. The inoculum was obtained by wetting the leaves of the cot- ton plant using a brush, in an Erlermeyer flask containing Table1. Interpretation of the chemical analysis of macro and micronutrients of a Dystroferric Red Latosol. Elements/Results/Fertility Levels pH (CaCl2) MO (%) P (meh) (mg/dm3) K (mg/dm3) Ca (cmolc/dm3) Mg (cmolc/dm3) CTC (cmolc/dm3) 5.30 2.50 2.00 0.15 2.05 1.69 7.00 A B MB B A A A V (%) S (mg/dm3) B (mg/dm3) Cu (mg/dm3) Fe (mg/dm3) Mn (mg/dm3) Zn (mg/dm3) 55.70 4.00 0.42 3.50 95.00 32.30 1.90 A M A B MA MA MA “ Baixo (B)”, “Muito Baixo (MB)”, “Médio (M)”, “Adequado (A)”, “Alto (A)”, “Muito Alto (MA)”. Open Access AJPS  Epidemiologic Study of Ramularia areola under Different Soil Covers and Spacings, for Cotton Crops 2051 distilled water. The spore suspension was adjusted to the concentration of 104 conidia mL−1 of distilled water [18], with the aid of a Neubauer chamber. The analysis of the temporal progress of areolate mil- dew consisted of the severity of 10 plants marked in each plot, starting at the first symptoms of the disease, at an interval of five to seven days. The evaluations of temporal progress of R. areola in the treatments took place by evaluating the severity of the disease, in which severity was measured by a grade scale adapted from the diagram scale devised by [1] fea- turing nine levels of severity (Table 2). The lower, middle and upper thirds of ten marked plants were evaluated, considering as the lower third the leaves arranged up to the 7th node of the main stem, middle third from the 8th to 14th node, and upper third above the 15th node [1]. The scores were weighted using the Mckinney index [19] to calculate the disease index (DI) as a percentage, which represents the severity of the disease, expressed by the following equation: %.. 100DIfvn x Severity progress curves were created from the DI values, and the area under the disease progress curve (AUDPC) was calculated according to [17]: 2 1 1 112 n ii ii i UCPDt t The treatments were compared using the area under the disease progress curve for the severity of areolate mildew. 2.3. Fit of Mathematical Models In order to study the progress curves of areolate mildew and make comparisons of the epidemic of the disease between treatments, classical mathematical models such as logistic, Gompertz and monomolecular were tested, in an attempt to fit them to the disease severity progress curves. Logistic: 0 11 11expyyrt Gompertz: 0 exp lnexpyyrt Monomolecular: 11exp M xrt , in which: yx = estimation of the disease; 00 yx = initial in- oculum amount; r = specific rate of progress of the disease Table 2. Coefficient of determination (R*2), standard deviation of the initial inoculum (X0) and standard deviation of the infection rate (r) after fitting the Monomolecular, Logistic and Gompertz models to the data on the severity of areolate mil- dew in cotton crops. Lower Third Middle Third Upper Third Treatments Models R*2 (Y0) (r) R*2 (Y0) (r) R*2 (Y0) (r) Logístico 29.00 0.005360.002244.80 0.009720.0060047.85 0.00023 0.00595 Gompertz 29.20 0.008050.001605.79 0.010070.0018654.98 0.00000 0.00191 T1 Molecular 28.99 0.009460.0001710.29 0.014430.0002767.18 3822.77 0.00007 Logístico 26.22 0.021640.0006711.74 0.006790.0065042.88 0.00151 0.00921 Gompertz 26.24 0.005230.0012112.97 0.006940.0017946.29 0.00114 0.00235 T2 Molecular 26.21 0.005740.0001112.90 0.011540.0001954.58 3480.61 0.00006 Logístico 11.24 0.005940.004642.41 0.013530.0073945.80 0.00118 0.00672 Gompertz 11.24 0.005520.001233.28 0.013880.0022949.32 0.00053 0.00193 T3 Molecular 11.22 0.010480.000216.23 0.017620.0003260.20 3515.39 0.00006 Logístico 25.20 0.040660.00341−1.74 0.014430.0068940.04 0.00587 0.01038 Gompertz 0.29 256.905137002 −1.79 0.014770.0021350.24 0.01731 0.00371 T4 Molecular 25.19 0.022470.00041−1.42 0.016690.0003149.85 7428.54 0.00013 Logístico 21.39 0.011120.00425−0.87 0.012320.0077634.03 0.00772 0.01261 Gompertz 21.40 0.012850.00143−0.78 0.012620.0022436.50 0.00632 0.00382 T5 Molecular 21.38 0.016790.00031−0.20 0.014870.0002744.24 9473.26 0.00017 Logístico 32.55 0.013140.00374−0.05 0.009850.0061750.26 0.00401 0.00939 Gompertz 32.56 0.020240.002570.31 0.010150.0018553.10 0.00294 0.00279 T6 Molecular 32.54 0.017820.000300.22 0.013050.0002459.15 6070.18 0.00011 Open Access AJPS  Epidemiologic Study of Ramularia areola under Different Soil Covers and Spacings, for Cotton Crops 2052 for each model; and t = time. To select the regression model that best fit the data of the disease progress curves, the following criteria were collective considered: 1) highest adjusted coefficient of determination (R*2), obtained from the linear regression between the values predicted by the models (dependent variable) and those observed (independent variable), 2) lowest standard deviation for the initial inoculum and the disease progress rate, and 3) lowest variance and most random error distribution (observed severity minus se- verity estimated by the model) [17]. 2.4. Analysis of Soil Chemical Conditions under the Influence of Cover Crops In order to evaluate whether the chemical attributes of the soil underwent any change due to the cover crops and spacing, three soil samplings took place—the first before the start of the experiment, the second at the star of evaluations of disease incidence and severity (72 DAS), and the third after the cotton harvest (176 DAS). For the first collection, 20 grab samples were taken to form a composite sample of the 0 - 20 cm layer, and then submitted to routine chemical and physical analyses [12]. For the second and third samplings, four grab samples were taken to form a composite sample of the 0 - 20 cm and 20 - 40 cm layer, corresponding to each cover and spacing condition, totaling 12 composite samples. 2.5. Seedling Emergence and Final Stand of Cotton Plants Emergence and final stand evaluations were carried out, at 10 and 30 days after sowing, respectively, using 4.5 m² of the useful area of the plot. The data were converted into the percentage of seedlings with cotyledons above ground or live plants [20]. After the evaluation of final stand, the plants were lopped in order to maintain eight plants per meter in all plots. 2.6. Cotton Plant Height During the ripening period (FC), cotton plant height was evaluated by sampling 10 plants per plot, measuring the length, from the collar to the last apical bud, using a measuring tape graduated in centimeters [12,21]. The result was given in centimeters with the average for the 10 evaluated plants. 2.7. Evaluation of Climate Data Climate data were obtained for the period of disease in- oculation and evaluation (March-July 2012) from the Meteorology Institute (INMET), in order to relate cli- mate data to the epidemiology of areolate mildew. 2.8. Seed Cotton Yield The harvest was done manually, over 4.5 m2 of the useful area of each plot, in accordance with the methodology of [12], adapted to the experimental conditions of this work. The yield per plot was obtained by weighing the seed cotton in a 0.005 kg precision scale, and later converted into kg·ha−1. 2.9. Data Analysis The data were subjected to statistical analysis using SISVAR 5.3 software [22], the means between treat- ments were compared by Tukey’s test at 5% probability. SAEG software (Federal University of Viçosa) was used to the fit the mathematical models. Descriptive analysis was carried out to interpret soil results. 3. Results The progress curves of areolate mildew in the lower, middle and upper thirds are depicted in Figure 1. The first symptoms of the disease were detected twelve days after inoculation, which corresponds to 72 days after sowing (DAS) in all treatments and in the lower, middle and up- per thirds of all evaluated plants. By observing the peaks in the disease in the lower, middle and upper thirds, a gradient was detected in that order: in the lower third, the disease reached the peak of its severity at 82 and 104 DAS, later decreasing the se- verity curve starting at 111 DAS; at that time, the first severity peak was seen in the middle third, with a second peak at 125 DAS; the decline of the that curve coincided with the peak of disease severity in the upper third, at 132 DAS, in which the disease surpassed 20% severity only after 104 DAS (Figure 1). The declines in the disease severity curves were attrib- uted to the defoliation start caused by intense infection by disease, influencing particularly the lower third, con- sidering that the closure of the canopy of plants favors infection with the disease in the lower section of the can- opy. Throughout the disease progress, favorable climate conditions (temperature, moisture and rainfall) for pathogen development were observed (Figure 2). Opti- mal temperatures between 25˚C - 30˚C were recorded, but with temperatures prevalence between 20˚C - 25˚C, considered favorable for pathogen development. Significant hours at 12˚C - 20˚C range were also re- corded, between 116 and 128 DAS, coinciding with the peak of the disease severity curve in the middle third a preceding the peak of the disease severity curve in the upper third. Moisture values stood at over 13 hours of relative humidity above 80%, with highs of 98% and lows of 38%, while rainfall data behaved alternately with the Open Access AJPS  Epidemiologic Study of Ramularia areola under Different Soil Covers and Spacings, for Cotton Crops 2053 Figure 1. Progress curve of the Severity Index of areolate mildew in cotton plants, in the lower (a), middle (b) and upper (c) thirds, as a function of days after sowing (DAS). Open Access AJPS 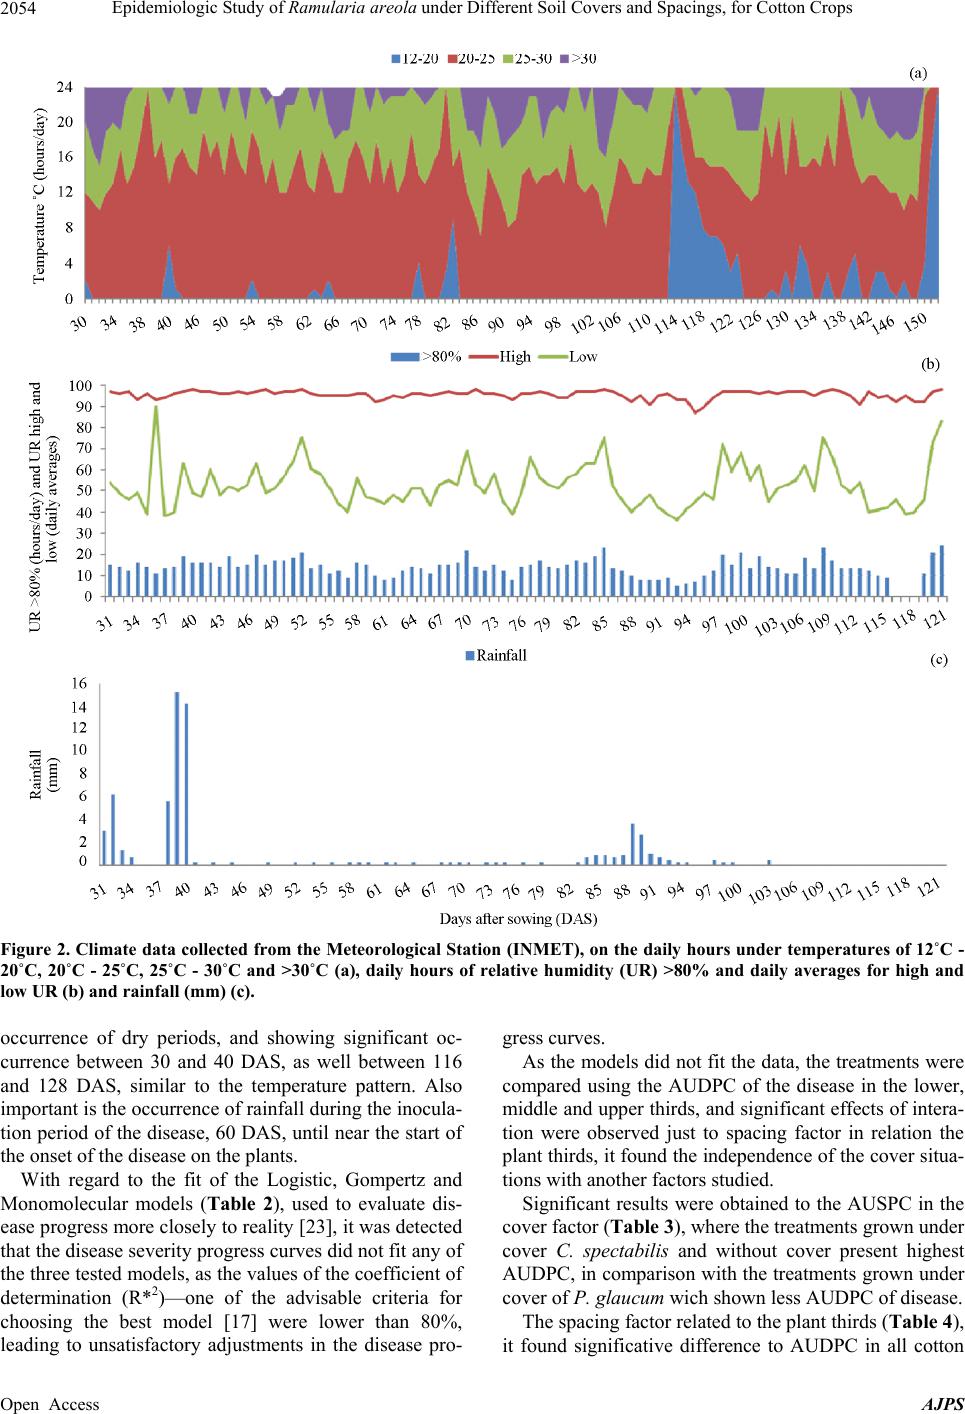 Epidemiologic Study of Ramularia areola under Different Soil Covers and Spacings, for Cotton Crops 2054 Figure 2. Climate data collected from the Meteorological Station (INMET), on the daily hours under temperatures of 12˚C - 20˚C, 20˚C - 25˚C, 25˚C - 30˚C and >30˚C (a), daily hours of relative humidity (UR) >80% and daily averages for high and low UR (b) and rainfall (mm) (c). occurrence of dry periods, and showing significant oc- currence between 30 and 40 DAS, as well between 116 and 128 DAS, similar to the temperature pattern. Also important is the occurrence of rainfall during the inocula- tion period of the disease, 60 DAS, until near the start of the onset of the disease on the plants. With regard to the fit of the Logistic, Gompertz and Monomolecular models (Table 2), used to evaluate dis- ease progress more closely to reality [23], it was detected that the disease severity progress curves did not fit any of the three tested models, as the values of the coefficient of determination (R*2)—one of the advisable criteria for choosing the best model [17] were lower than 80%, leading to unsatisfactory adjustments in the disease pro- gress curves. As the models did not fit the data, the treatments were compared using the AUDPC of the disease in the lower, middle and upper thirds, and significant effects of intera- tion were observed just to spacing factor in relation the plant thirds, it found the independence of the cover situa- tions with another factors studied. Significant results were obtained to the AUSPC in the cover factor (Table 3), where the treatments grown under cover C. spectabilis and without cover present highest AUDPC, in comparison with the treatments grown under cover of P. glaucum wich shown less AUDPC of disease. The spacing factor related to the plant thirds (Table 4), it found significative difference to AUDPC in all cotton Open Access AJPS 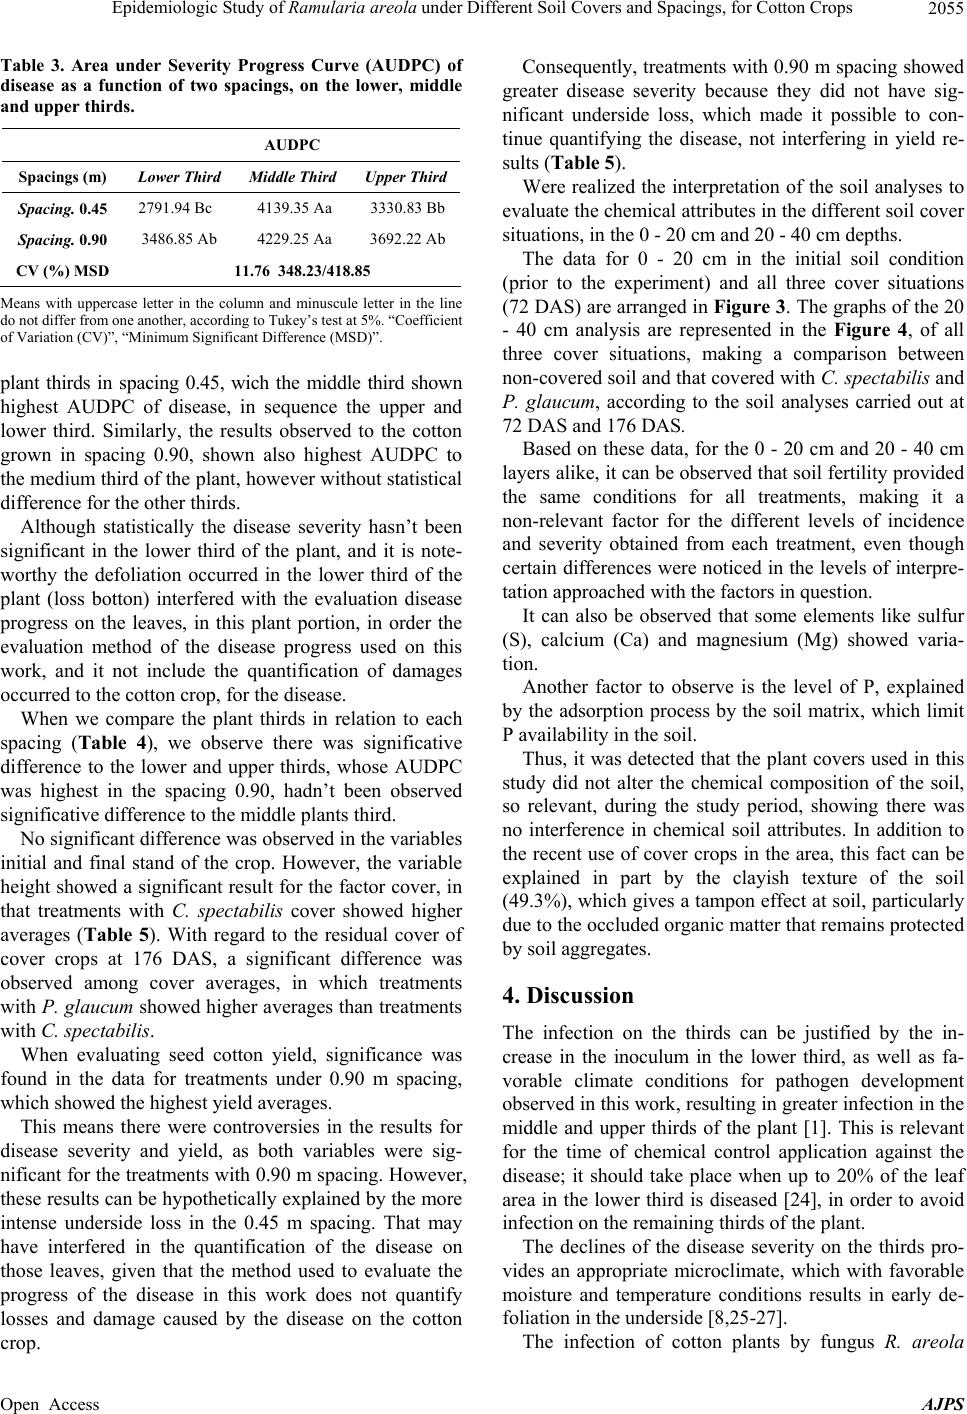 Epidemiologic Study of Ramularia areola under Different Soil Covers and Spacings, for Cotton Crops 2055 Table 3. Area under Severity Progress Curve (AUDPC) of disease as a function of two spacings, on the lower, middle and upper thirds. AUDPC Spacings (m) Lower Third Middle Third Upper Third Spacing. 0.45 2791.94 Bc 4139.35 Aa 3330.83 Bb Spacing. 0.90 3486.85 Ab 4229.25 Aa 3692.22 Ab CV (%) MSD 11.76 348.23/418.85 Means with uppercase letter in the column and minuscule letter in the line do not differ from one another, according to Tukey’s test at 5%. “Coefficient of Variation (CV)”, “Minimum Significant Difference (MSD)”. plant thirds in spacing 0.45, wich the middle third shown highest AUDPC of disease, in sequence the upper and lower third. Similarly, the results observed to the cotton grown in spacing 0.90, shown also highest AUDPC to the medium third of the plant, however without statistical difference for the other thirds. Although statistically the disease severity hasn’t been significant in the lower third of the plant, and it is note- worthy the defoliation occurred in the lower third of the plant (loss botton) interfered with the evaluation disease progress on the leaves, in this plant portion, in order the evaluation method of the disease progress used on this work, and it not include the quantification of damages occurred to the cotton crop, for the disease. When we compare the plant thirds in relation to each spacing (Table 4), we observe there was significative difference to the lower and upper thirds, whose AUDPC was highest in the spacing 0.90, hadn’t been observed significative difference to the middle plants third. No significant difference was observed in the variables initial and final stand of the crop. However, the variable height showed a significant result for the factor cover, in that treatments with C. spectabilis cover showed higher averages (Table 5). With regard to the residual cover of cover crops at 176 DAS, a significant difference was observed among cover averages, in which treatments with P. glaucum showed higher averages than treatments with C. spectabilis. When evaluating seed cotton yield, significance was found in the data for treatments under 0.90 m spacing, which showed the highest yield averages. This means there were controversies in the results for disease severity and yield, as both variables were sig- nificant for the treatments with 0.90 m spacing. However, these results can be hypothetically explained by the more intense underside loss in the 0.45 m spacing. That may have interfered in the quantification of the disease on those leaves, given that the method used to evaluate the progress of the disease in this work does not quantify losses and damage caused by the disease on the cotton crop. Consequently, treatments with 0.90 m spacing showed greater disease severity because they did not have sig- nificant underside loss, which made it possible to con- tinue quantifying the disease, not interfering in yield re- sults (Table 5). Were realized the interpretation of the soil analyses to evaluate the chemical attributes in the different soil cover situations, in the 0 - 20 cm and 20 - 40 cm depths. The data for 0 - 20 cm in the initial soil condition (prior to the experiment) and all three cover situations (72 DAS) are arranged in Figure 3. The graphs of the 20 - 40 cm analysis are represented in the Figure 4, of all three cover situations, making a comparison between non-covered soil and that covered with C. spectabilis and P. glaucum, according to the soil analyses carried out at 72 DAS and 176 DAS. Based on these data, for the 0 - 20 cm and 20 - 40 cm layers alike, it can be observed that soil fertility provided the same conditions for all treatments, making it a non-relevant factor for the different levels of incidence and severity obtained from each treatment, even though certain differences were noticed in the levels of interpre- tation approached with the factors in question. It can also be observed that some elements like sulfur (S), calcium (Ca) and magnesium (Mg) showed varia- tion. Another factor to observe is the level of P, explained by the adsorption process by the soil matrix, which limit P availability in the soil. Thus, it was detected that the plant covers used in this study did not alter the chemical composition of the soil, so relevant, during the study period, showing there was no interference in chemical soil attributes. In addition to the recent use of cover crops in the area, this fact can be explained in part by the clayish texture of the soil (49.3%), which gives a tampon effect at soil, particularly due to the occluded organic matter that remains protected by soil aggregates. 4. Discussion The infection on the thirds can be justified by the in- crease in the inoculum in the lower third, as well as fa- vorable climate conditions for pathogen development observed in this work, resulting in greater infection in the middle and upper thirds of the plant [1]. This is relevant for the time of chemical control application against the disease; it should take place when up to 20% of the leaf area in the lower third is diseased [24], in order to avoid infection on the remaining thirds of the plant. The declines of the disease severity on the thirds pro- vides an appropriate microclimate, which with favorable moisture and temperature conditions results in early de- foliation in the underside [8,25-27]. The infection of cotton plants by fungus R. areola Open Access AJPS 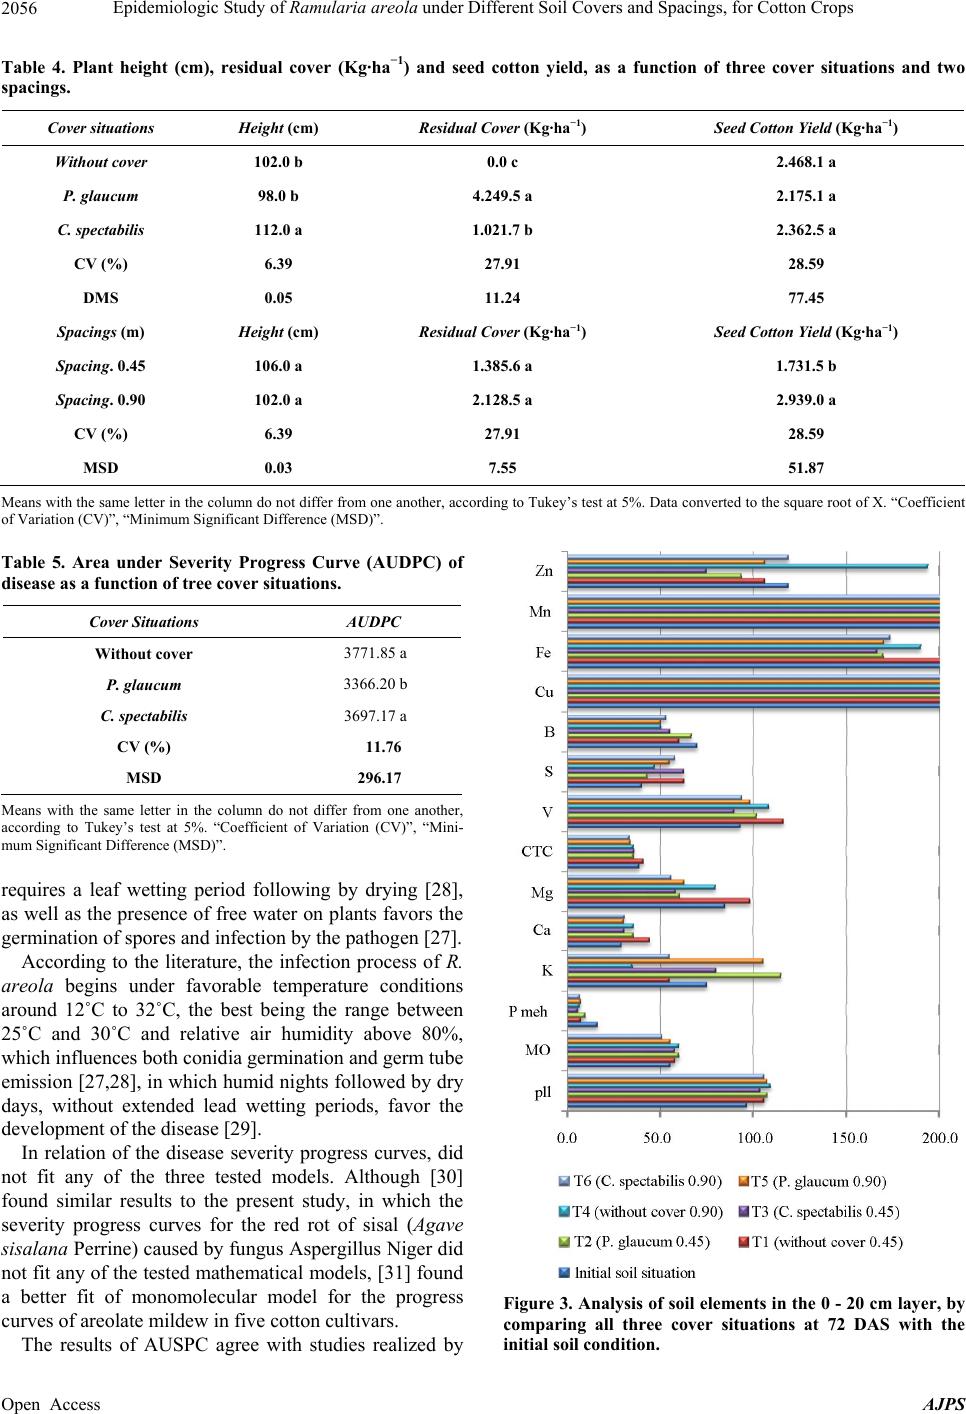 Epidemiologic Study of Ramularia areola under Different Soil Covers and Spacings, for Cotton Crops Open Access AJPS 2056 Table 4. Plant height (cm), residual cover (Kg·ha−1) and seed cotton yield, as a function of three cover situations and two spacings. Cover situations Height (cm) Residual Cover (Kg·ha−1) Seed Cotton Yield (Kg·ha−1) Without cover 102.0 b 0.0 c 2.468.1 a P. glaucum 98.0 b 4.249.5 a 2.175.1 a C. spectabilis 112.0 a 1.021.7 b 2.362.5 a CV (%) 6.39 27.91 28.59 DMS 0.05 11.24 77.45 Spacings (m) Height (cm) Residual Cover (Kg·ha−1) Seed Cotton Yield (Kg·ha−1) Spacing. 0.45 106.0 a 1.385.6 a 1.731.5 b Spacing. 0.90 102.0 a 2.128.5 a 2.939.0 a CV (%) 6.39 27.91 28.59 MSD 0.03 7.55 51.87 Means with the same letter in the column do not differ from one another, according to Tukey’s test at 5%. Data converted to the square root of X. “Coefficient of Variation (CV)”, “Minimum Significant Difference (MSD)”. Table 5. Area under Severity Progress Curve (AUDPC) of disease as a function of tree cover situations. Cover Situations AUDPC Without cover 3771.85 a P. glaucum 3366.20 b C. spectabilis 3697.17 a CV (%) 11.76 MSD 296.17 Means with the same letter in the column do not differ from one another, according to Tukey’s test at 5%. “Coefficient of Variation (CV)”, “Mini- mum Significant Difference (MSD)”. requires a leaf wetting period following by drying [28], as well as the presence of free water on plants favors the germination of spores and infection by the pathogen [27]. According to the literature, the infection process of R. areola begins under favorable temperature conditions around 12˚C to 32˚C, the best being the range between 25˚C and 30˚C and relative air humidity above 80%, which influences both conidia germination and germ tube emission [27,28], in which humid nights followed by dry days, without extended lead wetting periods, favor the development of the disease [29]. In relation of the disease severity progress curves, did not fit any of the three tested models. Although [30] found similar results to the present study, in which the severity progress curves for the red rot of sisal (Agave sisalana Perrine) caused by fungus Aspergillus Niger did not fit any of the tested mathematical models, [31] found a better fit of monomolecular model for the progress curves of areolate mildew in five cotton cultivars. Figure 3. Analysis of soil elements in the 0 - 20 cm layer, by comparing all three cover situations at 72 DAS with the nitial soil condition. The results of AUSPC agree with studies realized by i  Epidemiologic Study of Ramularia areola under Different Soil Covers and Spacings, for Cotton Crops 2057 Figure 4. Analysis of soil elements in the 20 - 40 cm, by comparing all three cover situations at 72 DAS (a) and 176 DAS (b), and the initial soil situation. [32] evaluating the areolate mildew severity in different handling systems, reported less severity of disease in sowing direct system (SDS), whose principles are based in the cover soil and in the crop turn, followed of con- ventional system with crop turn biannual. These same authors confirm yet that is possible to re- duce significantly the incidence of diseases in cotton crop just with the changes on the production system ac- tually used, for example, by providing an adequate sup- ply of straw in the SDS, this essential feature to the sys- tem, making it possible to obtain a satisfactory level of control of certain diseases. In relation the disease severity on the thirds, [29] re- lated the diseases occurrence on this portion of the plant, is favored as a function of the accumulation of the mois- ture in the lower canopy of plants. The results of the thirds plant in relation of each spac- ing, contrast the [29] information that relate the diseases occurrance is favored as a function of dense crops, due to shading that begins early in culture. The plant height results corroborate those found by [12], who while studying cotton plant cultivars under organic system with no-tillage in different soil covers, observed greater plant height on C. juncea straw for cul- tivar BRS Itaúba. However, in works with vegetal, grass and legume species as soil cover for cotton crops (cultivar BRS Cedro), no significant difference was observed for that variable [15,33]. To the residual cover results, can be explained by studies of [15]using vegetal species for soil cover in cot- ton crops under no-till, values of 906 Kg·ha−1 and 2.422 Kg·ha−1 of straw were obtained for C. spectabilis and P. glaucum, respectively, during the same period (175 DAS). This fact is explained by the low C/N ratio of legumes such as C. spectabilis, leading some authors to suggest a mixture of legumes and grasses in order to achieve an intermediate C/N ratio. That makes it possible to de- crease the rate of decomposition of vegetal wastes and increase N supply compared to grass-only use [15]. The seed cotton yield results differ from those found by [11], detected a significant difference in yield while studying cotton varieties at different spacings (0.90 m and 0.45 m), with superior yields in the high-density crop system. In relation of the soil data, was observed variability in some elements, that can be explained, as in the case of S, or even by their export to the crop, as in the case of Ca, which is a component that gives firmness plant structure, and Mg, 75% of which is absorbed by the crop after be- ing removed from the soil by the plant [34]. According to [35], the behavior of sulfate (form avail- able to plants), is similar to that of nitrate, resulting from the mineralization of organic matter, which is continuous during the crop cycle and varies according to environ- mental conditions. 5. Conclusion Overall, significant effects are related to the covers situa- tions, noting up lower AUDPC in cotton plants grown Open Access AJPS  Epidemiologic Study of Ramularia areola under Different Soil Covers and Spacings, for Cotton Crops 2058 under P. glaucum cover, and significant interaction re- sults between spacing and plant thirds, where the middle third present highest AUDPC in both spacing used, are obtained. It was not possible to fit the disease severity data of the thirds of the plant to any of the tested models. Plant height was influenced by C. spectabilis as cover, which showed the lowest average biomass residue. Even showing greater disease severity, crop yield was higher in the treatments with 0.90 m spacing. Soil fertility con- ditions were similar for all treatments, not interfering with the epidemiology of the disease. 6. Acknowledgements We wish to thank the Coordination for the Improvement of Higher Education Personnel (CAPES), for the grant given to the first author; to the Graduate Environment and Agricultural Production Systems Program (PPGAT) and all faculty members for the support and assistance given during the study period. REFERENCES [1] L. A. Aquino, P. G. Berger, F. A. Rodrigues, L. Zambolim, F. Ogoshi, L. M. Miranda and M. M. Lélis, “Alternative control of the Cotton Ramularia Spot,” Summa Phyto- pathologica, Vol. 34, No. 2, 2008, pp. 131-136. http://dx.doi.org/10.1590/S0100-54052008000200004 [2] V. S. Lucena, “Caracterização da Resistência do Algo- doeiro a Ramularia areola e Variabilidade Molecular do Patógeno,” MSc. Dissertation, Universidade Federal do Rio Grande do Norte, Natal, 2007. [3] L. G. Chitarra, A. S. Meira and V. L. Menezes, “Controle Químico da Mancha de Ramulária do Algodoeiro, Causada por R amulari a areola, em Função da Idade da Planta e da Severidade da Doença—Safra 2003/2004,” Embrapa/ Ministério da Agricultura, Pecuária e Abastecimento, Campina Grande, 2005. (Boletim de Pesquisa e Desen- volvimento, 58) [4] P. M. C. Andrade, D. Cassetari Neto and A. Q. Machado, “Controle Químico de Doenças em Algodão no Mato Grosso,” Fitopatologia Brasileira, Vol. 24, 1999, p. 262. [5] D. Cassetari Neto, R. S. S. Machado, A. Y. K. Faria, J. J. Leite, E. Valcanaia, D. V. Araújo, J. R. Andrade, W. P. Avila, S. Caye and D. Arnhold, “Avaliação de Fungicidas no Controle de Doenças em Algodão no Mato Grosso,” Fitopatologia Brasileira, Vol. 25, 2000, p. 363. [6] D. Cassetari Neto and A. Q. Machado, “Diagnose e Controle de Doenças do Algodão,” Universidade do Estado de Mato Grosso/FAMEV, Cuiabá, 2000. [7] A. G. Prade, D. A. Fornarolli and D. S. Lizzi, “Controle Químico da Mancha de Ramulária em Algodão,” Fito- patologia Brasileira, Vol. 25, 2000, p. 413. [8] N. D. Suassuna and W. M. Coutinho, “Manejo das Principais Doenças do Algodoeiro no Cerrado Brasileiro,” In: E. C. Freire, Ed., Algodão no Cerrado do Brasil, ABRAPA, Brasília, 2007, pp. 479-521. [9] A. M. Carvalho and R. F. Amabile, “Cerrado: Adubação Verde,” Embrapa Cerrado, Planaltina, 2006. [10] D. M. P. de Azevedo, et al., “Período Crítico de Com- petição Entre Plantas Daninhas e o Algodoeiro Anual Irrigado,” Pesquisa Agropecuária Brasileira, Vol. 29, 1994, pp. 1477-1425. [11] J. S. F. Ribeiro, P. H. M. Nogueira, M. A. Camacho and J. G. Bertalli, “Espaçamento do Algodoeiro Sobre Caracter- ísticas Morfológicas e Produção de Duas Variedades em Maracaju (MS),” In: C. B. do Algodão, Ed., Susten- tabilidade da Cotonicultura Brasileira e Expansão dos Mercados: Anais, Embrapa Algodão, Campina Grande, 2009, pp. 1234-1241. [12] E. M. Arantes, “Algodão Branco e Colorido Cultivado no Sistema Orgânico com Plantio Direto em Diferentes Coberturas de Solo,” MSc. Dissertation, Universidade Federal de São Carlos, São Carlos, 2010. [13] Embrapa, “Sistema Brasileiro de Classificação de Solos,” Centro Nacional de Pesquisa de Solos, Rio de Janeiro, 1999. [14] M. T. Fundação, “Algodão: Cultivares Convencionais,” 2012. http://www.fundacaomt.com.br/algodao/?cult=fmt701 [15] A. C. B. Ferreira and F. M. Lamas, “Cover Crops: Effects on Weeds and Cotton Yield in No-Tillage System,” Revista Ceres, Vol. 57, No. 6, 2010, pp. 778-786. http://dx.doi.org/10.1590/S0034-737X2010000600013 [16] F. M. Lamas and A. C. B. Ferreira, “Reguladores de Crescimento na Cultura do Algodoeiro,” Embrapa Agro- pecuária Oeste, Dourados, 2006. (Comunicado Técnico, 121) [17] C. L. Campbell and L. V. Madden, “Introduction to Plant Disease Epidemiology,” John Wiley & Sons, New York, 1990. [18] R. C. A. Antonini, “Métodos de Análise e Monitoramento Microbiológico em Laboratório de Destilaria,” Universi- dade Federal de São Carlos, São Carlos SP, 2004. [19] H. H. McKinney, “Influence of Soil Temperature and Moisture on Infection of Wheat Seedings by Helminto- sporium sativum,” Journal Agricultural Research, Vol. 26, 1923, pp. 195-219. [20] J. Nakagawa, “Testes de Vigor Baseados na Avaliação de Plântulas,” In: R. D. Vieira and N. M. Carvalho, Eds., Testes de Vigor em Sementes, FUNEP, Jaboticabal, 1994 pp. 49-85. [21] J. A. Freitas, E. B. Silva, J. Fallieri, M. A. Lanza, R. S. Faria and P. J. Silva, “Tamanho de Amostra na Parcela Para Caracterização da Altura de Plantas de Algodoeiro Herbáceo Gossypium hirsutum,” Ciência Rural, Vol. 31, 2001, pp. 583-587. [22] D. F. Ferreira, “Sistema de Análise de Variância, Versão 5.3,” Universidade Federal de Lavras, Lavras, 2010. [23] A. Bergamin Filho, “Curvas de Progresso da Doença,” In: L. Amorin, J. A. M. Rezende and A. Bergamin Filho, Eds., Manual de Fitopatologia, Agronômica Ceres, Piracicaba, 2011, pp. 647-666. [24] Embrapa, “Cultura do Algodão no Cerrado,” 2013. http://sistemasdeproducao.cnptia.embrapa.br/FontesHTM Open Access AJPS  Epidemiologic Study of Ramularia areola under Different Soil Covers and Spacings, for Cotton Crops Open Access AJPS 2059 L/Algodao/AlgodaoCerrado/doencas.htm [25] L. A. de Aquino, “Escala Diagramática e Controle Alter- nativo da Mancha de Ramulária do Algodoeiro,” MSc. Dissertation, Universidade Federal de Viçosa, Viçosa, 2006. [26] C. R. S. Curvêlo, F. A. Rodrigues, P. G. Berger and D. C. Rezende, “Microscopia Eletrônica de Varredura do Processo Infeccioso de Ramularia areola em Folhas de Algodoeiro,” Tropical Plant Pathology, Vol. 35, 2010, pp. 108-113. [27] M. M. Iamamoto, “Reação de Cultivares de Algodoeiro a Ramularia areola,” MSc. Dissertation, Universidade Estadual Paulista, Jaboticabal, 2003. [28] Y. Rathaiah, “Spore Germination and Mode of Cotton Infection by Ramularia areola,” Phytopathology, Vol. 67, 1977, pp. 351-357. http://dx.doi.org/10.1094/Phyto-67-351 [29] F. A. Paiva, “Doenças,” In: Embrapa Agropecuária do Oeste, Algodão: Tecnologia de Produção, Embrapa Algodão, Dourados, 2001, pp. 245-266. [30] K. C. L. de M. Abreu, “Epidemiologia da Podridão Vermelha do Sisal no Estado da Bahia,” DSc. Thesis, Universidade Federal do Recôncavo da Bahia, Bahia, 2010. [31] L. L. de Lima, M. Barreto and E. A. G. Scaloppi, “Cotton Cultivars Resistance to Ramularia areola,” Summa Phytopathologica, Vol. 36, No. 1, 2010, pp. 57-60. http://dx.doi.org/10.1590/S0100-54052010000100010 [32] L. G. Chitarra and F. M. Lamas, “Severidade da Mancha de Ramulária e Ramulose em Função do Sistema de Manejo do Solo em Cultivares de Algodoeiro,” In: Congresso Brasileiro do Algodão, ABRAPA: AMIPA: EMBRAPA, Uberlândia, 2007. [33] F. M. Lamas and L. A. Staut, “Biomassa Seca de Diferentes Espécies Vegetais e o Cultivo do Algodoeiro em SPD no Cerrado,” In: Congresso Brasileiro do Algodão, ABRAPA: AMIPA: EMBRAPA, Uberlândia, 2007. [34] L. A. Staut and C. H. Kurihara, “Calagem, Nutrição e Adubação,” In: Embrapa Agropecuária Oeste, Algodão: Informações Técnicas, Embrapa Agropecuária Oeste/ Embrapa Algodão, Dourados, 1998. (Circular Técnica, 7) [35] T. A. Rein and D. M. G. Sousa, “Adubação com Enxofre,” In: D. M. G. Sousa and E. Lobato, Eds., Cerrado: Correção do Solo e Adubação, Embrapa Informação Tecnológica, Brasília, 2004, pp. 227-242.
|