Energy and Power Engineering, 2013, 5, 1032-1036
doi:10.4236/epe.2013.54B197 Published Online July 2013 (http://www.scirp.org/journal/epe)
Study on Long-Term Generation Expansion Planning
upon the LNG Price Fluctuations
Min-Chul Kim, Soon-Hyun Hwang, Seok-Man Han, Balho. H. Kim
Hong-Ik University, Seoul, South Korea., KEMCO
Email: alscjf03@hanmail.net, kerobes13@nate.com, bhkim0711@gmail.com
Received April, 2013
ABSTRACT
About 37% of South Korea’s greenhouse gas emission is from electricity generation. Most of the country’s electric
power is fundamentally generated by nuclear, thermal and LNG facilities. And LNG, of them, is characterized to re-
quire high cost for power generation but CO2 coefficient is lower than thermal generation. Amid the ongoing global
efforts to tackle global warming, shale gas introduction and changing global environment, LNG prices are expected to
fluctuate. Against this backd rop, this p aper seeks to perform scenario tests on LNG fuel cost fluctuation and examine its
long-term effects on generation expansion planning.
Keywords: LNG, Shale Gas; Generation Expansion Planning; Price Fluctuation
1. Introduction
About 37% of South Korea's greenhouse gas emission is
from electricity generation. Most of the country's electric
power is fundamentally generated by nuclear, thermal
and LNG facilities. And LNG, of them, is characterized
to require high cost for power generation but CO2 coef-
ficient is lower than thermal generation. Amid the ongo-
ing global efforts to tackle global warming, shale gas
introduction and changing global environment, LNG
prices are expected to fluctuate. Against this backdrop,
this paper seeks to perform scenario tests on LNG fuel
cost fluctuation and examine its long-term effects on
generation expansion planning.
2. Factors for LNG Price Fluctuation
2.1. International LNG Supply/Demand & Price
Movement
The world’s natural gas production, as of 2010, is ap-
proximately 2.3 5 billion ton. And 1.64 billion ton or 69%
of the production is consumed within countries of pro-
duction themselves and the remaining 720 million ton is
exported to other countries. As of 2011, 5 Asian coun-
tries - Japan, South Korea, India, Taiwan and China - are
mainly importing the LNG, accounting for 63% of the
global LNG importation. The US increased own LNG
production, reducing import by 13% from the previous
year to 60 billion ton in 2011.
LNG trading, for its own nature, normally takes place
based on long-term contracts. But with the recent rise in
shale gas production, LNG supply surplus also climbed,
causing some people who take profit from different pric-
es between regions. In this situation, short-term based
trading has risen.
Looking at regional price movement, we can notice
that Atlantic market prices are weaker and Northeast
Asian market prices are going up long with its high oil
prices and spot prices. Figure 1 below shows price
movem e nt of natural gas and oil [1] .
In Figure 1, Japan shows faster increase of spot prices
than long-term contract prices after the Fukushima nu-
clear accident. South Korea maintains lower import price
than Japan f o r its lower shar e o f spots.
2.1.1. Shale Gas Reserves & Production Ratio
The Shale gas reserves found so far is estimated at ap-
proximately 187.4 trillion m2, an amount to support the
world for about 6 decades. If put in terms of thermal unit,
Figure 1. Natural Gas/Oil price moveme nt.
Copyright © 2013 SciRes. EPE
M.-C. KIM ET AL. 1033
Table 1. Comparison of traditional gas reserves and shale
gas reserves.
Traditional Gas Shale Gas
Country Reserve
(Trillion m3) Portion
(%) Reserve
(Trillion m3) Portion
(%)
US/Canada 9.4 5 35.4 19
China 2.8 2 36.1 19
Europe 18.3 10 17.7 9
Russia 44.8 24 - -
Middle East 75.8 41 - -
Global 187.1 100 187.4 100
shale gas would be 168.7 billio n toe an d o il, 188.8 billion
toe. This is pretty vast amount o f reserves. Fo r this result,
31 countries were surveyed so more countries could be
included in the future. The world’s potential reserve is
estimated at 635 trillion m3, which could sustain for two
more centuries.
As of 2011, shale gas production accounts for 28% of
the total natural gas produ ction and is expected to rise to
50% by 2035[2].
2.2. Global LNG Market Outlook
From a short-term perspective, LNG demand is likely to
surge as more people show opposition to nuclear power
generation and try to find its alternative. But in the long-
term, LNG prices are projected to fall mainly because of
diverse shale gas-based export p rojects in many coun tries
including the US and Canada. From 2020, China, which
holds the largest shale gas reserves, will start to produce
in full scale and contribute to further price drop.
3. Application of Generation Expansion
Planning Model
3.1. Generation Expansion Planning
Generation expansion plan refers to annual plans on
power plant construction established in order to satisfy
growing national demand for electricity with diverse
units having different features such as construction cost,
fuel cost and operational characteristics [3]. The purpose
of designing the generation expansion plan is to secure
the most economic source of power that could help
maintain supply reliability for a given estimated electric-
ity demand every year.
In pursuing this study, we plan to employ a computa-
tion model developed by the Economy in Electricity Re-
search Center of Hong-ik University to come up with
optimal yearly generation expansion plans reflecting RPS
(Renewable Portf olio Standard) for power companies.
3.2. Computation Model Algorithm
The computation model obtains the optimal plan based
on Dynamic Programming method [4]. The composition
of the computation model is similar to WASP model,
which is used for South Korea's generation expansion
planning but for the fact that the former has only 4 basic
modules unlike the latter which has 6. Each module is
operated individually and their results are made in a file
as an input to other modules. In this way, the model
functions consistently, realizing easy and fast process to
get results.
Figure 2. Computation model outline.
Figure 3. Computation model composition.
Copyright © 2013 SciRes. EPE
M.-C. KIM ET AL.
1034
3.3. Mathematical Formalization
The issue of optimal power resource composition with
cost-efficiency can be formalized as follows:
where,
t : Year
T : Period of the pl an
i : Type of the plant
I : Total number of plant ty pes
: Capacity of unit ‘i’ in year ‘t’(MW)
: Capacity of unit type ‘i’ which will be in-
serted in year ‘t’
: Total generation amount of plant type ‘i’ in
year ‘t’
: Total operation cost in year ‘t’(KRW)
: Total construction cost in year ‘t’(KRW)
: Supply reliability in year ‘t’(LOLP)
: Criterion of supply reliability in year ‘t’
: Amount of C O2 emis si ons whi c h are pr o-
duced by in year ‘t’(ton)
: Total permi ssi bl e mount of the Emi ssi on i n
year ‘t’(ton)
: The minimum construction capacity in year
‘t’
: The maximum construction capacity in year
‘t’
Equation (1) represents a cost-minimization function
and consists of annual operational cost and construction
cost. Equation (3) is a constraint to check if the given
facility can uphold the reliability while meeting the de-
mand at ‘ ’ year. Any unit combination that does not
meet this constraint is excluded from a state. Equation (6)
put both upper and lower limits on the number of possi-
ble new units to be built each year to prevent concentra-
tion in building only specific power source facilities
while ensuring the practicality of its resulting values. The
that satisfies such conditions and minimizes
on
4. Case Study
signing
th National Long-term Elec-
4.2. Scenario Results
cost changes depending upon
5. Conclusions
ed changes in generation expansion
Table 2. LNG Price Fluctuation Scenario.
the functi at the same time is the very p lan of potential
yearly power facility con struction and it is th e generation
expansion plan with minimum cost.
4.1. Scenario De
In this paper, based on the 5
tricity Plan's input data, we analyzed scenarios to draw
reasonable options of power source combination accord-
ing to LNG price fluctuation. We plotted a scenario ex-
clusively based on the 5th National Long-term Electricity
Plan for every condition and the years covered herein
were from 2013 to 2027. Discount rate was set at 6.5%.
RPS was employed for new and renewable energy policy.
As for supply reliability, LOLP (0.5 days/year) was used
and reserve rate was set at 20~30%. To carry out the
supply plan scenarios according to LNG price fluctuation
as sought by this study, we set LNG fuel cost at 67.145
(1000 KRW/Gcal).
The total accumulated
LNG price decreased by 6.6% and 15.06% when 30%
and 50%, respectively. However, the yearly unit mix
exhibited no change in the final year's unit composition.
This is maybe because, the total cost drop was only due
to the reduced fuel cost for LNG units and no change in
construction cost. Even if LNG prices fall by 50%, they
still may not have an y competitiv e edg e ov er other power
sources.
This study examin
plans according to natural gas price fluctuation, based on
the data of the 5th National Long-term Electricity Plan of
South Korea. LNG is a basis power source accounting
for 22% of the country's total power generation but it is
true that its economic feasibility is poorer than that of
nuclear power generation and thermal generation. With
the planned introduction of shale gas, however, LNG
demand is expected to change along with global situation.
And these will further change fuel costs. It is viewed
possible that in such a situation, LNG could improve its
economic feasibility to compete with other sources. LNG,
No. Scenario
1 base ost LNG Fuel C
2 Fuel Cost re scenario educed 30% beside bas
3 Fuel Cost reduced 50% beside base scenario
value of
Copyright © 2013 SciRes. EPE
M.-C. KIM ET AL. 1035
Table. Compag to 3rision of Accumulated Cost Accordin
LNG Price Fluctuation (unit : 1000 KRW).
Accumulated Cost
Year Scenario 1 Scenario 2 Scenario 3
2013 39,912,925 56,018,261 52,918,520
2014 81,574,861 87,227,204 83,095,508
2015 116,988,931 114,948,710 109,093,258
2016 153,351,641 143,736,800 135,600,278
2017 187,306,499 173,417,151 162,430,957
2018 224,352,211 203,639,970 191,461,086
2019 251,493,238 231,893,647 214,517,156
2020 277,168,901 257,317,087 237,166,953
2021 300,865,281 280,083,160 257,412,066
2022 322,747,702 301,269,670 276,362,852
2023 340,714,484 318,530,822 291,490,594
2024 356,234,529 334,221,630 305,406,923
2025 371,344,908 347,869,028 317,341,374
2026 385,518,003 360,600,010 328,416,224
2027 399,100,524 372,761,470 338,976,995
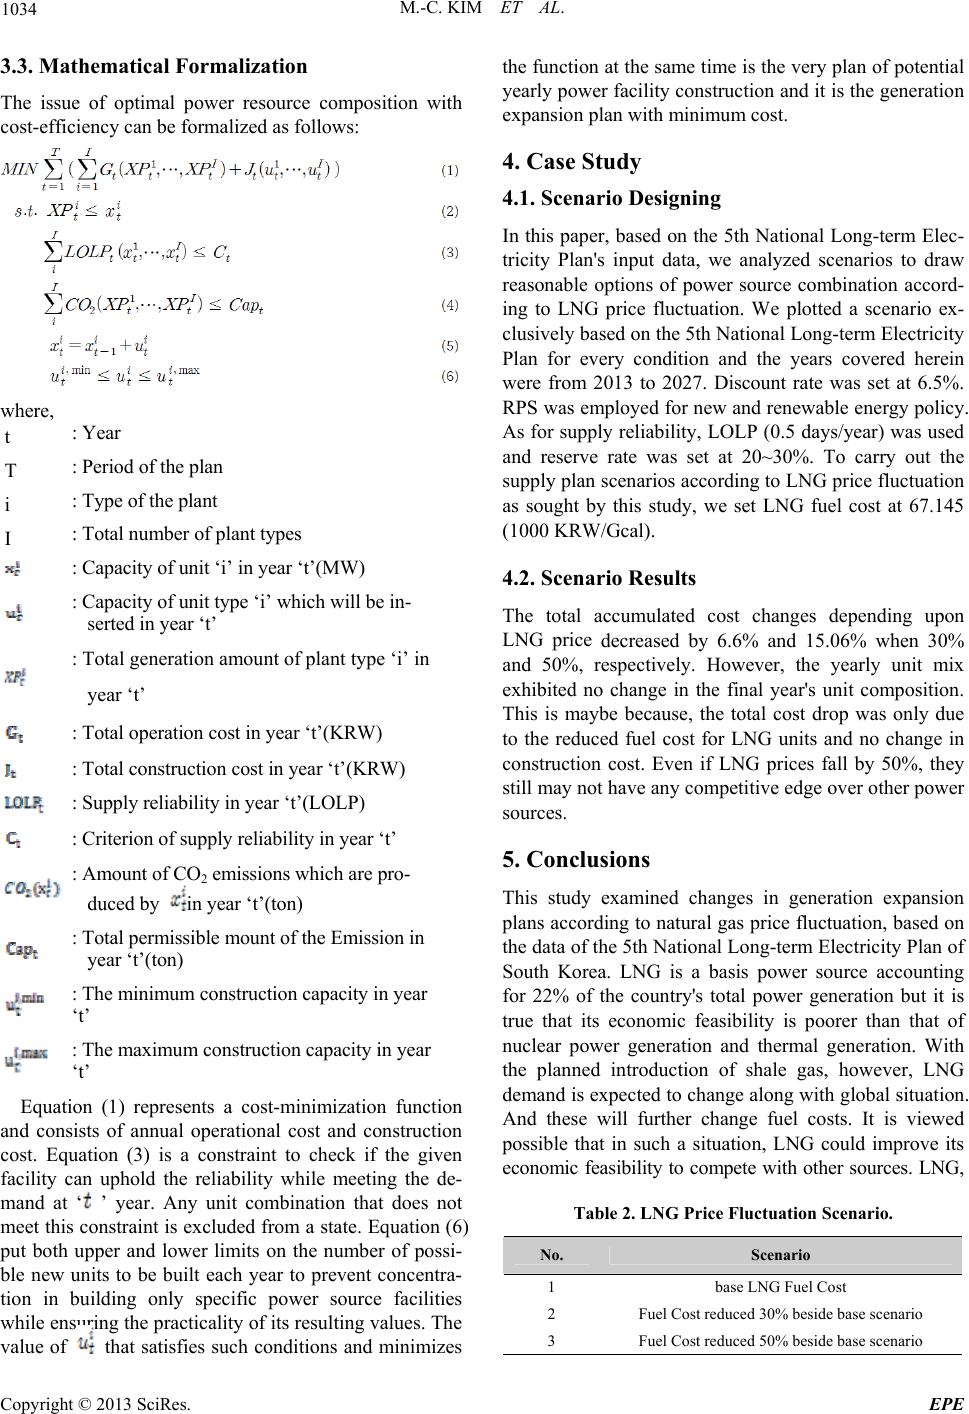
Figure 4. Accumulated cost movement of scenario 1.
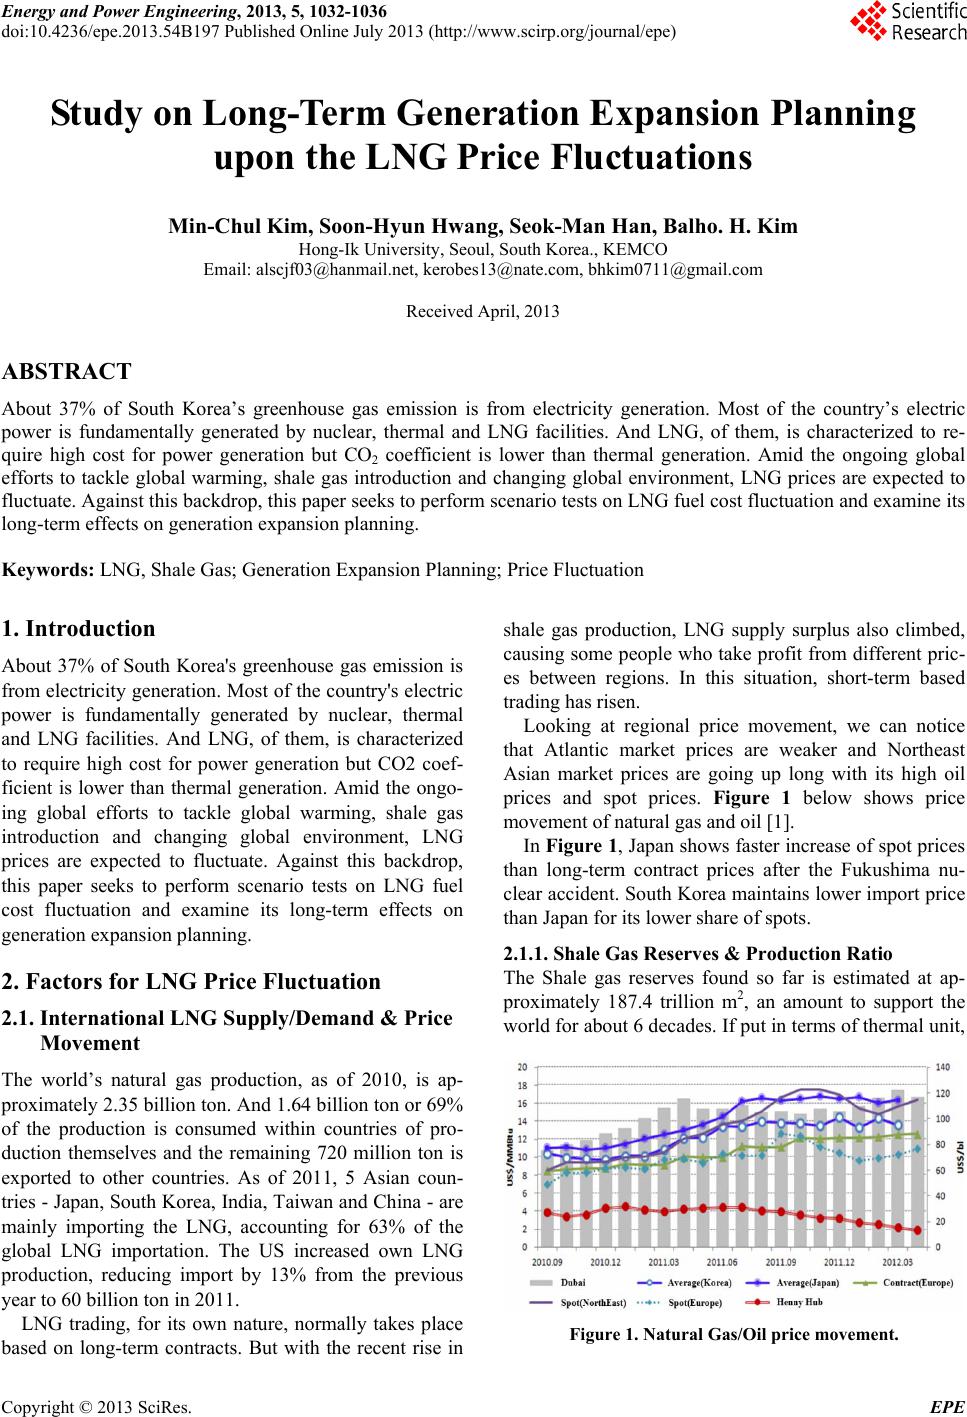
Figure 6. Accumulated Cost Movement of Scenario 3.
able 4. Accumulated cost movement against base scenario. T
Accumulated Against Against base
cost
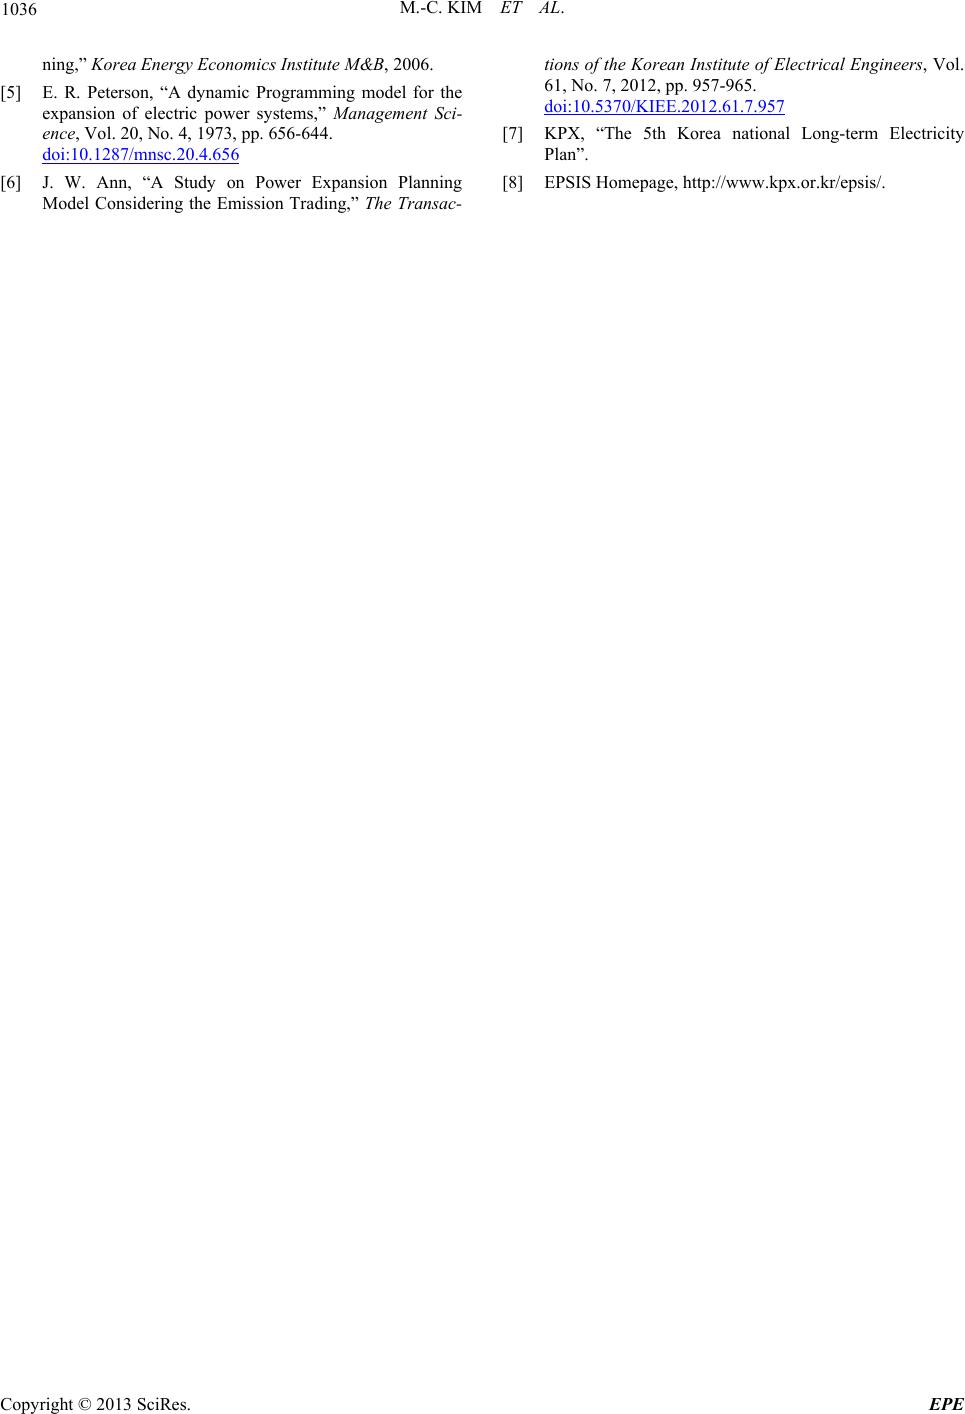
Figure 5. Accumulated Cost Movement of Scenario 2.
(KRW 1000) base scenario scenario (%)
Scenario 1399,100,523,729- -
Scenario 2372,761,470,217-26 ,339,053,512 -6,60 %
Scenario 3338,97 6,995,496- 60,123,528,233 -15.06 %
ith its low greenhouse emission, could become a reli-
isticated out-
co
6. Acknowledgements
rted by Hong-ik University
REFERENCES
[1] Korea EnergyInternational LNG
a Generation Expansion Plan-
Plan-
w
able basis source of generation and contribute to supply-
ing electricity at a lower cost if supported by better tech-
nologies to reduce construction cost.
For future studies, we believe more soph
mes could be obtained if the fuel cost, which was set at
a single amount throughout the whole involved per iod in
this study, is separated for each year. Other environ-
mental policies including ETS (Emission Trading System)
- another plan to reduce greenhouse gas emission - may
also be employed in further studies.
This research has been suppo
Industry-Academia Cooperation Foundation funded by
WP (Korea Westernpower co., Ltd)
Economics Institute, “
price trends and future prospects and implications,” 2012
[2] K. J. Kim, “Shale Gas Developments and ramifications,”
The 29th Energy forum, The National Academy of Engi-
neering of Korea, 2012.
[3] Y. C. Kim, “Multi-Criteri
ning with Global Environmental Considerations,” Korea
advanced institute of science and technology, 1993.
[4] Y. C. Kim, “Principle of the Generation Expansion
Copyright © 2013 SciRes. EPE
M.-C. KIM ET AL.
Copyright © 2013 SciRes. EPE
1036
ning,” Korea Energy Economics Institute M&B, 2006.
[5] E. R. Peterson, “A dynamic Programming model for the
expansion of electric power systems,” Management Sci-
ence, Vol. 20, No. 4, 1973, pp. 656-644.
doi:10.1287/mnsc.20.4.656
[6] J. W. Ann, “A Study on Power Expansion Planning
57
Model Considering the Emission Trading,” The Transac-
tions of the Korean Institute of Electrical Engineers, Vol.
61, No. 7, 2012, pp. 957-965.
doi:10.5370/KIEE.2012.61.7.9
Long-term Electricity
omepage, http://www.kpx.or.kr/epsis/.
[7] KPX, “The 5th Korea national
Plan”.
[8] EPSIS H