Paper Menu >>
Journal Menu >>
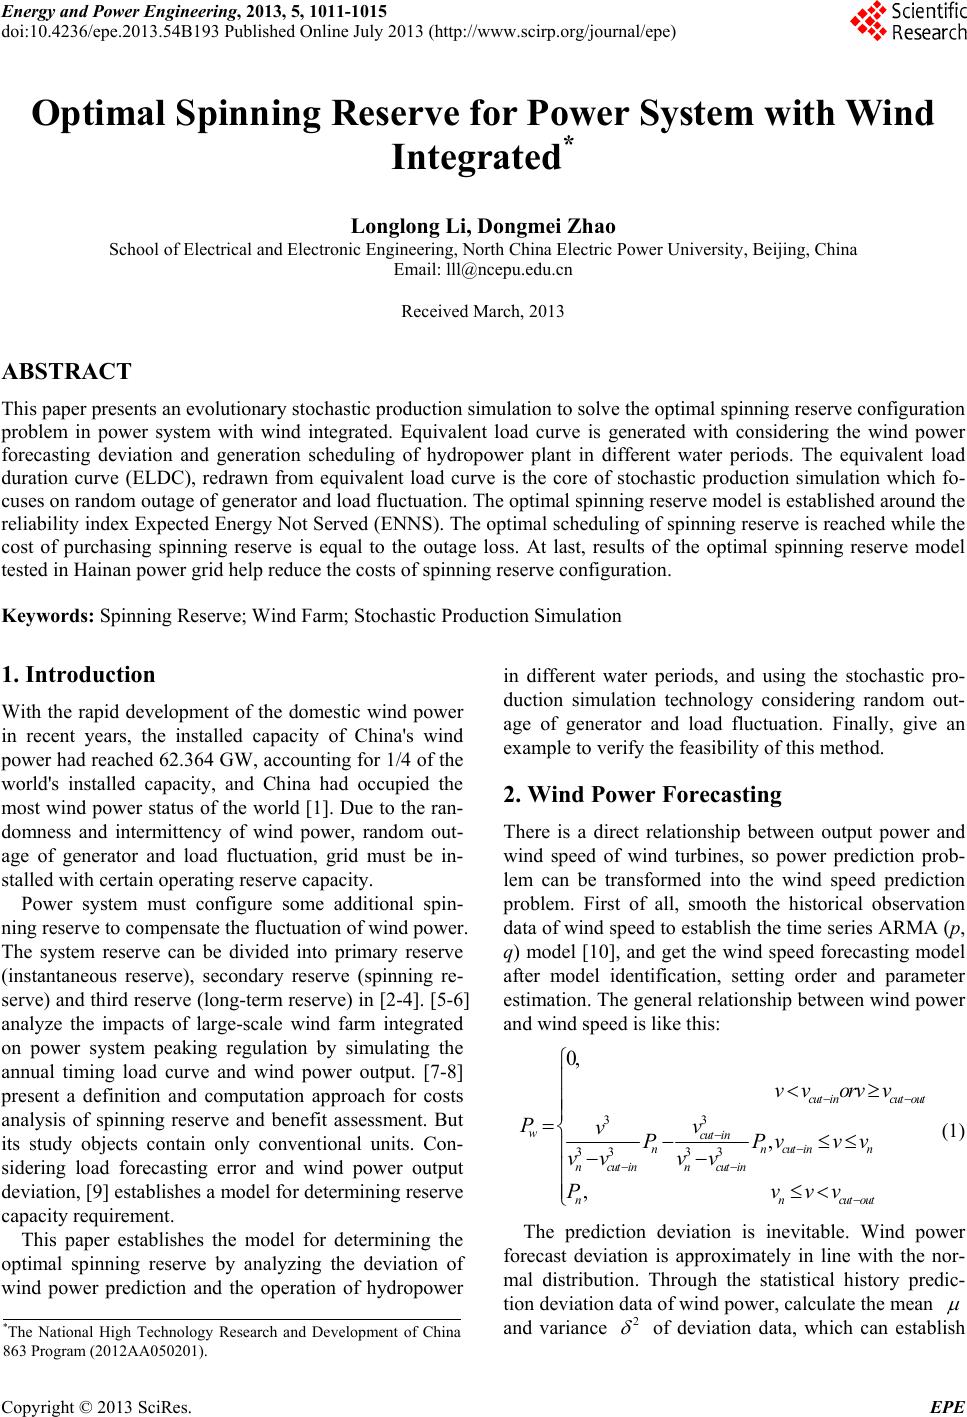 Energy and Power Engineering, 2013, 5, 1011-1015 doi:10.4236/epe.2013.54B193 Published Online July 2013 (http://www.scirp.org/journal/epe) Optimal Spinning Reserve for Power System with Wind Integrated* Longlong Li, Dongmei Zhao School of Electrical and Electronic Engineering, North China Electric Power University, Beijing, China Email: lll@ncepu.edu.cn Received March, 2013 ABSTRACT This paper presents an evolutionary stochastic production simulation to solve the optimal spinning reserve configuration problem in power system with wind integrated. Equivalent load curve is generated with considering the wind power forecasting deviation and generation scheduling of hydropower plant in different water periods. The equivalent load duration curve (ELDC), redrawn from equivalent load curve is the core of stochastic production simulation which fo- cuses on random outage of generator and load fluc tuation. The optimal spin ning reserve model is estab lished ar ound the reliability index Expected Energy Not Served (ENNS). The optimal scheduling of spinning reserve is reached while the cost of purchasing spinning reserve is equal to the outage loss. At last, results of the optimal spinning reserve model tested in Hainan power grid help redu ce the costs of spinning reserve configuration. Keywords: Spinning Reserve; Wind Farm; Stochastic Production Simulation 1. Introduction With the rapid development of the domestic wind power in recent years, the installed capacity of China's wind power had reached 62.364 GW, accounting for 1/4 of the world's installed capacity, and China had occupied the most wind power status of the world [1]. Due to the ran- domness and intermittency of wind power, random out- age of generator and load fluctuation, grid must be in- stalled with certain operating reserve capacity. Power system must configure some additional spin- ning reserve to compensate the fluctuation of w ind pow er. The system reserve can be divided into primary reserve (instantaneous reserve), secondary reserve (spinning re- serve) and third reserve (long-term reserve) in [2-4]. [5-6] analyze the impacts of large-scale wind farm integrated on power system peaking regulation by simulating the annual timing load curve and wind power output. [7-8] present a definition and computation approach for costs analysis of spinning reserve and benefit assessment. But its study objects contain only conventional units. Con- sidering load forecasting error and wind power output deviation, [9] establishes a model for determining reserve capacity requirement. This paper establishes the model for determining the optimal spinning reserve by analyzing the deviation of wind power prediction and the operation of hydropower in different water periods, and using the stochastic pro- duction simulation technology considering random out- age of generator and load fluctuation. Finally, give an example to verify the feasibility of this method. 2. Wind Power Forecasting There is a direct relationship between output power and wind speed of wind turbines, so power prediction prob- lem can be transformed into the wind speed prediction problem. First of all, smooth the historical observation data of wind speed to establish the time series ARMA (p, q) model [10], and get the wind speed forecasting model after model identification, setting order and parameter estimation. The general relationship between wind power and wind speed is like this: 3 3 33 33 0, , , cut incut out wcut in nncutinn ncutin ncutin nn vv orvv Pv vPPvvv vv vv Pvvv cutout (1) The prediction deviation is inevitable. Wind power forecast deviation is approximately in line with the nor- mal distribution. Through the statistical history predic- tion deviation da ta of wind power, calculate the mean and variance 2 of deviation data, which can establish *The National High Technology Research and Development of China 863 Program (2012AA050201). Copyright © 2013 SciRes. EPE 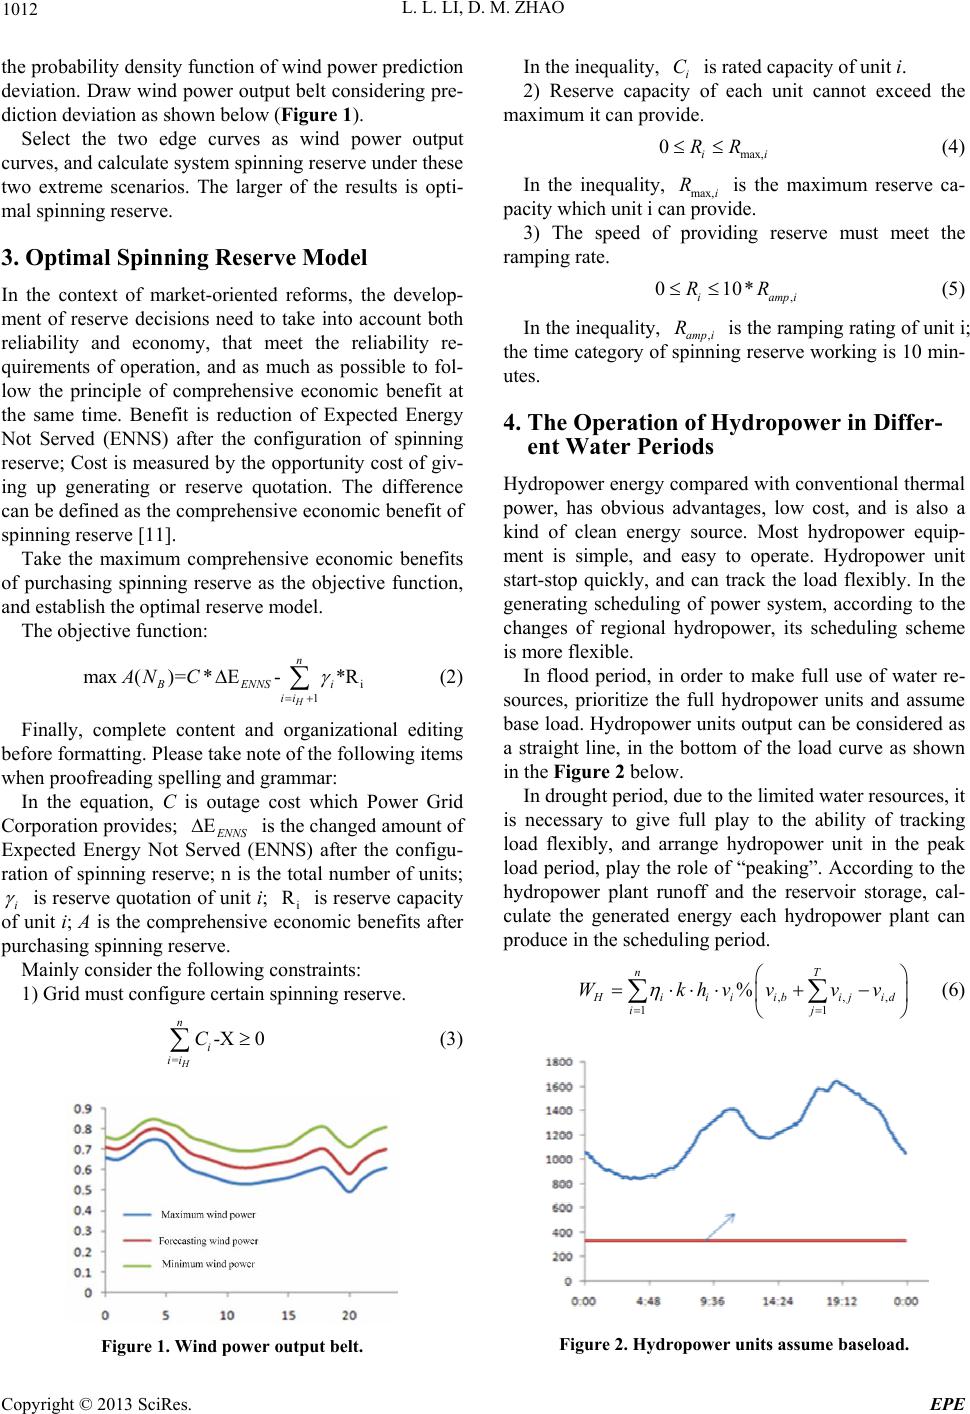 L. L. LI, D. M. ZHAO 1012 the probability dens ity function of wind power prediction deviation. Draw wind power output belt considering pre- diction devi ation as shown be l ow ( Figure 1). Select the two edge curves as wind power output curves, and calculate system spinning reserve under these two extreme scenarios. The larger of the results is opti- mal spinning reserve. 3. Optimal Spinning Reserve Model In the context of market-oriented reforms, the develop- ment of reserve decisions need to take into account both reliability and economy, that meet the reliability re- quirements of operation, and as much as possible to fol- low the principle of comprehensive economic benefit at the same time. Benefit is reduction of Expected Energy Not Served (ENNS) after the configuration of spinning reserve; Cost is measured by the opportunity cost of giv- ing up generating or reserve quotation. The difference can be defined as the comprehensive economic benefit of spinnin g re serve [11]. Take the maximum comprehensive economic benefits of purchasing spinning reserve as the objective function, and establish the optimal reserve model. The objective function: i 1 max()=* E-*R H n BENNSi ii AN C (2) Finally, complete content and organizational editing before formatting. Please take note of the following items when proofreading spelling and grammar: In the equation, C is outage cost which Power Grid Corporation provides; E E NNS is the changed amount of Expected Energy Not Served (ENNS) after the configu- ration of spinning reserve; n is the total number of units; i is reserve quotation of unit i; i is reserve capacity of unit i; A is the comprehensive economic benefits after purchasing spinning reserve. R Mainly consider the following constraints: 1) Grid must configure certain spinn ing reserve. =-X 0 H n i ii C (3) Figure 1. Wind power output belt. In the inequality, is rated capacity of unit i. i 2) Reserve capacity of each unit cannot exceed the maximum it can provide. C max, 0i RRi (4) In the inequality, ma x,i is the maximum reserve ca- pacity which unit i can provide. R 3) The speed of providing reserve must meet the ramping rate. , 010* ia RR mpi (5) In the inequality, ,amp i is the ramping rating of unit i; the time category of spinning reserve working is 10 min- utes. R 4. The Operation of Hydropower in Differ- ent Water Periods Hydropower energy compared with conventional thermal power, has obvious advantages, low cost, and is also a kind of clean energy source. Most hydropower equip- ment is simple, and easy to operate. Hydropower unit start-stop quickly, and can track the load flexibly. In the generating scheduling of power system, according to the changes of regional hydropower, its scheduling scheme is more flexible. In flood period, in order to make full use of water re- sources, prioritize the full hydropower units and assume base load. Hydropower units output can be considered as a straight line, in the bottom of the load curve as shown in the Figure 2 below. In drought period, due to the limited water resources, it is necessary to give full play to the ability of tracking load flexibly, and arrange hydropower unit in the peak load period, play the role of “peaking”. According to the hydropower plant runoff and the reservoir storage, cal- culate the generated energy each hydropower plant can produce in the scheduling period. ,,, 11 % nT H iiiib ijid ij Wkhvvv v (6) Figure 2. Hydropower units assume baseload. Copyright © 2013 SciRes. EPE 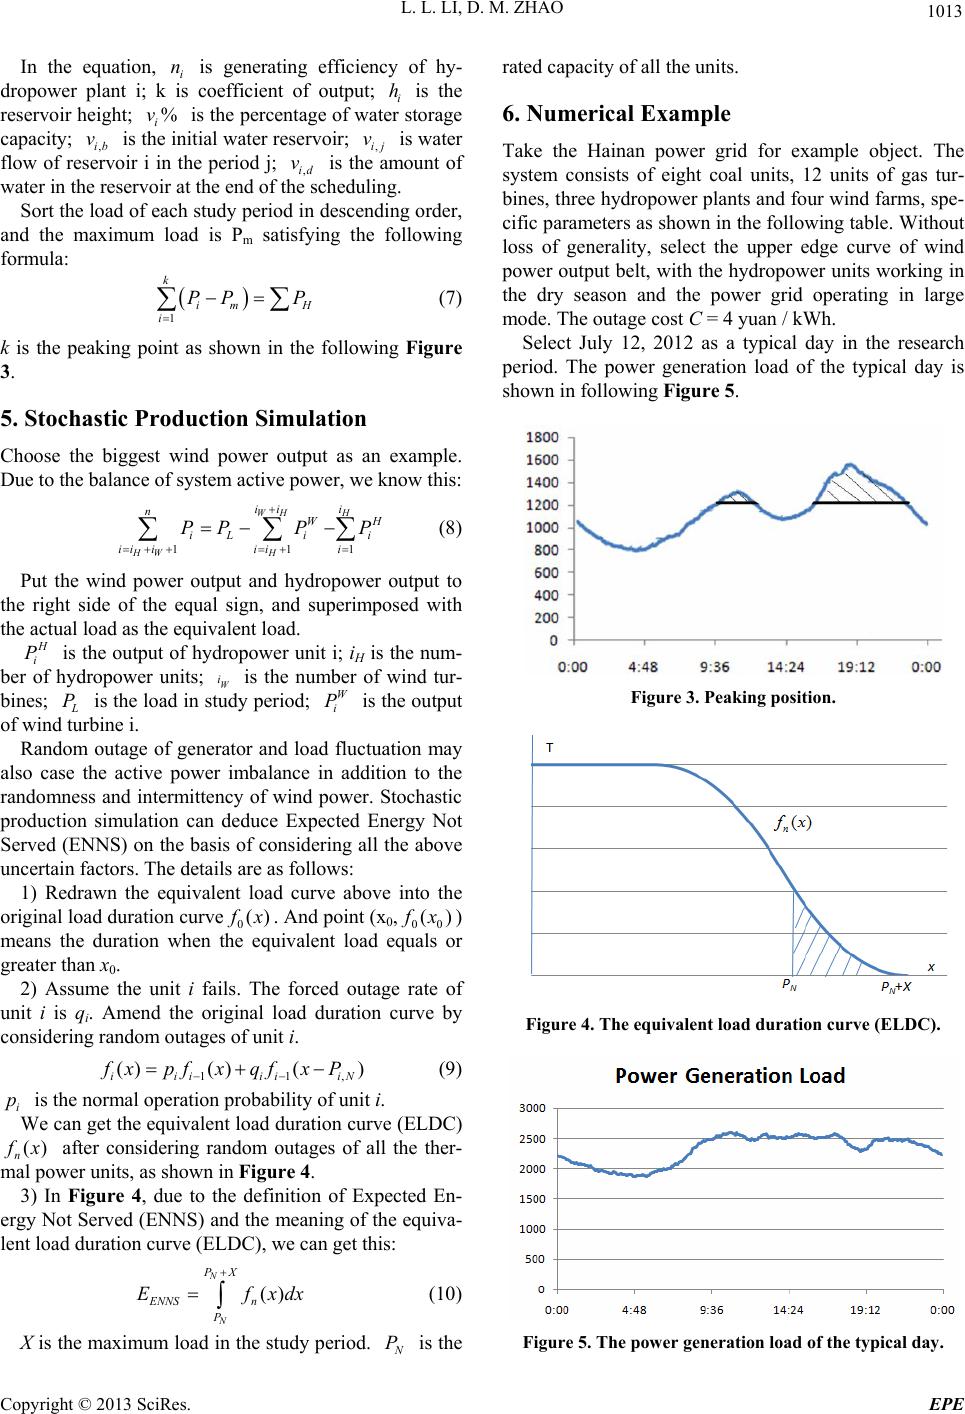 L. L. LI, D. M. ZHAO 1013 In the equation, i n is generating efficiency of hy- dropower plant i; k is coefficient of output; i is the reservoir height; i is the percentage of water storage capacity; ,ib is the initial water reservoir; ,ij is water flow of reservoir i in the period j; ,id is the amount of water in the reservoir at the end of the scheduling. h %v v v v Sort the load of each study period in descending order, and the maximum load is Pm satisfying the following formula: 1 k im H i PP P 1 H (7) k is the peaking point as shown in the following Figure 3. 5. Stochastic Production Simulation Choose the biggest wind power output as an example. Due to the balance of system active power, we know this: 11 WH H HW H ii i nW iLi i ii iiii PPPP (8) Put the wind power output and hydropower output to the right side of the equal sign, and superimposed with the actual load as the equivalent load. H i P is the output of hydropower unit i; iH is the num- ber of hydropower units; W is the number of wind tur- bines; i L P is the load in study period; is the output of wind turbine i. W i P Random outage of generator and load fluctuation may also case the active power imbalance in addition to the randomness and intermittency of wind power. Stochastic production simulation can deduce Expected Energy Not Served (ENNS) on the basis of considering all the above uncertain factors. The details are as follows: 1) Redrawn the equivalent load curve above into the original load duration curve0() f x. And point (x0,00 () f x) means the duration when the equivalent load equals or greater than x0. 2) Assume the unit i fails. The forced outage rate of unit i is qi. Amend the original load duration curve by considering random outages of unit i. 11 ()()( ) iiiiii fxpf xqf xP ,N (9) i p is the normal operation probability of unit i. We can get the equivalent load duration curve (ELDC) () n f x after considering random outages of all the ther- mal power units, as shown in Figure 4. 3) In Figure 4, due to the definition of Expected En- ergy Not Served (ENNS) and the meaning of the equiva- lent load duration curve (ELDC), we can get this: () N N PX ENNS n P Ef xdx (10) X is the maximum load in the study period. N P is the rated capacity of all the units. 6. Numerical Example Take the Hainan power grid for example object. The system consists of eight coal units, 12 units of gas tur- bines, three hydropower plants and four wind farms, spe- cific parameters as shown in the following table. Without loss of generality, select the upper edge curve of wind power output belt, with the hydropower units working in the dry season and the power grid operating in large mode. The outage cost C = 4 yuan / kWh. Select July 12, 2012 as a typical day in the research period. The power generation load of the typical day is shown in following Figu r e 5. Figure 3. Peaking position. Figure 4. The equivalent load duration curve (ELDC). Figure 5. The power generation load of the typical day. Copyright © 2013 SciRes. EPE  L. L. LI, D. M. ZHAO 1014 By calculation, the generated energy of three hydro- power plants in the research period is shown in the fol- lowing Table 1. Hydropower units in the dry season are mainly re- sponsible for peaking. Peaking position is shown below (Figure 6). The maximum load after peaking is 2394MW. Redrawn the equivalent load curve peaked above into the equivalent load duration curve (ELDC) () n f x as shown in the following Figure 7. We can get the results shown in the following Figure 8 by solving the optimal spinning reserve model. In the figure, abscissa is spinning reserve capacity, and ordinate is the comprehensive economic benefits. With the increase in spinning reserve capacity, the comprehen- sive economic benefits are also increasing. When spin- ning reserve capacity increases to a certain value, the comprehensive economic benefits to maximize reach the maximum. Now the cost of purchasing spinning reserve is equal to the outage loss. The optimal spinning reserve capacity is 373MW. However, the spinning reserve ca- pacity of Hainan power gr id in July 12 , 2012 is 457 MW. This model reduces the cost of power grid in spinning reserve configuration under the premise of meeting the operational reliability. 7. Conclusions This paper shows how stochastic production simulation can be applied to solve the optimal spinning reserve problem which determines the spinning reserve require- ments in power system with wind integrated. This model helps a power system overcome the randomness and in- termittency of wind power, random outage of generator Table 1. The generated energy of three hydropower plants. hydropower rated capacity total power 1 4*60 840.6 2 2*40 393.3 3 4*20 176.1 Figure 6. Peaking position of the typical day. Figure 7. The equivalent load duration curve (ELDC) of the typical day. Figure 8. The relationship between comprehensive eco- nomic benefits and spinning reserve capaci ty. and load fluctuation. Results tested in Hainan power grid reduce the cost of spinning reserve configuration without affecting operational reliability. The main contributions of this paper include 1) intro- ducing a efficient method to forecast wind power output, 2) developing a model on the optimal spinning reserve, 3) propose a convenient approach to solve the operation problem of hydropower in different water period, 4) formulating the stochastic production simulation. The mat lab program developed in this paper has been able to solve the optimal spinning reserve model. Expect to apply software copyright and supply service to power companies in the future. REFERENCES [1] J. F. Li, “China Wind Power Outlook 2012,” China En- vironmental Science Press, Beijing, 2012. [2] T. Ackermann, J. R. Abbad and I. M. Dudurych “Euro- pean Balancing Act,” IEEE Power and Energy Magazine, Vol. 5, No. 6, 2007, pp. 90-103. [3] T. Ackermann “Wind Power in Power System,” John Wiley & Sons LTD, New York , USA, 2005. [4] J. F. Restrepo and F. D. Galiana “Secondary Reserve Dispatch Accounting for Wind Power Randomness and Spillage,” Proceedings of IEEE Power Engineering Soci- Copyright © 2013 SciRes. EPE  L. L. LI, D. M. ZHAO Copyright © 2013 SciRes. EPE 1015 ety General Meeting, June 24-28, 2007, Tampa, FL, USA, pp. 1-3. [5] N. Zhang, T. R. Zhou and C. G. Duan, “Impact of Large-Scale Wind Farm Connecting with Power Grid on Peak Load Regulation Demand,” Power System Technol- ogy, Vol. 34, No. 1, 2010, pp. 152-157. [6] L. Sun, “Research on Improving the Capacity of Peak Regulation of Power System with Large-scale Wind Power Penetration,” Thesis, Dalian University of Tech- nology, Dalian, 2010. [7] G. Q. Zhang, X. L. Wang and X. F. Wang, “Study on Benefits and Costs of Spinning Reserve Capacity in Power Market,” Automation of Electric Power Systems, Electricity Market Column, 2000, pp. 14-18. [8] X. F. Wang and X. L. Wang, “Probabilistic Production Simulation Method and Its Application,” Automation of Electric Power Systems, Vol. 27, No. 8, 2003, pp. 10-15. [9] J. Ge, F. Wang and L. Z. Zhang, “Spinning Reserve Model in the Wind Power Integrated Power System,” Automation of Electric Power Systems, Vol. 34, No. 6, 2010, pp. 32-36. [10] J. C. Wang, “Study on Forecasting the Wind Speed and Wind Power Based on the Measured Data of a Wind Farm,” Thesis, Northeast Dianli University, 2010. [11] X. F. Wang, X. L. Wang and H. Y. Chen, “The Basis of Power Market,” Xi'an Jiao Tong University Press, Xi'an, 2003. |