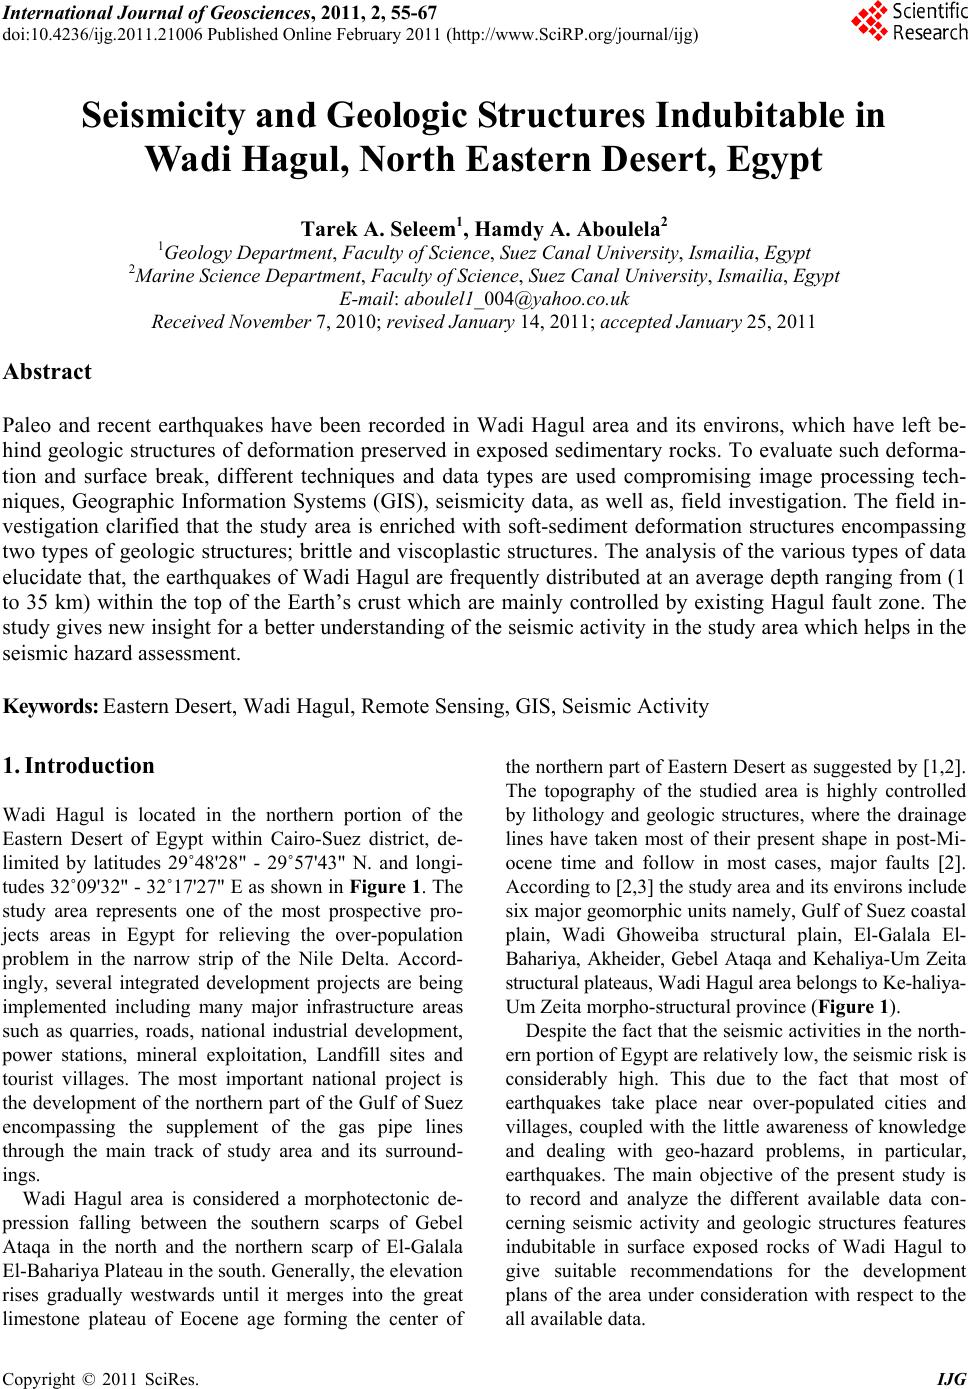
 International Journal of Geosciences, 2011, 2, 55-67 doi:10.4236/ijg.2011.21006 Published Online February 2011 (http://www.SciRP.org/journal/ijg) Copyright © 2011 SciRes. IJG Seismicity and Geologic Structures Indubitable in Wadi Hagul, North Eastern Desert, Egypt Tarek A. Seleem1, Hamdy A. Aboulela2 1Geology Department, Faculty of Science, Suez Canal University, Ismailia, Egypt 2Marine Science Department, Faculty of Science, Suez Canal University, Ismailia, Egypt E-mail: aboulel1_004@yahoo.co.uk Received November 7, 2010; revised January 14, 2011; accepted Janu ary 25, 2011 Abstract Paleo and recent earthquakes have been recorded in Wadi Hagul area and its environs, which have left be- hind geologic structures of deformation preserved in exposed sedimentary rocks. To evaluate such deforma- tion and surface break, different techniques and data types are used compromising image processing tech- niques, Geographic Information Systems (GIS), seismicity data, as well as, field investigation. The field in- vestigation clarified that the study area is enriched with soft-sediment deformation structures encompassing two types of geologic structures; brittle and viscoplastic structures. The analysis of the various types of data elucidate that, the earthquakes of Wadi Hagul are frequently distributed at an average depth ranging from (1 to 35 km) within the top of the Earth’s crust which are mainly controlled by existing Hagul fault zone. The study gives new insight for a better understanding of the seismic activity in the study area which helps in the seismic hazard assessment. Keywords: Eastern Desert, Wadi Hagul, Remote Sensing, GIS, Seismic Activity 1. Introduction Wadi Hagul is located in the northern portion of the Eastern Desert of Egypt within Cairo-Suez district, de- limited by latitudes 29˚48'28" - 29˚57'43" N. and longi- tudes 32˚09'32" - 32˚17'27" E as shown in Figure 1. The study area represents one of the most prospective pro- jects areas in Egypt for relieving the over-population problem in the narrow strip of the Nile Delta. Accord- ingly, several integrated development projects are being implemented including many major infrastructure areas such as quarries, roads, national industrial development, power stations, mineral exploitation, Landfill sites and tourist villages. The most important national project is the development of the northern part of the Gulf of Suez encompassing the supplement of the gas pipe lines through the main track of study area and its surround- ings. Wadi Hagul area is considered a morphotectonic de- pression falling between the southern scarps of Gebel Ataqa in the north and the northern scarp of El-Galala El-Bahariya Plateau in the south. Generally, the elevation rises gradually westwards until it merges into the great limestone plateau of Eocene age forming the center of the northern part of Eastern Desert as suggested by 1,2. The topography of the studied area is highly controlled by lithology and geologic structures, where the drainage lines have taken most of their present shape in post-Mi- ocene time and follow in most cases, major faults 2. According to 2,3 the study area and its environs include six major geomorphic units namely, Gulf of Suez coastal plain, Wadi Ghoweiba structural plain, El-Galala El- Bahariya, Akheider, Gebel Ataqa and Kehaliya-Um Zeita structural plateaus, Wadi Hagul area belongs to Ke-haliya- Um Zeita morpho-structural province (Figure 1). Despite the fact that the seismic activities in the north- ern portion of Egypt are relatively low, the seismic risk is considerably high. This due to the fact that most of earthquakes take place near over-populated cities and villages, coupled with the little awareness of knowledge and dealing with geo-hazard problems, in particular, earthquakes. The main objective of the present study is to record and analyze the different available data con- cerning seismic activity and geologic structures features indubitable in surface exposed rocks of Wadi Hagul to give suitable recommendations for the development plans of the area under consideration with respect to the all available data. 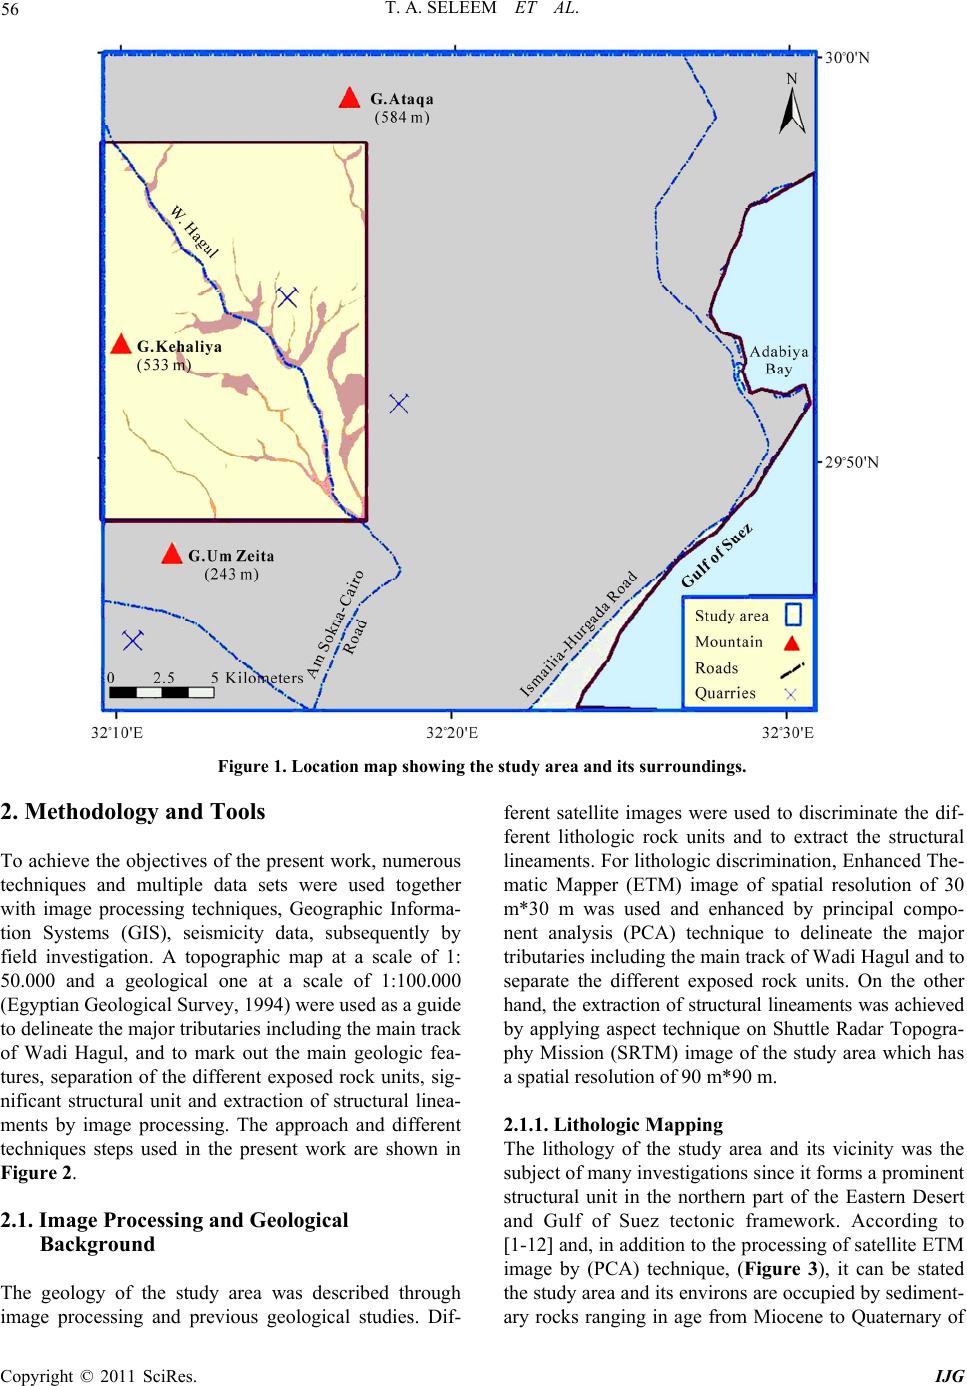 T. A. SELEEM ET AL. Copyright © 2011 SciRes. IJG 56 Figure 1. Location map showing the study area and its surroundings. 2. Methodology and Tools To achieve the objectives of the present work, numerous techniques and multiple data sets were used together with image processing techniques, Geographic Informa- tion Systems (GIS), seismicity data, subsequently by field investigation. A topographic map at a scale of 1: 50.000 and a geological one at a scale of 1:100.000 (Egyptian Geological Survey, 1994) were used as a guide to delineate the major tributaries including the main track of Wadi Hagul, and to mark out the main geologic fea- tures, separation of the different exposed rock units, sig- nificant structural unit and extraction of structural linea- ments by image processing. The approach and different techniques steps used in the present work are shown in Figure 2. 2.1. Image Processing and Geological Background The geology of the study area was described through image processing and previous geological studies. Dif- ferent satellite images were used to discriminate the dif- ferent lithologic rock units and to extract the structural lineaments. For lithologic discrimination, Enhanced The- matic Mapper (ETM) image of spatial resolution of 30 m*30 m was used and enhanced by principal compo- nent analysis (PCA) technique to delineate the major tributaries including the main track of Wadi Hagul and to separate the different exposed rock units. On the other hand, the extraction of structural lineaments was achieved by applying aspect technique on Shuttle Radar Topogra- phy Mission (SRTM) image of the study area which has a spatial resolution of 90 m*90 m. 2.1.1. Lithologic Mapping The lithology of the study area and its vicinity was the subject of many investigations since it forms a prominent structural unit in the northern part of the Eastern Desert and Gulf of Suez tectonic framework. According to 1-12 and, in addition to the processing of satellite ETM image by (PCA) technique, (Figure 3), it can be stated the study area and its environs are occupied by sediment- ary rocks ranging in age from Miocene to Quaternary of 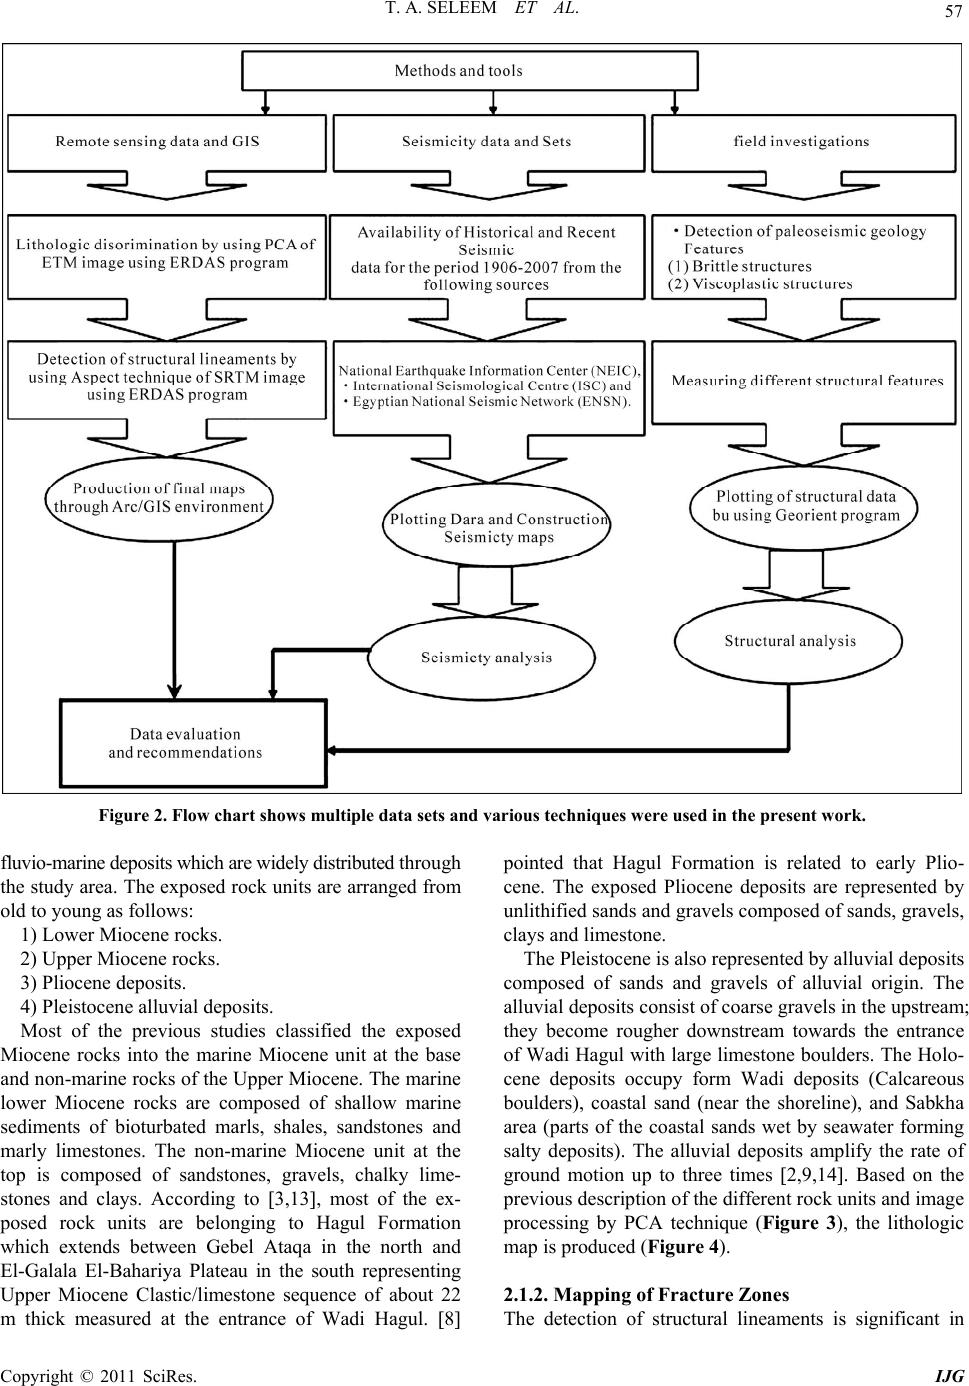 T. A. SELEEM ET AL. Copyright © 2011 SciRes. IJG 57 Figure 2. Flow chart shows multiple data sets and various techniques were used in the present work. fluvio-marine deposits which are widely distributed through the study area. The exposed rock units are arranged from old to young as follows: 1) Lower Miocene rocks. 2) Upper Miocene rocks. 3) Pliocene deposits. 4) Pleistocene alluvial deposits. Most of the previous studies classified the exposed Miocene rocks into the marine Miocene unit at the base and non-marine rocks of the Upper Miocene. The marine lower Miocene rocks are composed of shallow marine sediments of bioturbated marls, shales, sandstones and marly limestones. The non-marine Miocene unit at the top is composed of sandstones, gravels, chalky lime- stones and clays. According to 3,13, most of the ex- posed rock units are belonging to Hagul Formation which extends between Gebel Ataqa in the north and El-Galala El-Bahariya Plateau in the south representing Upper Miocene Clastic/limestone sequence of about 22 m thick measured at the entrance of Wadi Hagul. 8 pointed that Hagul Formation is related to early Plio- cene. The exposed Pliocene deposits are represented by unlithified sands and gravels composed of sands, gravels, clays and limestone. The Pleistocene is also represented by alluvial deposits composed of sands and gravels of alluvial origin. The alluvial deposits consist of coarse gravels in the upstream; they become rougher downstream towards the entrance of Wadi Hagul with large limestone boulders. The Holo- cene deposits occupy form Wadi deposits (Calcareous boulders), coastal sand (near the shoreline), and Sabkha area (parts of the coastal sands wet by seawater forming salty deposits). The alluvial deposits amplify the rate of ground motion up to three times 2,9,14. Based on the previous description of the different rock units and image processing by PCA technique (Figure 3), the lithologic map is produced (Figure 4). 2.1.2. Mapping of Fracture Zones The detection of structural lineaments is significant in  T. A. SELEEM ET AL. Copyright © 2011 SciRes. IJG 58 Figure 3. ETM image of Wadi Hagul and its environs En- hanced by PCA technique. studying geo-hazards where they represent weakness planes in the earth’s crust that cause and facilitate ground deformation including seismic activity of earthquakes. By using the aspect technique of image processing which was applied on SRTM image (Figure 5), the extraction of fracture zones represented by structural lineaments and plotting of rose diagram are achieved, Figures 6(a,b). Depending on Figures 6(a,b), the major part of the structural lineaments lies in the northwest direction with maximum peak of N30˚-60˚W, with subordinate direc- tion of NNE-SSW and E-W to ENE-WSW whereas WNW-ESE direction is considered to be minor. The pre- vious tectonic studies revealed the tectonic implications of such structural lineaments elucidating that the Mio- cene and post-Miocene extension in the northern part of Egypt is due to the rift of Arabia away from Africa formed a large number of NW-SE oriented normal faults and rejuvenated the E-ENE oriented faults in the Cairo- Suez district by dextral transtension 15. This throw was transferred through the deep-seated EW oriented faults and led to their rejuvenation by dextral transtension that formed EW elongated belts of left-stepped en echelon Figure 4. Lithologic map of Wadi Hagul and its environs extracted from enhanced ETM image. normal faults in addition to NW-SE oriented normal faults as the Suez rift was unable to extend north of Suez City. The throw of the faults in the northern part of this Miocene rift was transferred into the Cairo-Suez district 16. The EW faults of oblique-slip movement with a subordinate right-lateral strike-slip component are gener- ally linked at depth the NW-SE faults of pure dipslip sense of movement. 2.2. Seismicity Data Sets In order to evaluate the seismic activity in study area and its surroundings, it was necessary to extend knowledge of earthquakes and time of their occurrence. It is well known that the northern section of Egypt and study area has experienced numerous moderate earthquakes with associated aftershock sequences, and some significant earthquakes swarm for a period of more than 2000 years. In the present study, a great effort was made to obtain detailed information about a complete, homogenous ca- talogue for the recent seismic activity for the period from 1904-2007. A catalogue of micro to moderate earth- quakes has been compiled for the mentioned period as 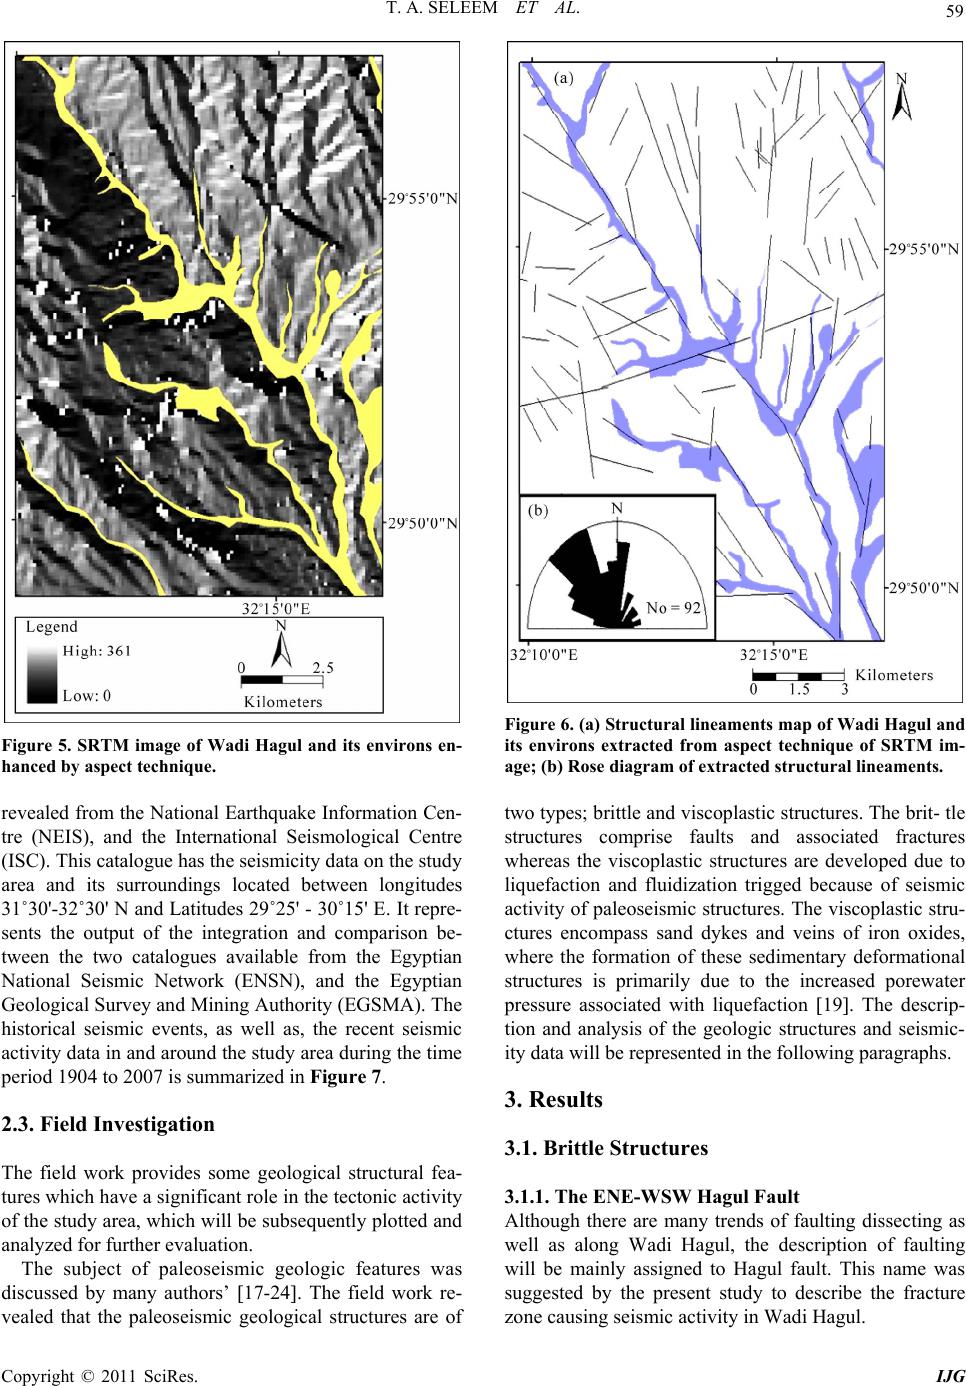 T. A. SELEEM ET AL. Copyright © 2011 SciRes. IJG 59 Figure 5. SRTM image of Wadi Hagul and its environs en- hanced by aspect technique. revealed from the National Earthquake Information Cen- tre (NEIS), and the International Seismological Centre (ISC). This catalogue has the seismicity data on the study area and its surroundings located between longitudes 31˚30'-32˚30' N and Latitudes 29˚25' - 30˚15' E. It repre- sents the output of the integration and comparison be- tween the two catalogues available from the Egyptian National Seismic Network (ENSN), and the Egyptian Geological Survey and Mining Authority (EGSMA). The historical seismic events, as well as, the recent seismic activity data in and around the study area during the time period 1904 to 2007 is summarized in Figure 7. 2.3. Field Investigation The field work provides some geological structural fea- tures which have a significant role in the tectonic activity of the study area, which will be subsequently plotted and analyzed for further evaluation. The subject of paleoseismic geologic features was discussed by many authors’ 17-24. The field work re- vealed that the paleoseismic geological structures are of Figure 6. (a) Structural lineaments map of Wadi Hagul and its environs extracted from aspect technique of SRTM im- age; (b) Rose diagram of extracted structural lineaments. two types; brittle and viscoplastic structures. The brit- tle structures comprise faults and associated fractures whereas the viscoplastic structures are developed due to liquefaction and fluidization trigged because of seismic activity of paleoseismic structures. The viscoplastic stru- ctures encompass sand dykes and veins of iron oxides, where the formation of these sedimentary deformational structures is primarily due to the increased porewater pressure associated with liquefaction 19. The descrip- tion and analysis of the geologic structures and seismic- ity data will be represented in the following paragraphs. 3. Results 3.1. Brittle Structures 3.1.1. The ENE-WSW Hagul Fault Although there are many trends of faulting dissecting as well as along Wadi Hagul, the description of faulting will be mainly assigned to Hagul fault. This name was suggested by the present study to describe the fracture zone causing seismic activity in Wadi Hagul. 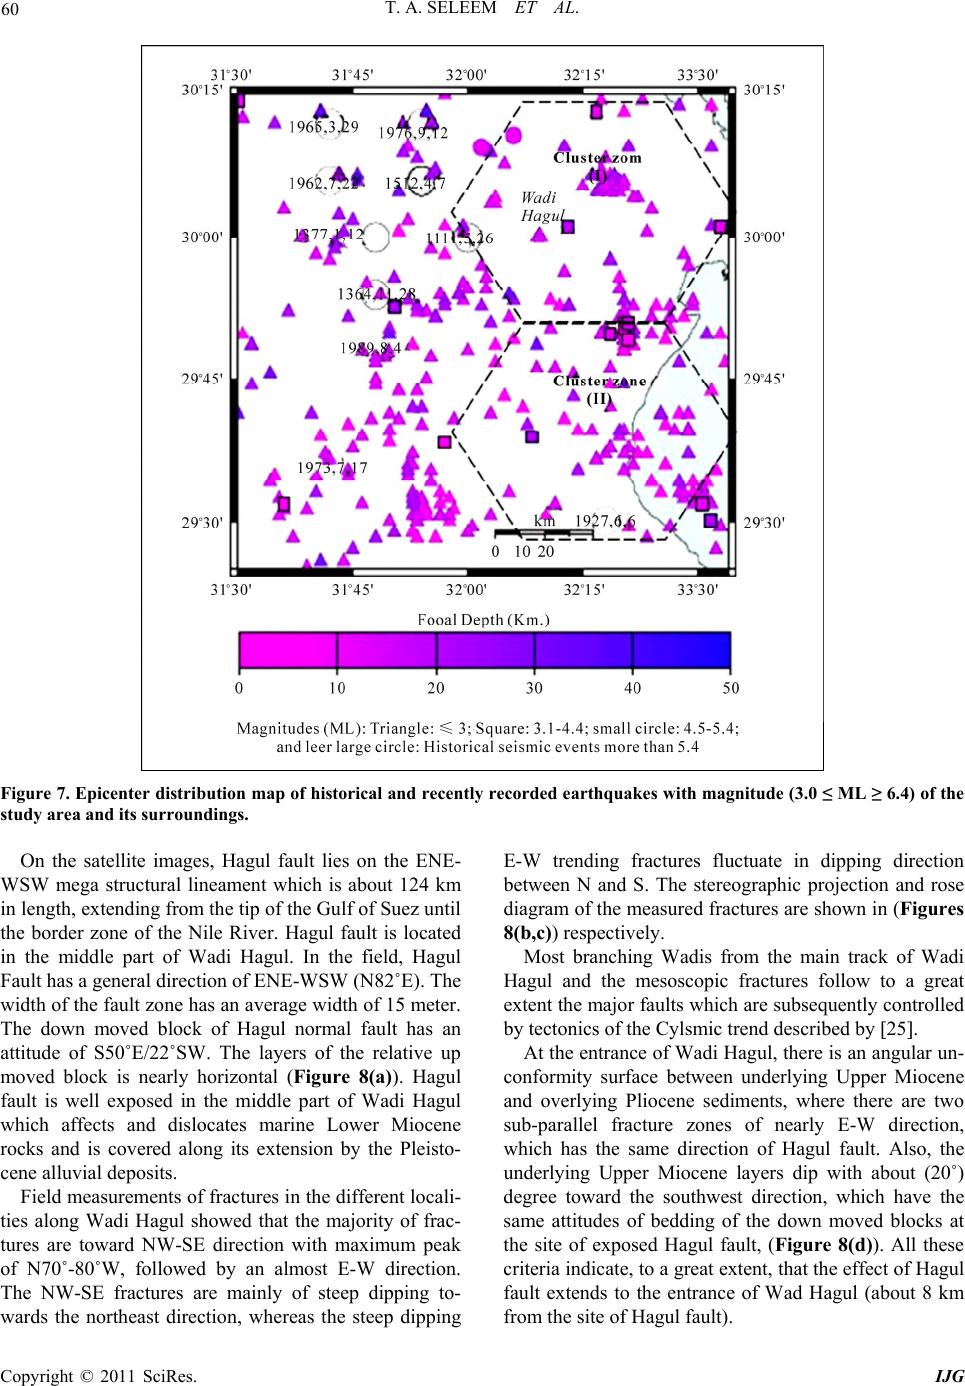 T. A. SELEEM ET AL. Copyright © 2011 SciRes. IJG 60 Figure 7. Epicenter distribution map of historical and recently recorded earthquakes with magnitude (3.0 ≤ ML ≥ 6.4) of the study area and its surroundings. On the satellite images, Hagul fault lies on the ENE- WSW mega structural lineament which is about 124 km in length, extending from the tip of the Gulf of Suez until the border zone of the Nile River. Hagul fault is located in the middle part of Wadi Hagul. In the field, Hagul Fault has a general direction of ENE-WSW (N82˚E). The width of the fault zone has an average width of 15 meter. The down moved block of Hagul normal fault has an attitude of S50˚E/22˚SW. The layers of the relative up moved block is nearly horizontal (Figure 8(a)). Hagul fault is well exposed in the middle part of Wadi Hagul which affects and dislocates marine Lower Miocene rocks and is covered along its extension by the Pleisto- cene alluvial deposits. Field measurements of fractures in the different locali- ties along Wadi Hagul showed that the majority of frac- tures are toward NW-SE direction with maximum peak of N70˚-80˚W, followed by an almost E-W direction. The NW-SE fractures are mainly of steep dipping to- wards the northeast direction, whereas the steep dipping E-W trending fractures fluctuate in dipping direction between N and S. The stereographic projection and rose diagram of the measured fractures are shown in (Figures 8(b,c)) respectively. Most branching Wadis from the main track of Wadi Hagul and the mesoscopic fractures follow to a great extent the major faults which are subsequently controlled by tectonics of the Cylsmic trend described by 25. At the entrance of Wadi Hagul, there is an angular un- conformity surface between underlying Upper Miocene and overlying Pliocene sediments, where there are two sub-parallel fracture zones of nearly E-W direction, which has the same direction of Hagul fault. Also, the underlying Upper Miocene layers dip with about (20˚) degree toward the southwest direction, which have the same attitudes of bedding of the down moved blocks at the site of exposed Hagul fault, (Figure 8(d)). All these criteria indicate, to a great extent, that the effect of Hagul fault extends to the entrance of Wad Hagul (about 8 km from the site of Hagul fault). 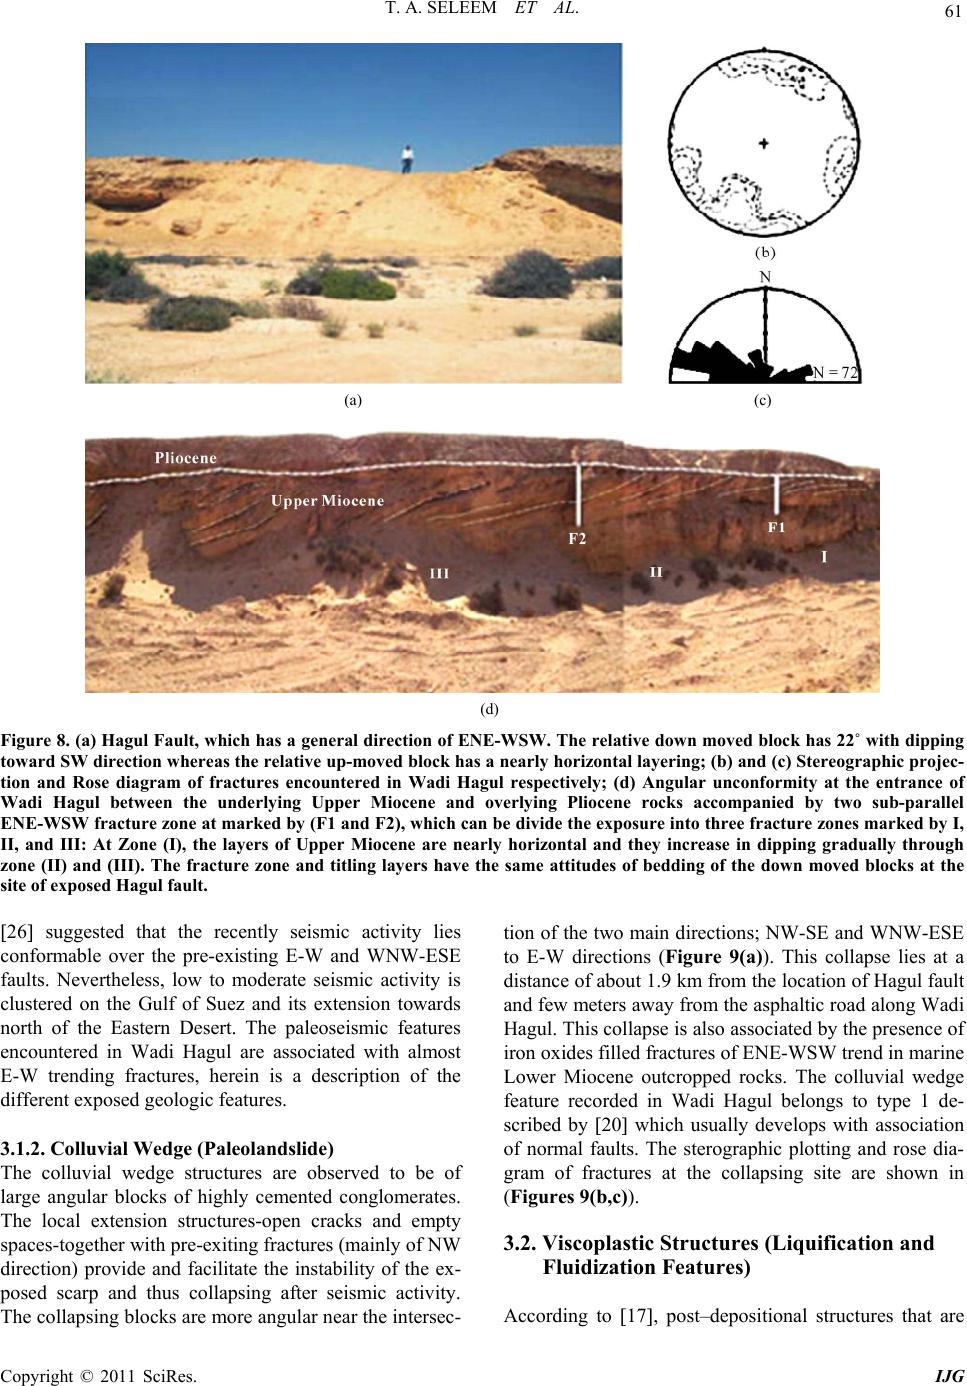 T. A. SELEEM ET AL. Copyright © 2011 SciRes. IJG 61 (a) (c) (d) Figure 8. (a) Hagul Fault, which has a general direction of ENE-WSW. The relative down moved block has 22˚ with dipping toward SW direction whereas the relative up-moved block has a nearly horizontal layering; (b) and (c) Stereographic projec- tion and Rose diagram of fractures encountered in Wadi Hagul respectively; (d) Angular unconformity at the entrance of Wadi Hagul between the underlying Upper Miocene and overlying Pliocene rocks accompanied by two sub-parallel ENE-WSW fracture zone at marked by (F1 and F2), which can be divide the exposure into three fracture zones marked by I, II, and III: At Zone (I), the layers of Upper Miocene are nearly horizontal and they increase in dipping gradually through zone (II) and (III). The fracture zone and titling layers have the same attitudes of bedding of the down moved blocks at the site of exposed Hagul fault. 26 suggested that the recently seismic activity lies conformable over the pre-existing E-W and WNW-ESE faults. Nevertheless, low to moderate seismic activity is clustered on the Gulf of Suez and its extension towards north of the Eastern Desert. The paleoseismic features encountered in Wadi Hagul are associated with almost E-W trending fractures, herein is a description of the different exposed geologic features. 3.1.2. Colluvial Wedge (Paleolandslide) The colluvial wedge structures are observed to be of large angular blocks of highly cemented conglomerates. The local extension structures-open cracks and empty spaces-together with pre-exiting fractures (mainly of NW direction) provide and facilitate the instability of the ex- posed scarp and thus collapsing after seismic activity. The collapsing blocks are more angular near the intersec- tion of the two main directions; NW-SE and WNW-ESE to E-W directions (Figure 9(a)). This collapse lies at a distance of about 1.9 km from the location of Hagul fault and few meters away from the asphaltic road along Wadi Hagul. This collapse is also associated by the presence of iron oxides filled fractures of ENE-WSW trend in marine Lower Miocene outcropped rocks. The colluvial wedge feature recorded in Wadi Hagul belongs to type 1 de- scribed by 20 which usually develops with association of normal faults. The sterographic plotting and rose dia- gram of fractures at the collapsing site are shown in (Figures 9(b,c)). 3.2. Viscoplastic Structures (Liquification and Fluidization Features) According to 17, post–depositional structures that are  T. A. SELEEM ET AL. Copyright © 2011 SciRes. IJG 62 (a) (b) (c) Figure 9. (a) Paleo-landslides of Upper Miocene rocks encountered in Wadi Hagul; (b) and (c) Stereographic plotting and Rose diagram of paleo-landslide fractures, respectively. formed as a result of the escape of pore fluids, usually water, occur commonly in fine-to medium-grained sand. These structures are considered to be a direct response to fluid escape during liquefaction and fluidization. The soft-sediment deformation structures play an important role in identifying the distribution and intensity of an- cient seismic activity. Seismically induced liquefaction features such as sand dikes typically involve highly elevated pore water pres- sure since their formation requires strong shaking. The minimum earthquake magnitude to form liquefaction fea- tures in most field settings is about magnitude of Mm = 5.5 18. The most significant features of liquefaction and fluidization are represented by sand dikes and iron ox- ides filled fractures. 3.2.1. Sand Dikes Liquefaction process is indicated by the presence of out-of-place cohesion less sediments which have flowed and formed clastic dikes. “Note that such dikes have been found 27, to provide sensitive locations for the detection of Seismic Electric Signals, SES, that are low frequency (≤ 1Hz) signals that precede earthquakes 28. This is important since recent studies e.g. 29 have shown that the SES detection can lead to the determina- tion of the occurrence time of an impending strong earthquake upon employing the natural time analysis 30, 31 of the ongoing seismicity after the detection of an SES activity” Sand dikes encountered along Wadi Hagul are crop- ping out through non-marine Upper Miocene rocks and are sealed by the overlying Pliocene gravels (Figures 10 (a,b)). The sand dikes lie within few hundreds meters from the paleo-landslide exposure. The sand dikes are nearly vertical and are controlled by the preexisting joints corresponding to Hagul fault activity. The strike of dikes is more or less concordant with the general strike of the WNW-ESE trending fault (Hagul Fault), where dike widths range from 15 to 23 cm. The excavation process for pipe lines along Wadi Hagul revealed the presence of shallow sand dikes (Figure 10(c)). The stere- ographic projection of the poles of sand dikes is repre- sented in Figure 10(d). 3.2.2. Veins of Iron Oxides At many places close to the miesoseismal zone, silty and ferruginous sandstones are hydroplastically injected through the surrounding rocks in the form of veins due to the effect of fluidization. This can be clearly observed in the middle part of the study area, where sand, in the form of liquefied sand with hydrothermal solutions of iron oxides as veins, is observed to cut through the exposed Miocene rocks in the form of sub-vertical planes of open cracks. The trend of both sand veins is more or less par- allel to ENE-WSW direction, with vein widths lie in the range of few centimeters as shown in Figures 11(a,b). 3.3. Seismicity Pattern The seismicity pattern of the study area constitutes wide active tectonic trends which are mainly affected by the local active tectonic provinces in Suez Canal region. The historical data of earthquakes is documented in many of the ancient and recent Egyptian annals. According to 32, 33 many events were reported to be occurred in the study area and its surroundings, and to have caused damage of variable degrees in different localities (For examples in 1111, 5, 26; 1364, 11, 28; and 1512, 4, 7). The estimated maximum intensity is (VII) recorded near the study area. The focal depths for epicenters of histori- cal earthquakes range between 10 to 15 km, with magni- tude (3.5 ≤ Mb ≥ 5) where the locations of epicenters of these events are shown in Figure 7. According to Figure 7, there are two seismic cluster zones marked by I and II, which can be identified in the study area and it’s surroundings, extending from NW to SE direction along the Gulf of Suez and delimited by latitudes 29˚25'-30˚15' N and longitudes 32˚00'-32˚30' E. The first cluster zone (I) is located at Wadi Hagul area and its extension to the northwest of Gulf of Suez. It’s 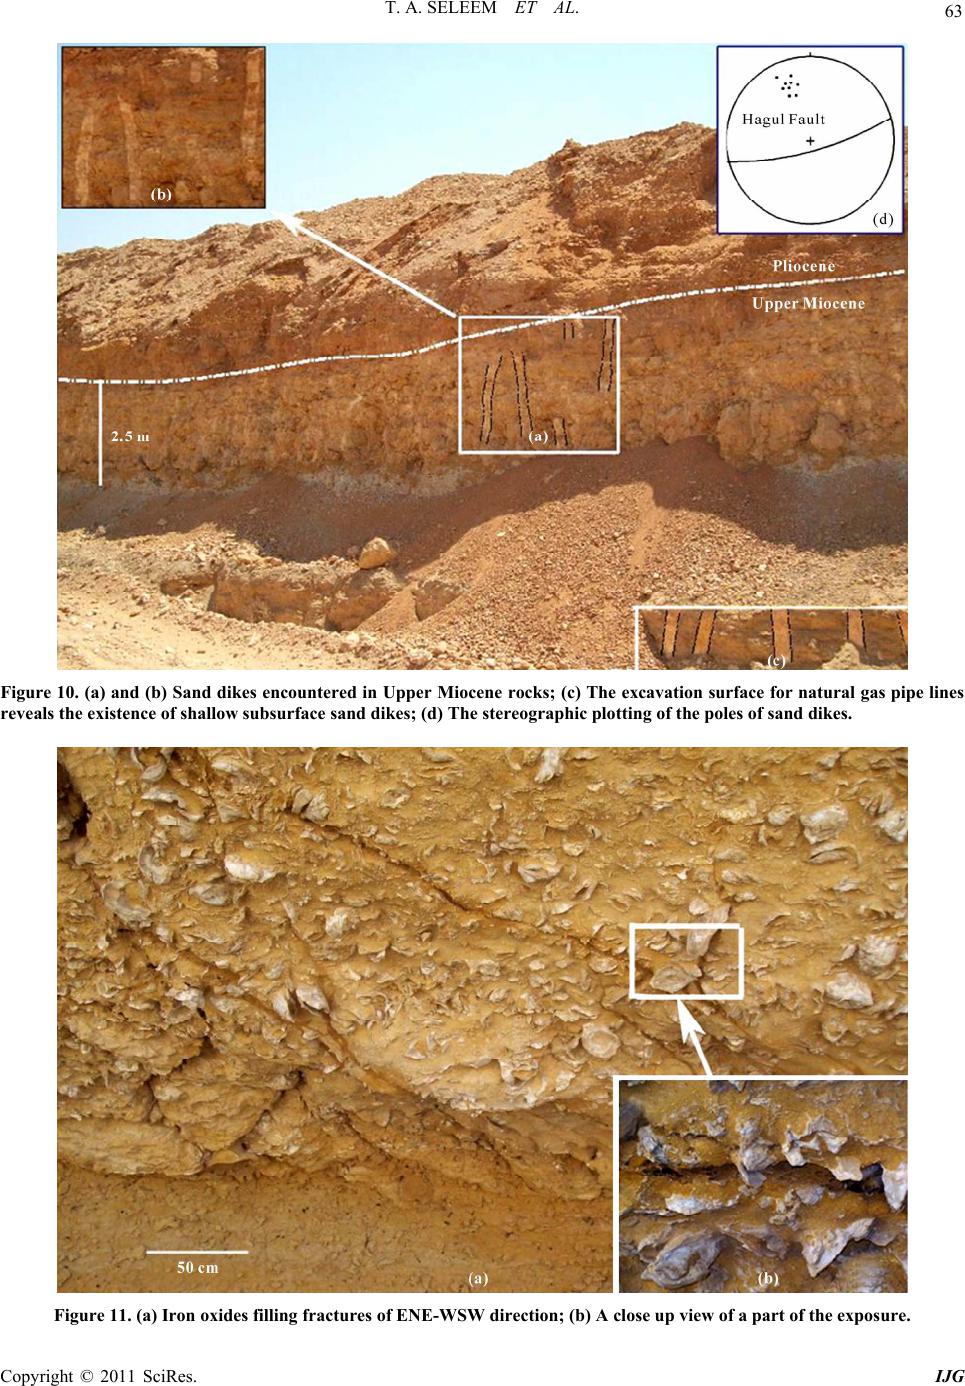 T. A. SELEEM ET AL. Copyright © 2011 SciRes. IJG 63 Figure 10. (a) and (b) Sand dikes encountered in Upper Miocene rocks; (c) The excavation surface for natural gas pipe lines reveals the existence of shallow subsurface sand dikes; (d) The stereographic plotting of the poles of sand dikes. Figure 11. (a) Iron oxides filling fractures of ENE-WSW direction; (b) A close up view of a part of the exposure.  T. A. SELEEM ET AL. Copyright © 2011 SciRes. IJG 64 characterized by the occurrence of low to high moderate magnitudes (Mb ≤ 5.4). The second cluster zone (II) ex- tends westward parallel to the mouth of the Gulf of Suez province and is characterized by the occurrence of low to moderate seismic activity with magnitudes (3.0 ≤ Mb ≥ 4.4). The cluster zones were reported during March, 29, 1984 in Wadi Hagul by a magnitude of 4.7, and a recent one of a moderate shock that took place in May, 22, 1995 in the west Bitter lakes by a magnitude of 4.5 (Figure 7). The seismic activity in the mentioned cluster areas is conformable and affected by the wide active major faults and fracture zones overall the study area, related to the tectonics of the Gulf of Suez as suggested by 25,34. In order to clarify the relationship between the frequency of occurrence of the ancient and recent seismic events, focal depth, and the distribution of epicenters of earthquake in the study area and its surroundings, a statistical analysis was carried out. Histograms and charts were drawn which are subsequently analyzed. The statistical presen- tation is shown in Figures 12, 13 and 14. The results can be concluded in the following points: The high frequency is mainly attributed to focal depths in the range of 5.1-10 and 15-20 km, which appear in the form of bimodal two-bar histogram, Figure 12(a). Analysis of recent earthquakes shows that the high frequency of these earthquakes is assigned to three intervals of magnitudes; 1.1-1.5; 1.6-2; and 2.1-2.5 Ml as shown in Figure 12(b). On the other hand, analysis of the historical earthquakes shows that their high frequencies are contributed to magnitude intervals of 1.6-2; 2.1-2.5; and 2.6-3 Ml (Figure 13). Analysis of focal depths of earthquakes epicenters clarify that most of the earthquakes occur at focal depths in the range between (1 to 35 km) as shown in Figure 14(a). Furthermore, the moderate aver- age earthquakes of the study area were mostly lo- cated at an average focal depth shallower than 16 km Figure 14(b). 4. Discussion This paper summaries and assess issues concerning field searches for the paleo-earthquakes features, as well as, some aspects of the utilization of the different data in paleo-earthquakes interpretation. In the present study, seismogenic features encountered in Wadi Hagul are detected to find the source of earthquakes that continu- ously occur in the area. To achieve that aim, satellite images of ETM and SRTM were used for lithologic dis- crimination and also for extraction the fracture zones represented by structural lineaments. Two kinds of structural evidences account for the seismogenic behavior of Hagul fault which were ob- served in the field; the brittle and viscoplastic features. The brittle structures include faults with associated frac- tures, and colluvial wedge whereas the viscoplastic fea- tures were presented by liquefaction and fluidization features of sand dikes and veins of iron oxides. (a) (b) Figure 12. (a) and (b) Frequency histogram of focal depth and magnitudes of recent earthquakes in the study area and surroundings, respectively. Figure 13. Frequency histogram of magnitudes of historical earthquakes in the study area and surroundings. 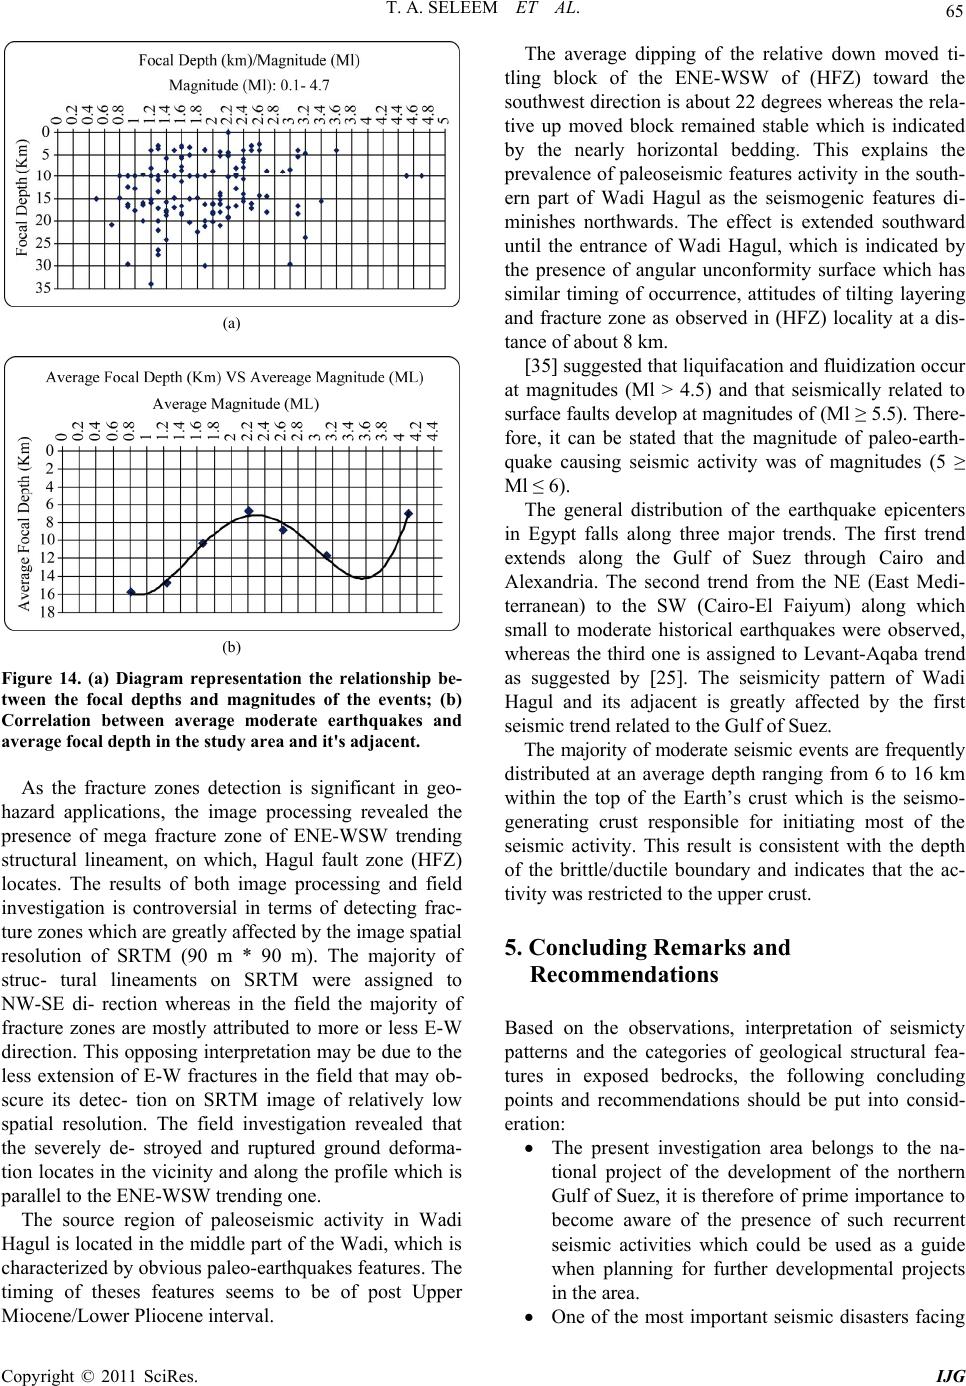 T. A. SELEEM ET AL. Copyright © 2011 SciRes. IJG 65 (a) (b) Figure 14. (a) Diagram representation the relationship be- tween the focal depths and magnitudes of the events; (b) Correlation between average moderate earthquakes and average focal depth in the study area and it's adjacent. As the fracture zones detection is significant in geo- hazard applications, the image processing revealed the presence of mega fracture zone of ENE-WSW trending structural lineament, on which, Hagul fault zone (HFZ) locates. The results of both image processing and field investigation is controversial in terms of detecting frac- ture zones which are greatly affected by the image spatial resolution of SRTM (90 m * 90 m). The majority of struc- tural lineaments on SRTM were assigned to NW-SE di- rection whereas in the field the majority of fracture zones are mostly attributed to more or less E-W direction. This opposing interpretation may be due to the less extension of E-W fractures in the field that may ob- scure its detec- tion on SRTM image of relatively low spatial resolution. The field investigation revealed that the severely de- stroyed and ruptured ground deforma- tion locates in the vicinity and along the profile which is parallel to the ENE-WSW trending one. The source region of paleoseismic activity in Wadi Hagul is located in the middle part of the Wadi, which is characterized by obvious paleo-earthquakes features. The timing of theses features seems to be of post Upper Miocene/Lower Pliocene interval. The average dipping of the relative down moved ti- tling block of the ENE-WSW of (HFZ) toward the southwest direction is about 22 degrees whereas the rela- tive up moved block remained stable which is indicated by the nearly horizontal bedding. This explains the prevalence of paleoseismic features activity in the south- ern part of Wadi Hagul as the seismogenic features di- minishes northwards. The effect is extended southward until the entrance of Wadi Hagul, which is indicated by the presence of angular unconformity surface which has similar timing of occurrence, attitudes of tilting layering and fracture zone as observed in (HFZ) locality at a dis- tance of about 8 km. 35 suggested that liquifacation and fluidization occur at magnitudes (Ml > 4.5) and that seismically related to surface faults develop at magnitudes of (Ml ≥ 5.5). There- fore, it can be stated that the magnitude of paleo-earth- quake causing seismic activity was of magnitudes (5 ≥ Ml ≤ 6). The general distribution of the earthquake epicenters in Egypt falls along three major trends. The first trend extends along the Gulf of Suez through Cairo and Alexandria. The second trend from the NE (East Medi- terranean) to the SW (Cairo-El Faiyum) along which small to moderate historical earthquakes were observed, whereas the third one is assigned to Levant-Aqaba trend as suggested by 25. The seismicity pattern of Wadi Hagul and its adjacent is greatly affected by the first seismic trend related to the Gulf of Suez. The majority of moderate seismic events are frequently distributed at an average depth ranging from 6 to 16 km within the top of the Earth’s crust which is the seismo- generating crust responsible for initiating most of the seismic activity. This result is consistent with the depth of the brittle/ductile boundary and indicates that the ac- tivity was restricted to the upper crust. 5. Concluding Remarks and Recommendations Based on the observations, interpretation of seismicty patterns and the categories of geological structural fea- tures in exposed bedrocks, the following concluding points and recommendations should be put into consid- eration: The present investigation area belongs to the na- tional project of the development of the northern Gulf of Suez, it is therefore of prime importance to become aware of the presence of such recurrent seismic activities which could be used as a guide when planning for further developmental projects in the area. One of the most important seismic disasters facing  T. A. SELEEM ET AL. Copyright © 2011 SciRes. IJG 66 the development projects is the presence of the Hagul fault zone (HFZ), which cuts across, in a perpendicular direction, the asphaltic road and the gas pipe lines, which are newly constructed along the main track of Wadi Hagul. Also, it must be taken into consideration that the nearly E-W tec- tonic trend, on which (HFZ) locates, is an active seismo-tectonic trend through the different geo- logic times. The presence of limestone quarries and associated explosions near Wadi Hagul may more or less fa- cilitate the movement along the weakness planes, especially in an ENE-WSW direction, so it is rec- ommended for the material of gas pipes to be of high pressure to be able enough to stand the possi- ble future seismic activity which may be occurred. Image processing is a powerful tool for lithologic mapping and the detection of fracture zones which may cause ground deformation of the earth’s sur- face. The field check was helpful for the characterization of the paleosesimic activity features. The study gives new insights for a better under- standing of the seismic activity in the study area and its vicinity. Recent and ancient seismic activity in the study area and surroundings indicate that the shallow and moderate earthquakes usually occur with depths ranging between 1 and 35 km within the upper crust zone. There is a great need for geophysical studies to understand the recent tectonic movements of the region. Natural frequency studies are required for the ex- isting constructions and for those planned to be built in the future. 6. References [1] R. Said, “The Geology of Egypt,” Elsevier Publishing Company, Amsterdam, 1962. [2] M. Abdallah, “Structural Geology of the Area between El Galala El-Bahariya and Gabal Okheider, Egypt,” Ph. D. Thesis, Ain Shams University, Cairo, 1993. [3] H. Sadek, “The Geography and Geology of the District between Gebel Ataqa and El Galala El Bahariya (Gulf of Suez),” Egypt Survey Department, Cairo, 1926. [4] A. Abdallah and F. A. E. Hady, “Geology of Sadat Area, Gulf of Suez,” Journal of Geology, Vol. 10, 1966, pp. 1- 24. [5] M. Barakat and N. Aboul Ela, “The Geology of Gebel Geneifa-Gebel Gharra Area, Cairo-Suez District,” The Desert Institute Bulletin, Cairo, Vol. 21, 1971, pp. 31-38. [6] A. Moustafa, “Block Faulting of the Gulf of Suez Pre- sented at 5th Exploration Seminar,” Egyptian General Pe- troleum Company, Cairo, Unpublished Report, 1976. [7] Egyptian Geological Survey and Mining Authority (EGSMA), “The Geologic Map of the Area between Ataqa Mountain and El-Galala El-Bahariya Plateau Scale 1:100000,” 1999. [8] N. El-Azabi, “Sedimentary Facies, Palaeoenvironments and Facies Development of the Miocene–Pliocene Se- quence in the Sadat–Wadi Hagul Stretch, Northwest Gulf of Suez and Their Time Correlatives in the Adjacent Ba- sins, Egypt,” 5th International Conference on the Ge- ology of the Arab World, Cairo University, Cairo, 2000, pp. 1135-1174. [9] A. Omran, “Geo-Environmental Studies of North West- ern Gulf of Suez Region, Egypt,” M. Sc. Thesis, Suez Canal University, Geology Department, Ismailia, 2006. [10] F. Khalaf and A. Gaber, “Occurrence of Palustrine and Calcrete Deposits within the Upper Miocene (Hagul Formation) East Cairo, Egypt,” Journal of African Earth Sciences, Vol. 51, No. 5, 2008, pp. 298-312. doi:10.1016/j.jafrearsci.2008.01.009 [11] M. Abdeen, Y. EL-Kazzaz, G. Attia, M. Yehia and S. Hassan, “Mapping Geological Structures in Wadi Gho- weiba Area, Northwest Gulf of Suez, Egypt Using AS- TER-SPOT Data Fusion and ASTER DEM Egypt,” Journal of Remote Sensing and Space Science, Vol. 12, 2009, pp. 101-126. [12] K. Abou Elenean, A. Mohamed and H. Hussein, “Source Parameters and Ground Motion of the Suez-Cairo Shear Zone Earthquakes, Eastern Desert, Egypt,” Natural Haz- ard, Vol. 52, No. 2, 2010, pp. 431-451. [13] H. Sadek, “The Miocene in the Gulf of Suez Region (Egypt),” Geological Survey and Mineral Resources De- partment, Cairo, 1959. [14] A. EL-Sayed, I. Korrat and H. Hussein, “Seismicity and Seismic Hazard in Alexandria (Egypt) and Its Surround- ings,” Pure Applied Geophysics, Vol. 161, No. 5-6, 2004, pp. 1003-1019. [15] A. Moustafa, R. El-Badrawy and H. Gibali, “Pervasive E-ENE Oriented Faults in Northern Egypt and Their Ef- fect on the Development and Inversion of Prolific Sedi- mentary Basis,” Proceedings of 14th Petroleum Confer- ence, Egyptian General Petroleum Corporation, 1998, pp. 51-67. [16] A. Moustafa and A. Abd-Allah, “Structural Setting of the Central Part of the Cairo-Suez District,” Earth Science, Vol. 5, 1992, pp. 133-145. [17] D. Lowe, “Water Escape Structures in Coarse-Grained Sediments,” Sedimentology, Vol. 22, No. 2, 1975, pp. 157-204. doi:10.1111/j.1365-3091.1975.tb00290.x [18] D. Carter and H. Seed, “Liquefaction Potential of Sand Deposits Under Low Levels of Excitation,” Report No. UCB/EERC-81/11, College of Engineering, University of California, Berkeley, 1988. [19] S. Obermeier, “Use of Liquefaction-Induced Features for Paleoseismic Analysis-An Overview of How Seismic Liquefaction Features can Be Distinguished from Other  T. A. SELEEM ET AL. Copyright © 2011 SciRes. IJG 67 Features and How Their Regional Distribution and Prop- erties of Source Sediment can Be Used to Infer the Loca- tion and Strength of Holocene Paleoearthquakes,” Engi- neering Geology, Vol. 44, 1996, pp. 1-76. doi:10.1016/S0013-7952(96)00040-3 [20] E. Masana, J. Villamarin, J. Carbanero, J. Plaza and P. Santanach, “Seismogenic Faulting in an Area of Flow Seismic Activity: Paleoesismicity of the El Camp Fault (Northeast Spain),” Netherland Journal of Geosciences, Vol. 80, No. 3-4, 2001, pp. 229-241. [21] R. Upadhyay, “Earthquake-Induced Soft-Sediment De- formation in the Lower Shyok River Valley, North Ladakh, India,” Journal of Asian Earth Sciences, Vol. 21, No. 4, 2003, pp. 413-421. doi:10.1016/S1367-9120(02)00033-0 [22] D. Bowman, A. Korjenkov and N. Porat, “Late-Pleisto- cene Seismites from Lake Issk-Kul, the Tien Shan Range, Kyrghyzstan,” Sedmentary Geology, Vol. 163, 2004, pp. 211-228. doi:10.1016/S0037-0738(03)00194-5 [23] S. Obermeier, S. Olson, and R. Green, “Field Occur- rences of Liquifacation-Induced Features: A Primer for Engineering Geologic Analysis of Paleoseismic Shak- ing,” Engineering Geology, Vol. 76, No. 3, 2005, pp. 209-234. doi:10.1016/j.enggeo.2004.07.009 [24] S. Singh and K. Jain, “Liquefaction and Fluidization of Lacustrine Deposits from Lahaual-Spiti and Ladakh Hi- malaya: Geological Evidences of Paleoseismicity along Active Fault Zone,” Sedimentary Geology, Vol. 196, No. 1-4, 2007, pp. 47-57. doi:10.1016/j.sedgeo.2006.06.005 [25] R. Kebeasy, “Seismicity,” In: R. Said, Ed., The Geology of Egypt, A. A. Balkema, Book-Field, 1990, pp. 51-59. [26] K. Abou Elenean and H. Hussein, “The October 11, 1999 and November 08, 2006 Beni Suef Earthquakes, Egypt,” Pure Applied Geophysics, Vol. 165, No. 7, 2008, pp. 1391-1410. doi:10.1007/s00024-008-0363-3 [27] P. Varotsos and M. Lazaridou, “Latest Aspects of Earthquake Prediction in Greece Based on Seismic Electric Signals. I,” Tectonophysics, Vol. 188, No. 3-4, 1991, pp. 321-347. doi:10.1016/0040-1951(91)90462-2 [28] P. Varotsos and K. Alexopoulos, “Physical Properties of the Variations of the Electric Field of the Earth Preceding Earthquakes I,” Tectonophysics, Vol. 110, 1984, pp. 73- 98. doi:10.1016/0040-1951(84)90059-3 [29] S. Uyeda and M. Kamogawa, “The Prediction of Two Large Earthquakes in Greece,” Eos Transactions of AGU, Vol. 89, No. 39, 2008, p. 363. doi:10.1029/2008EO390002 [30] P. Varotsos, N. Sarlis, E. Skordas and M. Lazaridou, “Natural Entropy Fluctuations Discriminate Similar-Look- ing Electric Signals Emitted from Systems of Different Dynamics,” Physical Review E, Vol. 71, No. 011110, 2005, p. 11. [31] P. Varotsos, N. Sarlis, E. Skordas, H. Tanaka and M. Lazaridou, “Attempt to Distinguish Long-Range Tempo- ral Correlations from the Statistics of the Increments by Natural Time Analysis,” Physical Review E, Vol. 74, No. 021123, 2006, p. 12. [32] J. Poirier and H. Taher, “Historical Seismicity in the near and Middle East, North Africa and Spain from Arabic Documents,” Bulletin of Seismological Society American, Vol. 70, 1980, pp. 2185-2201. [33] M. Maamoun, A. Megahed and A. Allam, “Seismicity of Egypt,” Bulletin of Helwan Institute Astronomy and Geophysics, Vol. 4, 1984, pp. 109-160. [34] H. Aboulela, “A Study on the Tectonic Activity and Seismicity in the Suez Canal Region,” M. Sc. Thesis, Suez Canal University, Faculty of Science, Ismailia, 1994. [35] S. Marco and A. Agnon, “Prehistoric Earthquake Defor- mations near Masada. Dead Sea Graben,” Geology, Vol. 23, No. 8, 1995, pp. 695-698. doi:10.1130/0091-7613(1995)023<0695:PEDNMD>2.3. CO;2
|