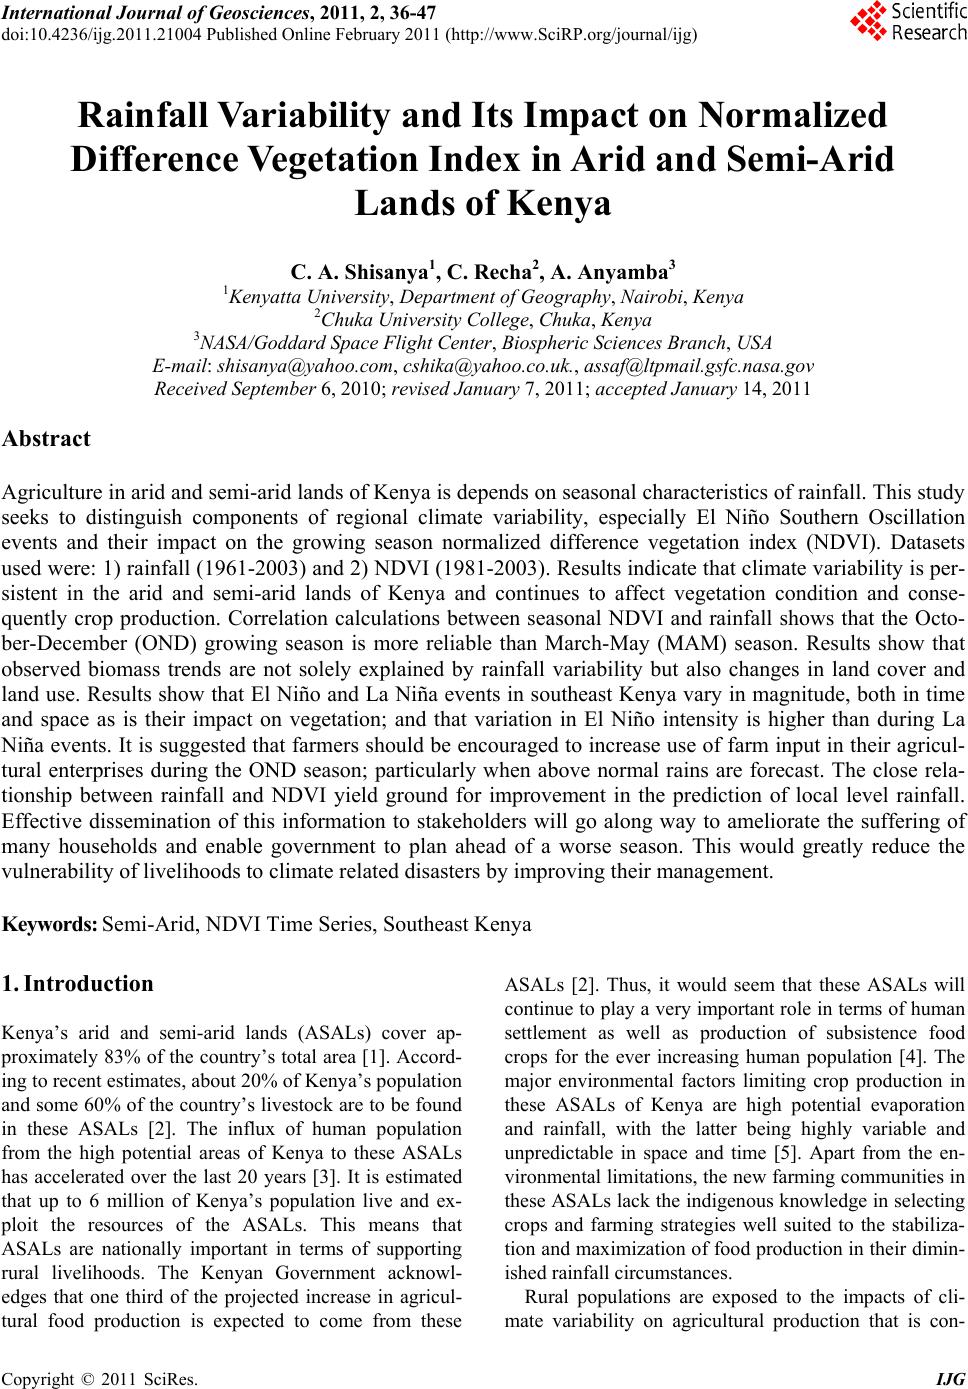
 International Journal of Geosciences, 2011, 2, 36-47 doi:10.4236/ijg.2011.21004 Published Online February 2011 (http://www.SciRP.org/journal/ijg) Copyright © 2011 SciRes. IJG Rainfall Variability and Its Impact on Normalized Difference Vegetation Index in Arid and Semi-Arid Lands of Kenya C. A. Shisanya1, C. Recha2, A. Anyamba3 1Kenyatta University, Department of Geography, Nairobi, K e ny a 2Chuka University College, Chuka, Kenya 3NASA/Godd ar d Sp ace Fl i ght C e nt er, Biospheric Sciences Branch, USA E-mail: shisanya@yahoo.com, csh ika@yahoo.co.uk., assaf@ltpmail.gsfc.nasa.gov Received September 6, 2010; revised January 7, 2011; accepted J a nuary 14, 2011 Abstract Agriculture in arid and semi-arid lands of Kenya is depends on seasonal characteristics of rainfall. This study seeks to distinguish components of regional climate variability, especially El Niño Southern Oscillation events and their impact on the growing season normalized difference vegetation index (NDVI). Datasets used were: 1) rainfall (1961-2003) and 2) NDVI (1981-2003). Results indicate that climate variability is per- sistent in the arid and semi-arid lands of Kenya and continues to affect vegetation condition and conse- quently crop production. Correlation calculations between seasonal NDVI and rainfall shows that the Octo- ber-December (OND) growing season is more reliable than March-May (MAM) season. Results show that observed biomass trends are not solely explained by rainfall variability but also changes in land cover and land use. Results show that El Niño and La Niña events in southeast Kenya vary in magnitude, both in time and space as is their impact on vegetation; and that variation in El Niño intensity is higher than during La Niña events. It is suggested that farmers should be encouraged to increase use of farm input in their agricul- tural enterprises during the OND season; particularly when above normal rains are forecast. The close rela- tionship between rainfall and NDVI yield ground for improvement in the prediction of local level rainfall. Effective dissemination of this information to stakeholders will go along way to ameliorate the suffering of many households and enable government to plan ahead of a worse season. This would greatly reduce the vulnerability of livelihoods to climate related disasters by improving their management. Keywords: Semi-Arid, NDVI Time Series, Southeast Kenya 1. Introduction Kenya’s arid and semi-arid lands (ASALs) cover ap- proximately 83% of the country’s total area [1]. Accord- ing to recent estimates, about 20% of Kenya’s population and some 60% of the co untry’s livestock are to be found in these ASALs [2]. The influx of human population from the high potential areas of Kenya to these ASALs has accelerated over the last 20 years [3]. It is estimated that up to 6 million of Kenya’s population live and ex- ploit the resources of the ASALs. This means that ASALs are nationally important in terms of supporting rural livelihoods. The Kenyan Government acknowl- edges that one third of the projected increase in agricul- tural food production is expected to come from these ASALs [2]. Thus, it would seem that these ASALs will continue to play a very important role in terms of human settlement as well as production of subsistence food crops for the ever increasing human population [4]. The major environmental factors limiting crop production in these ASALs of Kenya are high potential evaporation and rainfall, with the latter being highly variable and unpredictable in space and time [5]. Apart from the en- vironmental limitatio ns, the new farming communities in these ASALs lack the indigenous knowledge in selecting crops and farming strategies well suited to the stabiliza- tion and maximization of food production in their dimin- ished rainfall circumstances. Rural populations are exposed to the impacts of cli- mate variability on agricultural production that is con- 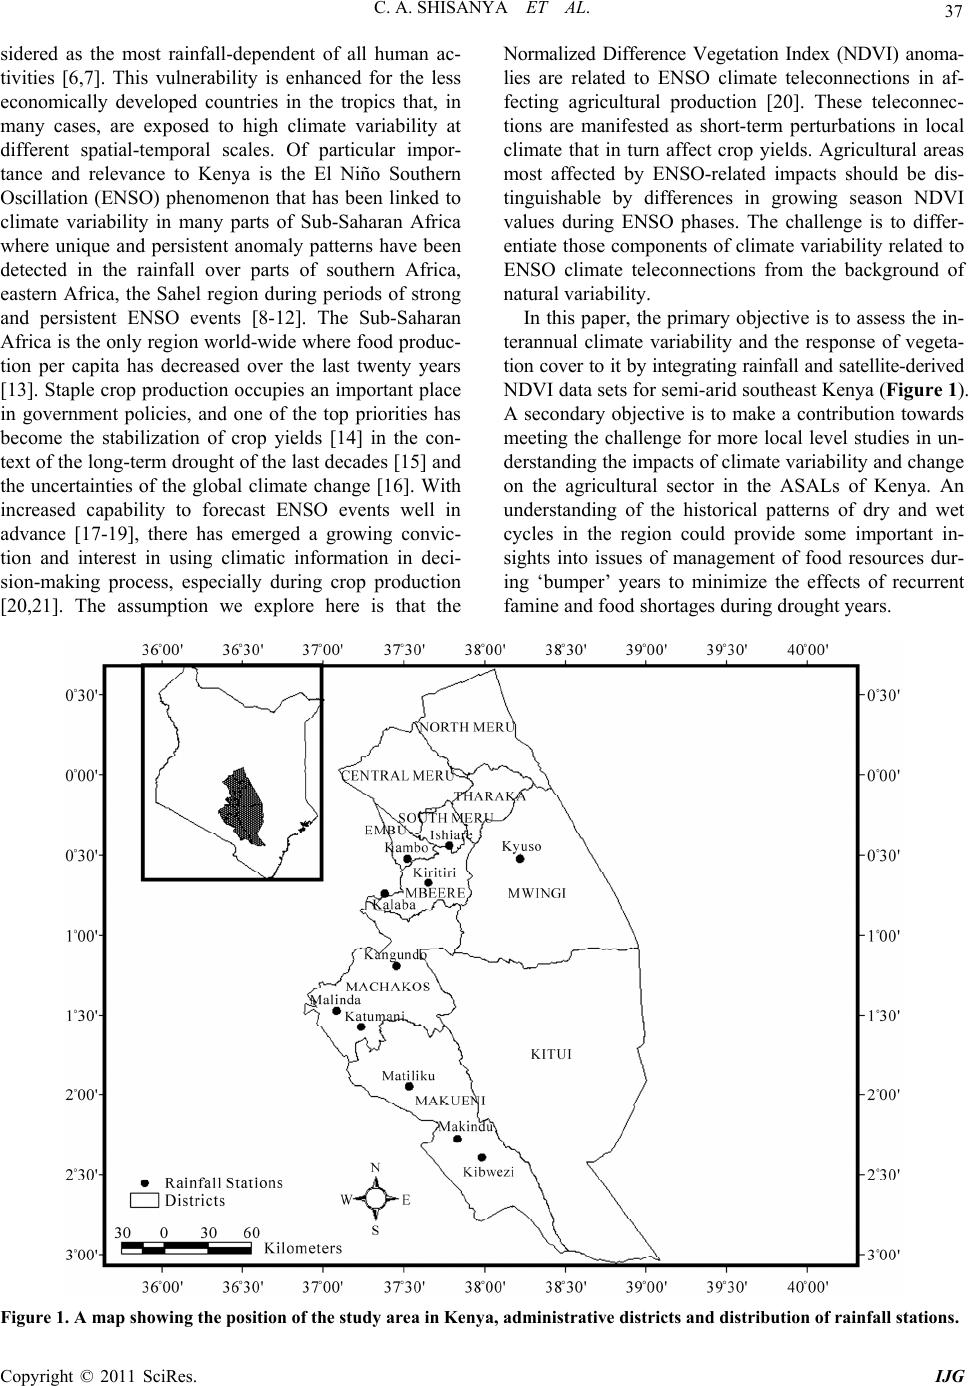 C. A. SHISANYA ET AL. Copyright © 2011 SciRes. IJG 37 sidered as the most rainfall-dependent of all human ac- tivities [6,7]. This vulnerability is enhanced for the less economically developed countries in the tropics that, in many cases, are exposed to high climate variability at different spatial-temporal scales. Of particular impor- tance and relevance to Kenya is the El Niño Southern Oscillation (ENSO) phenomenon that has been linked to climate variability in many parts of Sub-Saharan Africa where unique and persistent anomaly patterns have been detected in the rainfall over parts of southern Africa, eastern Africa, the Sahel region during periods of strong and persistent ENSO events [8-12]. The Sub-Saharan Africa is the only region world -wide where food produc- tion per capita has decreased over the last twenty years [13]. Staple crop production occupies an important place in government policies, and one of the top priorities has become the stabilization of crop yields [14] in the con- text of the long-term drought of the last decades [15] and the uncertainties of the global climate change [16]. With increased capability to forecast ENSO events well in advance [17-19], there has emerged a growing convic- tion and interest in using climatic information in deci- sion-making process, especially during crop production [20,21]. The assumption we explore here is that the Normalized Difference Vegetation Index (NDVI) anoma- lies are related to ENSO climate teleconnections in af- fecting agricultural production [20]. These teleconnec- tions are manifested as short-term perturbations in local climate that in turn affect crop yields. Agricultural areas most affected by ENSO-related impacts should be dis- tinguishable by differences in growing season NDVI values during ENSO phases. The challenge is to differ- entiate those components of climate variability related to ENSO climate teleconnections from the background of natural variability. In this paper, the primary objective is to assess the in- terannual climate variability and the response of vegeta- tion cover to it by integrating rainfall and satellite-derived NDVI data sets for semi-arid southeast Kenya (Figure 1). A secondary objective is to make a contribution towards meeting the challenge for more local level studies in un- derstanding the impacts of climate variability and change on the agricultural sector in the ASALs of Kenya. An understanding of the historical patterns of dry and wet cycles in the region could provide some important in- sights into issues of management of food resources dur- ing ‘bumper’ years to minimize the effects of recurrent famine and food sho rt a ges during d ro u ght years. Figure 1. A map showing the position of the study area in Kenya, administrative districts and distribution of rainfall stations . 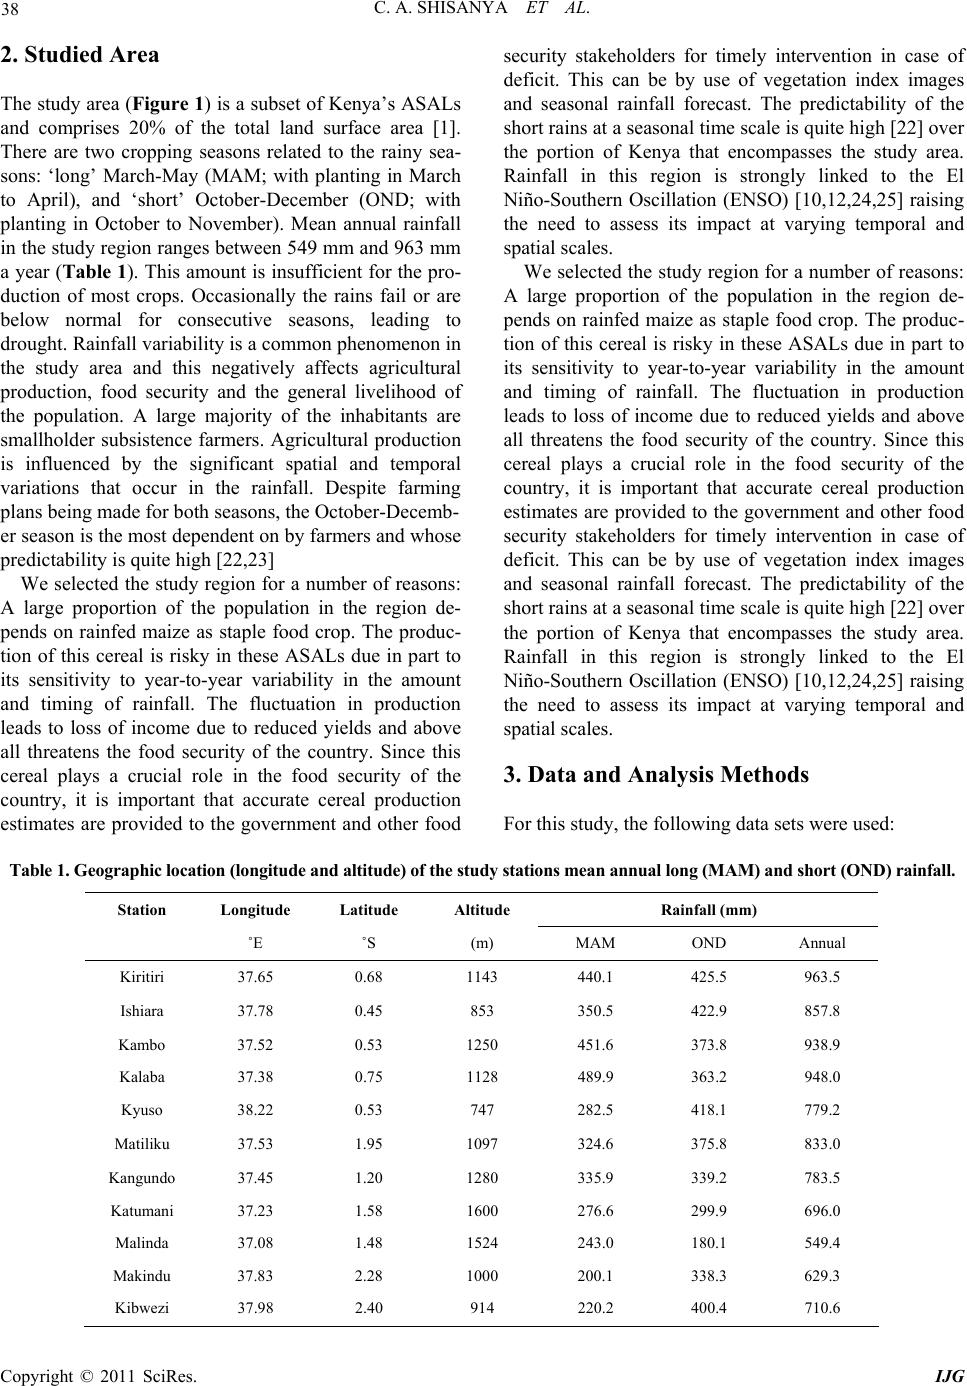 C. A. SHISANYA ET AL. Copyright © 2011 SciRes. IJG 38 2. Studied Area The study area (Figure 1) is a subset of Kenya’s ASALs and comprises 20% of the total land surface area [1]. There are two cropping seasons related to the rainy sea- sons: ‘long’ March-May (MAM; with planting in March to April), and ‘short’ October-December (OND; with planting in October to November). Mean annual rainfall in the study region ranges between 549 mm and 963 mm a year (Tabl e 1). This amount is insufficient for the pro- duction of most crops. Occasionally the rains fail or are below normal for consecutive seasons, leading to drought. Rainfall variability is a co mmon p heno menon in the study area and this negatively affects agricultural production, food security and the general livelihood of the population. A large majority of the inhabitants are smallholder subsistence farmers. Agricultural production is influenced by the significant spatial and temporal variations that occur in the rainfall. Despite farming plans being made for both seasons, the October-Decemb- er season is the most dependent on by farmers and whose predictability i s quite high [22,23] We selected the study region for a number of reasons: A large proportion of the population in the region de- pends on rainfed maize as staple food crop. The produc- tion of this cereal is risky in these ASALs due in part to its sensitivity to year-to-year variability in the amount and timing of rainfall. The fluctuation in production leads to loss of income due to reduced yields and above all threatens the food security of the country. Since this cereal plays a crucial role in the food security of the country, it is important that accurate cereal production estimates are provided to the government and other food security stakeholders for timely intervention in case of deficit. This can be by use of vegetation index images and seasonal rainfall forecast. The predictability of the short rains at a seasonal time scale is quite high [22] over the portion of Kenya that encompasses the study area. Rainfall in this region is strongly linked to the El Niño-Southern Oscillation (ENSO) [10,12,24,25] raising the need to assess its impact at varying temporal and spatial scales. We selected the study region for a number of reasons: A large proportion of the population in the region de- pends on rainfed maize as staple food crop. The produc- tion of this cereal is risky in these ASALs due in part to its sensitivity to year-to-year variability in the amount and timing of rainfall. The fluctuation in production leads to loss of income due to reduced yields and above all threatens the food security of the country. Since this cereal plays a crucial role in the food security of the country, it is important that accurate cereal production estimates are provided to the government and other food security stakeholders for timely intervention in case of deficit. This can be by use of vegetation index images and seasonal rainfall forecast. The predictability of the short rains at a seasonal time scale is quite high [22] over the portion of Kenya that encompasses the study area. Rainfall in this region is strongly linked to the El Niño-Southern Oscillation (ENSO) [10,12,24,25] raising the need to assess its impact at varying temporal and spatial scales. 3. Data and Analysis Methods For this study, the following data sets were used: Table 1. Geographic location (longitude and altitude) of the study stations mean annual long (MAM) and short (OND) rainfall. Station Longitude Latitude Altitude Rainfall (mm) ˚E ˚S (m) MAM OND Annual Kiritiri 37.65 0.68 1143 440.1 425.5 963.5 Ishiara 37.78 0.45 853 350.5 422.9 857.8 Kambo 37.52 0.53 1250 451.6 373.8 938.9 Kalaba 37.38 0.75 1128 489.9 363.2 948.0 Kyuso 38.22 0.53 747 282.5 418.1 779.2 Matiliku 37.53 1.95 1097 324.6 375.8 833.0 Kangundo 37.45 1.20 1280 335.9 339.2 783.5 Katumani 37.23 1.58 1600 276.6 299.9 696.0 Malinda 37.08 1.48 1524 243.0 180.1 549.4 Makindu 37.83 2.28 1000 200.1 338.3 629.3 Kibwezi 37.98 2.40 914 220.2 400.4 710.6  C. A. SHISANYA ET AL. Copyright © 2011 SciRes. IJG 39 3.1. Rainfall Daily precipitation data was obtained from the Kenya Meteorological department (KMD) archives from 1961 to 2003 for the 11 stations used in the study (Table 1). Rainfall record periods however varied between 25 and 43 years. The selected stations are not well distributed over the study region (Figure 1) because of closure, missing data and short record periods. Missing data in the record periods were estimated using the method de- scribed by [26]. Homogeneity test on the data sets was done according to the method of [27]. The study also sought to investigate ENSO-related variability in rainfall at annual and seasonal timescales in southeast Kenya for the period 1960 to 2003. This was achieved by adopting the National Center for Environmental Prediction (NCEP) (http://www.cpc.ncep.noaa.gov/comment-form.html). NCEP has classified ENSO events since the 1885 world. How- ever the study limited itself to the period 1960 to 2003 because it was about this time that most of the rainfall stations were established. According NCEP [28] the years 1965, 1972, 1982, 1986, 1987, 1991, 1994 and 1997 were classified as El Niño years; whereas 1970, 1973, 1975 1988, 1998 as La Niña years. Quantification of ENSO-related variability events is to enhance the un- derstanding of their effect on rainfall and crop yield in southeast Kenya. 3.2. Normalized Difference Vegetation Index (NDVI) The NDVI is based on properties of green vegetation to reflect the incident solar radiation differently in two spectral wavebands observed by the AVHRR sensor aboard NOAA polar orb iting satellite series (NOAA-7,9, 11,14,16): visible 550-700 nm (Channel 1) and near- infrared 730-1000 nm (Channel 2) [29]. The presence of chlorophyll pigment in g reen vegetation and leaf scatter- ing mechanisms cause low spectral reflectance in Chan- nel 1 and high reflectance in Channel 2, respectively. Reflectance values change in the opposite direction if vegetation is under stress [30]. Hence, the NDVI meas- ures vegetation vigour and greenness [31] and is calcu- lated as follows: NDVINIR RNIR R (1) where: NIR and R represent the reflectance of the near infrared (Channel 2) and the red (Channel 1), respec- tively. The NDVI is unit-les s, with v alues ran g ing from –1 to +1. Healthy green vegetation normally has the high est positive values while surfaces without vegetation, such as bare soil, water, snow, ice or clouds usually have low NDVI values that are near zero or slightly negative. Stressed vegetation or vegetation with small leaf area has positive but reduced NDVI values [3 0,32]. The justifica- tion for using NDVI data in monitoring ecosystem dy- namics in arid and semi-arid lands is based on the exten- sive research agenda in the 1980s and 1990s in arid re- gions that demonstrated the significant correlation be- tween NDVI and rainfall variations on seasonal to inter- annual time scales [33-37]. The established relationship between NDVI and rainfall formed the basis for using time series NDVI data for drought monitoring and early famine warning systems in areas with sparse rainfall networks [38-40]. Furthermore, NDVI data set has been used to examine the connection between climate varia- tions and ecosystem dynamics, particularly those associ- ated with ENSO phenomenon [41-44] and recently to investigate long-term trends in vegetation [29,45,46] Data used in this study were processed by the GIMMS group at NASA’s Goddard Space Flight Center, as de- scribed by Anyamba and Tucker [29]. For this research, NDVI monthly data from 1981-2004 at 8 km spatial res- olution was used [29]. In addition, monthly NDVI data from SPOT Vegetation Instrument from May 1998 to December 2004 at 1 km spatial resolution was utilized. The satellite data was used to study aspects of spatial variability that were not captured by the rainfall stations data. Since NDVI is closely related to rainfall seasonality [29], analysis was focused on the growing seasons, i.e. ‘long’ and ‘short’ rainy seasons in our case. These sea- sons for arid and semi-arid Kenya are well differentiated and details can be found in Jaetzold et al. [47]. The months of March, April and May, hereafter referred to as MAM represent the ‘long’ rains growing period, while October, November and December (OND) represent the ‘short’ rains growing period. The long-term NDVI cli- matology (1981-2004) was created by averaging data for all cloud-free pixels for MAM and OND for the same period. The year to year variability in the NDVI patterns was examined by calculating yearly MAM and OND anomalies as follows: 1100NDVINDVI NDVI (2) where: NDVI are the respective MAM and OND anomalies, NDVI are individual seasonal MAM and OND means and NDVI is the long-term MAM and OND mean. Table 2 shows aggregate NDVI for annual and seasonal NDVI by station in the study area. 4. Results and Discussion Figures 2(a-c) show rainfall variability for MAM, OND and annual for some of the sites in the study. Rainfall in southeast Kenya deviates from the normal by more than 1.5 standard deviations (For example, 1961, 1967 and 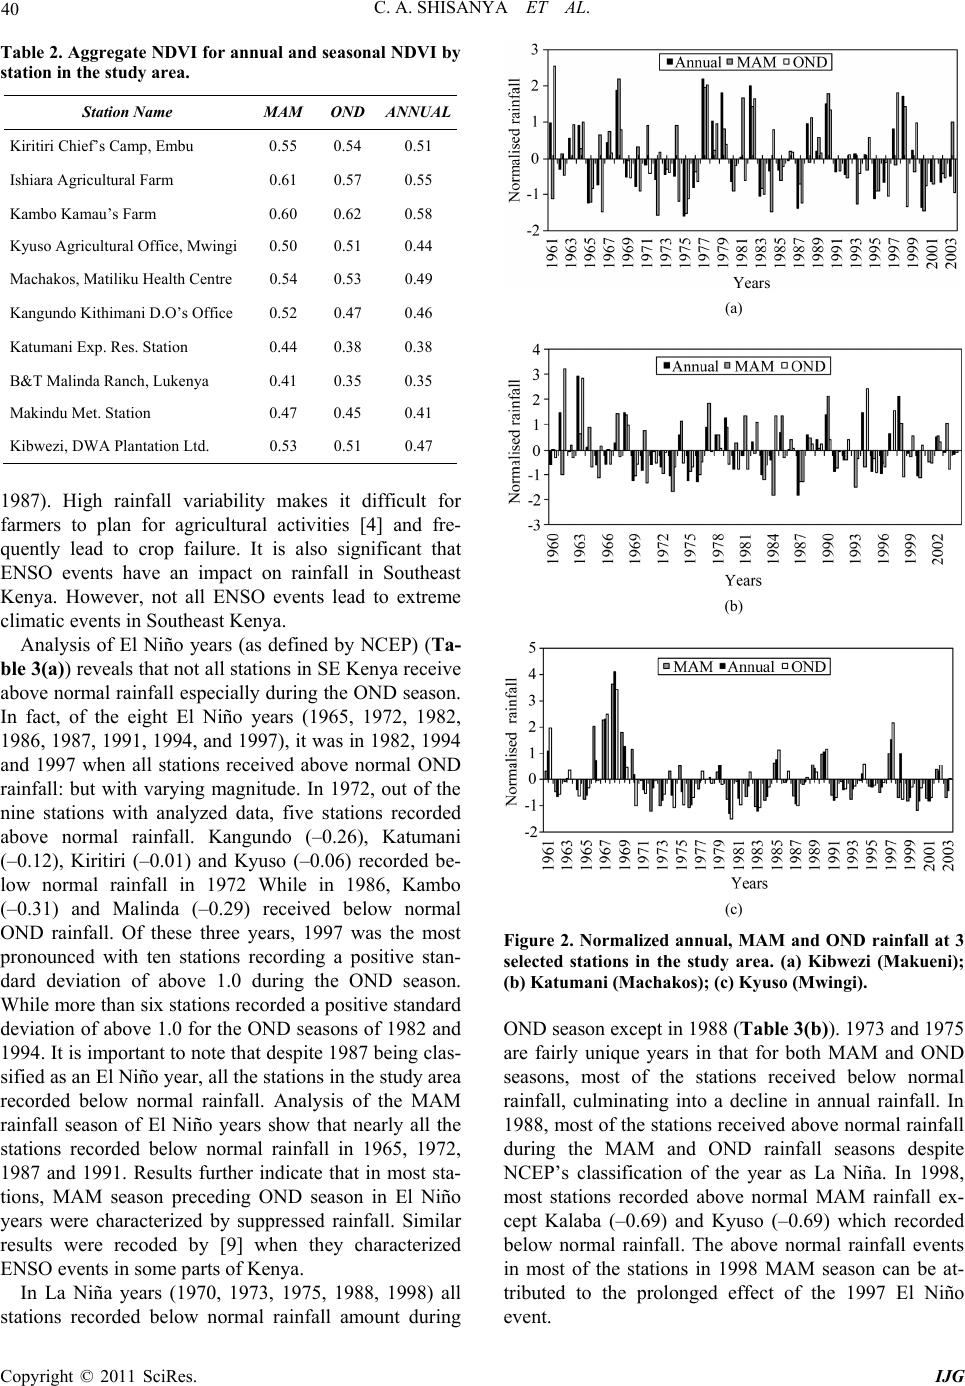 C. A. SHISANYA ET AL. Copyright © 2011 SciRes. IJG 40 Table 2. Aggregate NDVI for annual and seasonal NDV I by station in the study area. Station Name MAM OND ANNUAL Kiritiri Chief’s Camp, Embu 0.55 0.54 0.51 Ishiara Agricultural Farm 0.61 0.57 0.55 Kambo Kamau’s Farm 0.60 0.62 0.58 Kyuso Agricultural Office, Mwingi0.50 0.51 0.44 Machakos, Ma tiliku Health Centre 0.54 0.53 0.49 Kangundo Kithimani D.O’s Office 0.52 0.47 0.46 Katumani Exp. Res. Station 0.44 0.38 0.38 B&T Malinda Ranch, Lukenya 0.41 0.35 0.35 Makindu Met. Station 0.47 0.45 0.41 Kibwezi, DWA Plantation Ltd. 0.53 0.51 0.47 1987). High rainfall variability makes it difficult for farmers to plan for agricultural activities [4] and fre- quently lead to crop failure. It is also significant that ENSO events have an impact on rainfall in Southeast Kenya. However, not all ENSO events lead to extreme climatic events in Southeast Kenya. Analysis of El Niño years (as defined by NCEP) (Ta- ble 3(a)) reveals that not all stations in SE Kenya receive above normal rainfall especially during the OND season. In fact, of the eight El Niño years (1965, 1972, 1982, 1986, 1987, 199 1, 1994, and 1997), it was in 1982 , 1994 and 1997 when all stations received above normal OND rainfall: but with varying magnitude. In 1972, out of the nine stations with analyzed data, five stations recorded above normal rainfall. Kangundo (–0.26), Katumani (–0.12), Kiritiri (–0.01) and Kyuso (–0.06) recorded be- low normal rainfall in 1972 While in 1986, Kambo (–0.31) and Malinda (–0.29) received below normal OND rainfall. Of these three years, 1997 was the most pronounced with ten stations recording a positive stan- dard deviation of above 1.0 during the OND season. While more than six stations recorded a positive standard deviation of above 1.0 for the OND seasons of 1982 and 1994. It is important to note that d espite 1987 being clas- sified as an El Niño year, all the stations in the study area recorded below normal rainfall. Analysis of the MAM rainfall season of El Niño years show that nearly all the stations recorded below normal rainfall in 1965, 1972, 1987 and 1991. Results further indicate that in most sta- tions, MAM season preceding OND season in El Niño years were characterized by suppressed rainfall. Similar results were recoded by [9] when they characterized ENSO events in some parts of Kenya. In La Niña years (1970, 1973, 1975, 1988, 1998) all stations recorded below normal rainfall amount during (a) (b) (c) Figure 2. Normalized annual, MAM and OND rainfall at 3 selected stations in the study area. (a) Kibwezi (Makueni); (b) Katumani (Machakos); (c) Kyuso (Mwingi). OND season except in 1988 (Table 3(b)). 1973 and 1975 are fairly unique years in that for both MAM and OND seasons, most of the stations received below normal rainfall, culminating into a decline in annual rainfall. In 1988, most of the stations received above normal rainfall during the MAM and OND rainfall seasons despite NCEP’s classification of the year as La Niña. In 1998, most stations recorded above normal MAM rainfall ex- cept Kalaba (–0.69) and Kyuso (–0.69) which recorded below normal rainfall. The above normal rainfall events in most of the stations in 1998 MAM season can be at- tributed to the prolonged effect of the 1997 El Niño event. 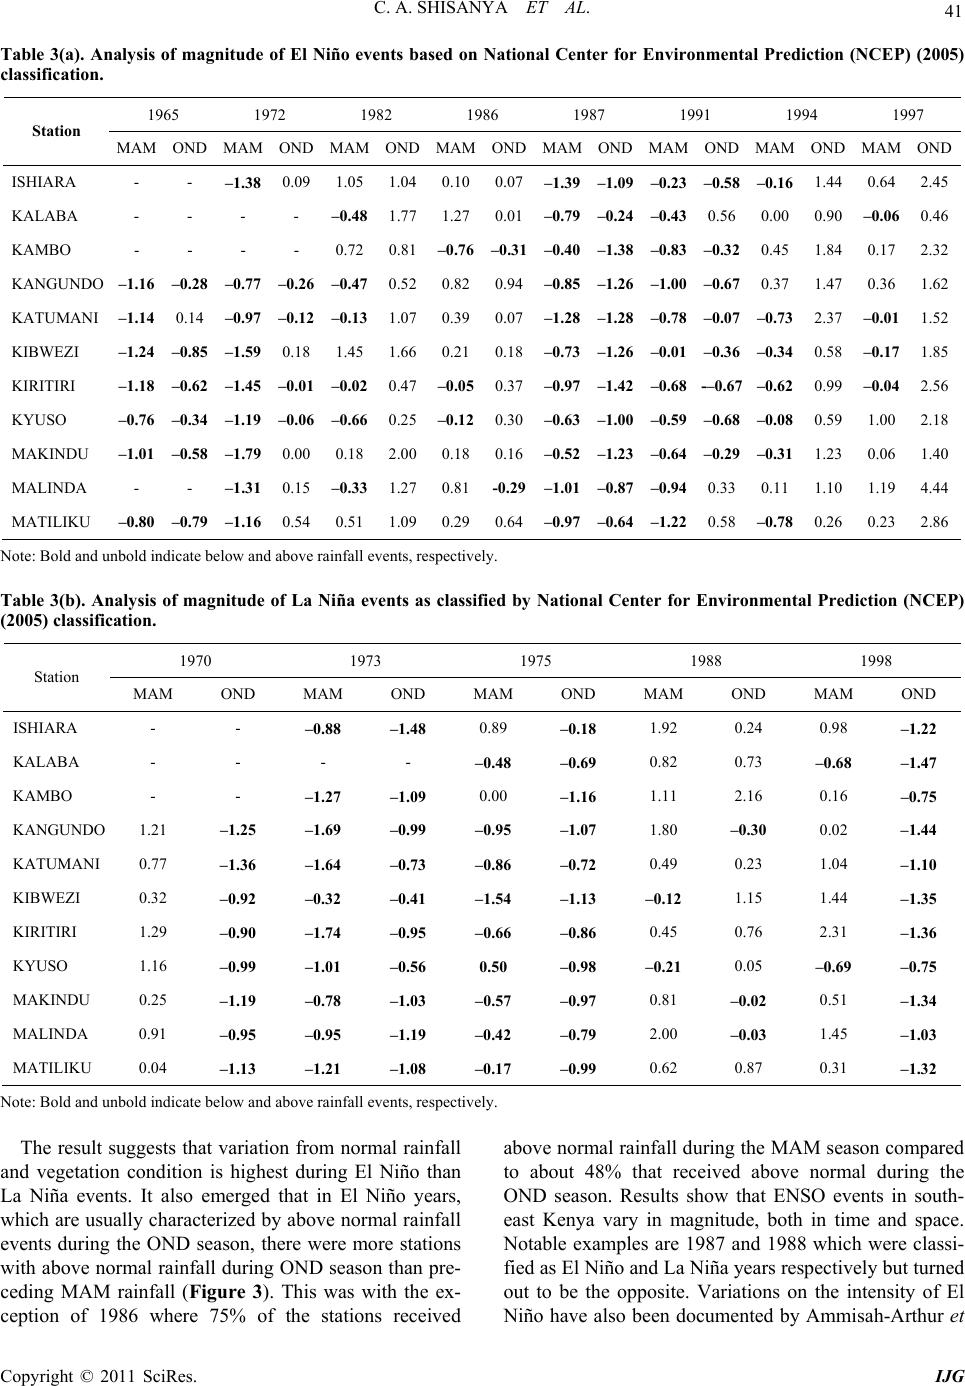 C. A. SHISANYA ET AL. Copyright © 2011 SciRes. IJG 41 Table 3(a). Analysis of magnitude of El Niño events based on National Center for Environmental Prediction (NCEP) (2005) classification. 1965 1972 1982 1986 1987 1991 1994 1997 Station MAM OND MAM OND MAM ONDMAMONDMAMONDMAMOND MAM OND MAMOND ISHIARA - - –1.38 0.09 1.05 1.040.100.07 –1.39–1.09–0.23–0.58 –0.16 1.44 0.642.45 KALABA - - - - –0.48 1.771.270.01 –0.79 –0.24 –0.430.56 0.00 0.90 –0.06 0.46 KAMBO - - - - 0.72 0.81–0.76–0.31–0.40–1.38–0.83–0.32 0.45 1.84 0.172.32 KANGUNDO –1.16 –0.28 –0.77 –0.26 –0.47 0.520.820.94 –0.85–1.26–1.00–0.67 0.37 1.47 0.361.62 KATUMANI –1.14 0.14 –0.97 –0.12 –0.13 1.070.390.07 –1.28–1.28–0.78–0.07 –0.73 2.37 –0.011.52 KIBWEZI –1.24 –0.85 –1.59 0.18 1.45 1.660.210.18 –0.73–1.26–0.01–0.36 –0.34 0.58 –0.17 1.85 KIRITIRI –1.18 –0.62 –1.45 –0.01 –0.02 0.47 –0.05 0.37 –0.97–1.42–0.68-–0.67 –0.62 0.99 –0.04 2.56 KYUSO –0.76 –0.34 –1.19 –0.06 –0.66 0.25 –0.12 0.30–0.63–1.00–0.59–0.68 –0.08 0.59 1.002.18 MAKINDU –1.01 –0.58 –1.79 0.00 0.18 2.000.180.16 –0.52–1.23–0.64–0.29 –0.31 1.23 0.061.40 MALINDA - - –1.31 0.15 –0.33 1.270.81 -0.29–1.01 –0.87 –0.940.33 0.11 1.10 1.194.44 MATILIKU –0.80 –0.79 –1.16 0.54 0.51 1.090.290.64 –0.97 –0.64 –1.220.58 –0.78 0.26 0.232.86 Note: Bold and unbold indicat e b e l ow and above rainfall e v e n t s , respectively. Table 3(b). Analysis of magnitude of La Niña events as classified by National Center for Environmental Prediction (NCEP) (2005) classification. 1970 1973 1975 1988 1998 Station MAM OND MAM OND MAM OND MAM OND MAM OND ISHIARA - - –0.88 –1.48 0.89 –0.18 1.92 0.24 0.98 –1.22 KALABA - - - - –0.48 –0.69 0.82 0.73 –0.68 –1.47 KAMBO - - –1.27 –1.09 0.00 –1.16 1.11 2.16 0.16 –0.75 KANGUNDO 1.21 –1.25 –1.69 –0.99 –0.95 –1.07 1.80 –0.30 0.02 –1.44 KATUMANI 0.77 –1.36 –1.64 –0.73 –0.86 –0.72 0.49 0.23 1.04 –1.10 KIBWEZI 0.32 –0.92 –0.32 –0.41 –1.54 –1.13 –0.12 1.15 1.44 –1.35 KIRITIRI 1.29 –0.90 –1.74 –0.95 –0.66 –0.86 0.45 0.76 2.31 –1.36 KYUSO 1.16 –0.99 –1.01 –0.56 0.50 –0.98 –0.21 0.05 –0.69 –0.75 MAKINDU 0.25 –1.19 –0.78 –1.03 –0.57 –0.97 0.81 –0.02 0.51 –1.34 MALINDA 0.91 –0.95 –0.95 –1.19 –0.42 –0.79 2.00 –0.03 1.45 –1.03 MATILIKU 0.04 –1.13 –1.21 –1.08 –0.17 –0.99 0.62 0.87 0.31 –1.32 Note: Bold and unbold indicat e b e l ow and above rainfall e v e n t s , respectively. The result suggests that variation from normal rainfall and vegetation condition is highest during El Niño than La Niña events. It also emerged that in El Niño years, which are usually characterized by above normal rainfall events during the OND season, there were more stations with above normal rainfall during OND season than pre- ceding MAM rainfall (Figure 3). This was with the ex- ception of 1986 where 75% of the stations received above normal rainf all during the MAM season compared to about 48% that received above normal during the OND season. Results show that ENSO events in south- east Kenya vary in magnitude, both in time and space. Notable examples are 1987 and 1988 which were classi- fied as El Niño and La Niña years respectively but turned out to be the opposite. Variations on the intensity of El Niño have also been documented by Ammisah-Arthur et 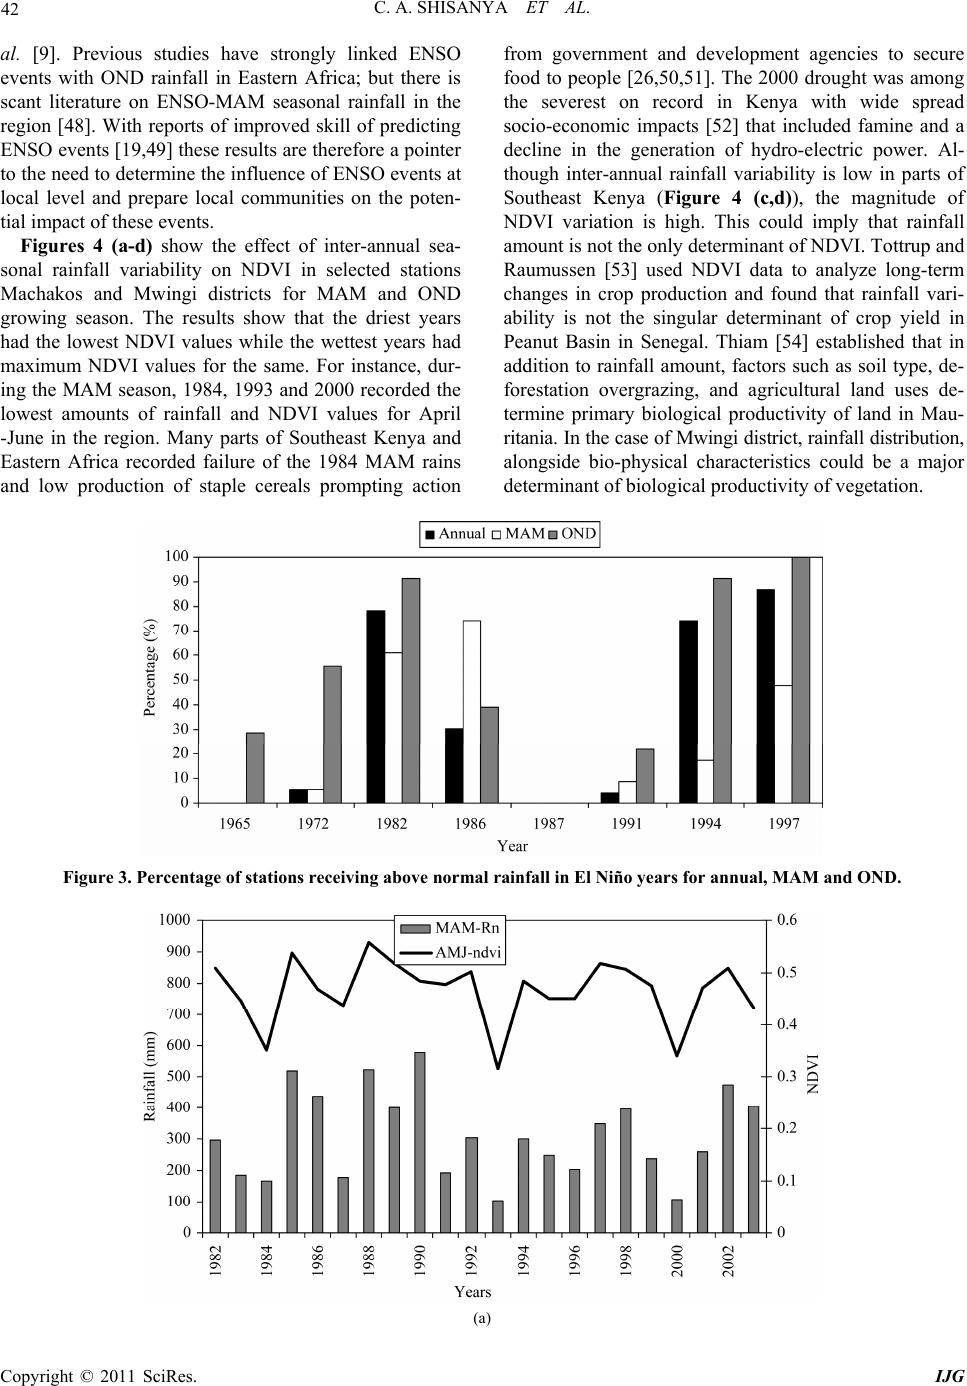 C. A. SHISANYA ET AL. Copyright © 2011 SciRes. IJG 42 al. [9]. Previous studies have strongly linked ENSO events with OND rainfall in Eastern Africa; but there is scant literature on ENSO-MAM seasonal rainfall in the region [48]. With reports of improved skill of predicting ENSO ev ents [19,49] th ese results are th erefore a pointer to the need to determine the influence of ENSO ev ents at local level and prepare local communities on the poten- tial impact of these events. Figures 4 (a-d) show the effect of inter-annual sea- sonal rainfall variability on NDVI in selected stations Machakos and Mwingi districts for MAM and OND growing season. The results show that the driest years had the lowest NDVI values while the wettest years had maximum NDVI values for the same. For instance, dur- ing the MAM season, 1984, 1993 and 2000 recorded the lowest amounts of rainfall and NDVI values for April -June in the region. Many parts of Southeast Kenya and Eastern Africa recorded failure of the 1984 MAM rains and low production of staple cereals prompting action from government and development agencies to secure food to people [26,50,51]. The 2000 drought was among the severest on record in Kenya with wide spread socio-economic impacts [52] that included famine and a decline in the generation of hydro-electric power. Al- though inter-annual rainfall variability is low in parts of Southeast Kenya (Figure 4 (c,d)), the magnitude of NDVI variation is high. This could imply that rainfall amount is not the only determinant of NDVI. Tottrup and Raumussen [53] used NDVI data to analyze long-term changes in crop production and found that rainfall vari- ability is not the singular determinant of crop yield in Peanut Basin in Senegal. Thiam [54] established that in addition to rainfall amount, factors such as soil type, de- forestation overgrazing, and agricultural land uses de- termine primary biological productivity of land in Mau- ritania. In the case of Mwingi district, rainfall distribution, alongside bio-physical characteristics could be a major determinant of biological productivity of vegetation. Figure 3. Percentage of stations receiving above normal r ainfall in El Niño years for annual, MAM and OND. (a) 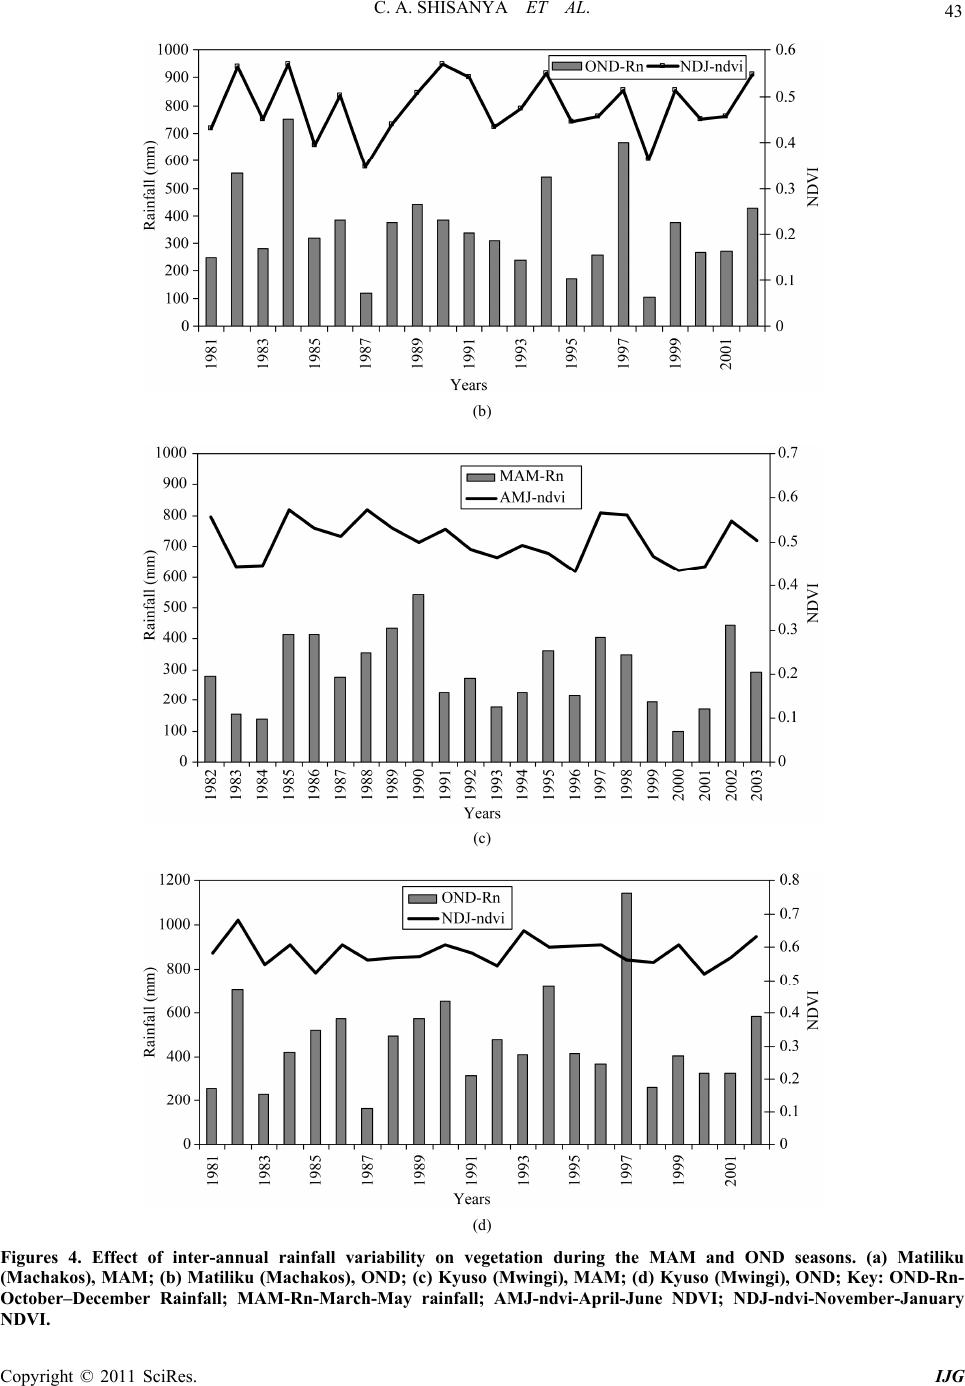 C. A. SHISANYA ET AL. Copyright © 2011 SciRes. IJG 43 (b) (c) (d) Figures 4. Effect of inter-annual rainfall variability on vegetation during the MAM and OND seasons. (a) Matiliku (Machakos), MAM; (b) Matiliku (Machakos), OND; (c) Kyuso (Mwingi), MAM; (d) Kyuso (Mwingi), OND; Key: OND-Rn- October–December Rainfall; MAM-Rn-March-May rainfall; AMJ-ndvi-April-June NDVI; NDJ-ndvi-November-January NDVI. 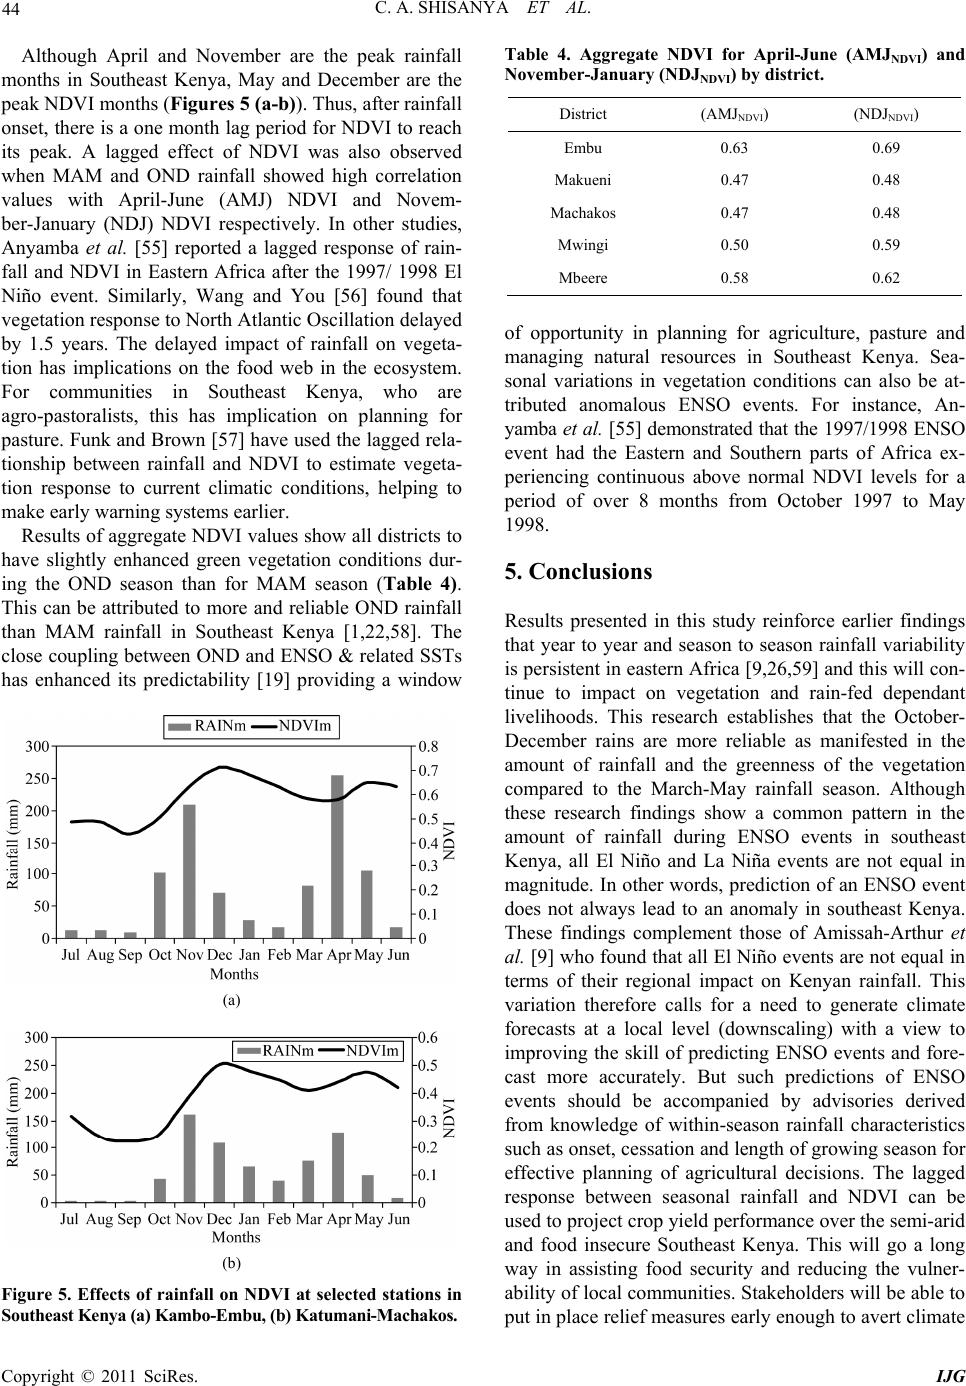 C. A. SHISANYA ET AL. Copyright © 2011 SciRes. IJG 44 Although April and November are the peak rainfall months in Southeast Kenya, May and December are the peak NDVI months (Figures 5 (a-b)). Thus, after rainfall onset, there is a one month lag period for NDVI to reach its peak. A lagged effect of NDVI was also observed when MAM and OND rainfall showed high correlation values with April-June (AMJ) NDVI and Novem- ber-January (NDJ) NDVI respectively. In other studies, Anyamba et al. [55] reported a lagged response of rain- fall and NDVI in Eastern Africa after the 1997/ 1998 El Niño event. Similarly, Wang and You [56] found that vegetation response to North Atlantic Oscillation delayed by 1.5 years. The delayed impact of rainfall on vegeta- tion has implications on the food web in the ecosystem. For communities in Southeast Kenya, who are agro-pastoralists, this has implication on planning for pasture. Funk and Brown [57] ha ve used the lagged rela- tionship between rainfall and NDVI to estimate vegeta- tion response to current climatic conditions, helping to make early warning systems earlier. Results of aggregate NDVI values show all districts to have slightly enhanced green vegetation conditions dur- ing the OND season than for MAM season (Table 4). This can be attributed to more and reliable OND rainfall than MAM rainfall in Southeast Kenya [1,22,58]. The close coupling between OND and ENSO & related SSTs has enhanced its predictability [19] providing a window (a) (b) Figure 5. Effects of rainfall on NDVI at selected stations in Southeast Kenya (a) Kambo-Embu, (b) Katumani-Machakos. Table 4. Aggregate NDVI for April-June (AMJNDVI) and November-January (NDJNDVI) by district. District (AMJNDVI) (NDJNDVI) Embu 0.63 0.69 Makueni 0.47 0.48 Machakos 0.47 0.48 Mwingi 0.50 0.59 Mbeere 0.58 0.62 of opportunity in planning for agriculture, pasture and managing natural resources in Southeast Kenya. Sea- sonal variations in vegetation conditions can also be at- tributed anomalous ENSO events. For instance, An- yamba et al. [55] demonstrated that the 1997/1998 ENSO event had the Eastern and Southern parts of Africa ex- periencing continuous above normal NDVI levels for a period of over 8 months from October 1997 to May 1998. 5. Conclusions Results presented in this study reinforce earlier findings that year to year and season to season rainfall variability is persistent in eastern Africa [9,26,59] and this will con- tinue to impact on vegetation and rain-fed dependant livelihoods. This research establishes that the October- December rains are more reliable as manifested in the amount of rainfall and the greenness of the vegetation compared to the March-May rainfall season. Although these research findings show a common pattern in the amount of rainfall during ENSO events in southeast Kenya, all El Niño and La Niña events are not equal in magnitude. In other words, prediction of an ENSO event does not always lead to an anomaly in southeast Kenya. These findings complement those of Amissah-Arthur et al. [9] who found that all El Niño events are not equal in terms of their regional impact on Kenyan rainfall. This variation therefore calls for a need to generate climate forecasts at a local level (downscaling) with a view to improving the skill of predicting ENSO events and fore- cast more accurately. But such predictions of ENSO events should be accompanied by advisories derived from knowledge of within-season rainfall characteristics such as onset, cessation and length of growing season for effective planning of agricultural decisions. The lagged response between seasonal rainfall and NDVI can be used to project crop yield performance over the semi-arid and food insecure Southeast Kenya. This will go a long way in assisting food security and reducing the vulner- ability of local communities. Stakeholders will be able to put in place relief measures early enough to avert climate 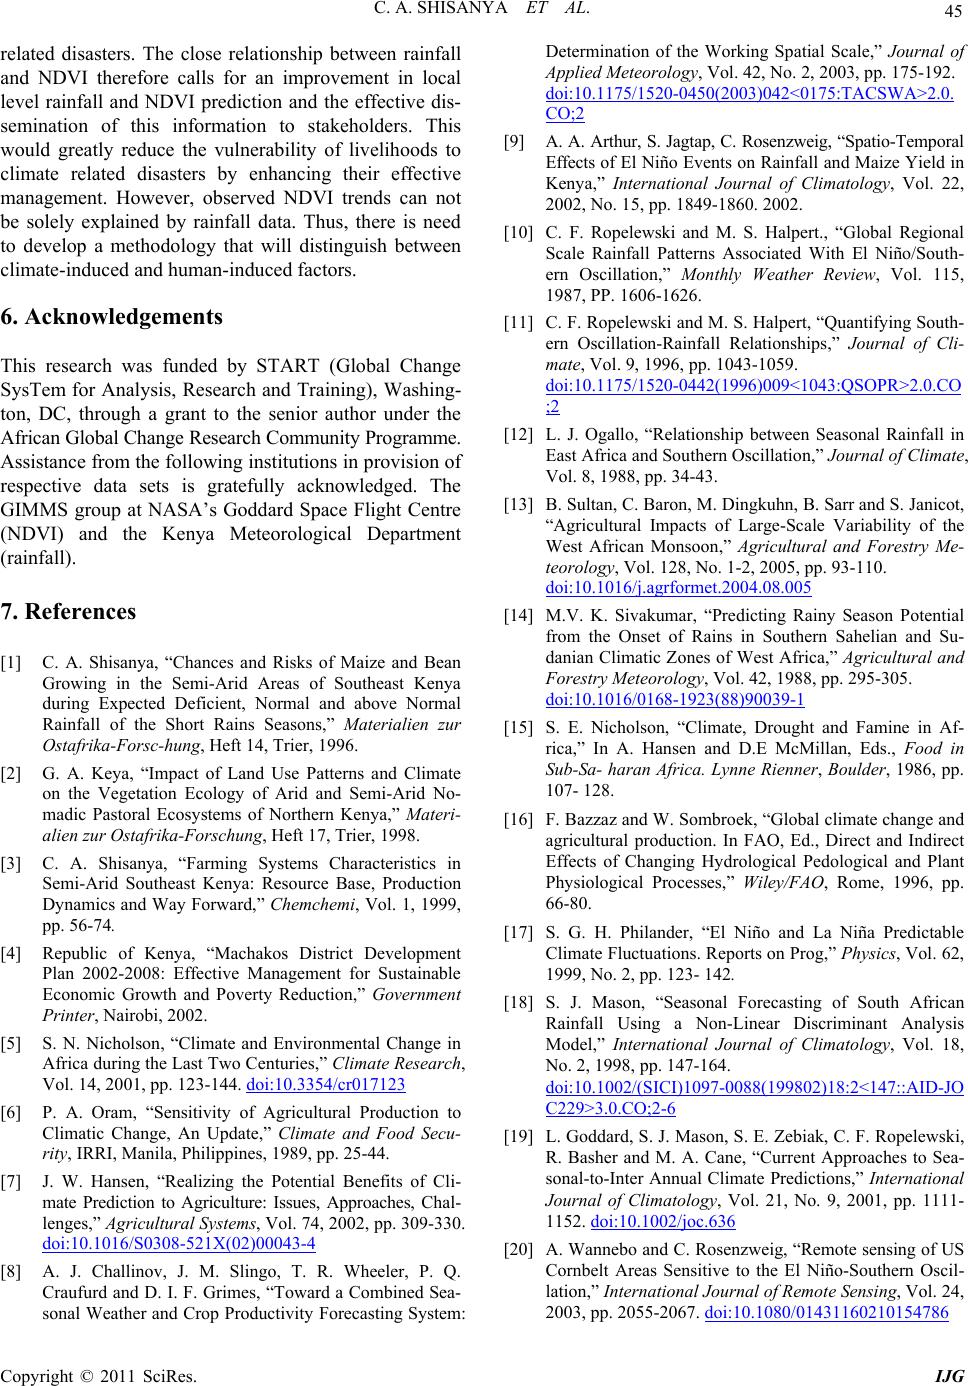 C. A. SHISANYA ET AL. Copyright © 2011 SciRes. IJG 45 related disasters. The close relationship between rainfall and NDVI therefore calls for an improvement in local level rainfall and NDVI prediction and the effective dis- semination of this information to stakeholders. This would greatly reduce the vulnerability of livelihoods to climate related disasters by enhancing their effective management. However, observed NDVI trends can not be solely explained by rainfall data. Thus, there is need to develop a methodology that will distinguish between climate-induced and human-induced factors. 6. Acknowledgements This research was funded by START (Global Change SysTem for Analysis, Research and Training), Washing- ton, DC, through a grant to the senior author under the African Global Change Research Community Programme. Assistance from the following institutions in prov ision of respective data sets is gratefully acknowledged. The GIMMS group at NASA’s Goddard Space Flight Centre (NDVI) and the Kenya Meteorological Department (rainfall). 7. References [1] C. A. Shisanya, “Chances and Risks of Maize and Bean Growing in the Semi-Arid Areas of Southeast Kenya during Expected Deficient, Normal and above Normal Rainfall of the Short Rains Seasons,” Materialien zur Ostafrika-Forsc-hung, Heft 14, Trier, 1996. [2] G. A. Keya, “Impact of Land Use Patterns and Climate on the Vegetation Ecology of Arid and Semi-Arid No- madic Pastoral Ecosystems of Northern Kenya,” Materi- alien zur Ostafrika-Forschung, Heft 17, Trier, 1998. [3] C. A. Shisanya, “Farming Systems Characteristics in Semi-Arid Southeast Kenya: Resource Base, Production Dynamics and Way Forward,” Chemchemi, Vol. 1, 1999, pp. 56-74. [4] Republic of Kenya, “Machakos District Development Plan 2002-2008: Effective Management for Sustainable Economic Growth and Poverty Reduction,” Government Printer, Nairobi, 2002. [5] S. N. Nicholson, “Climate and Environmental Change in Africa during the Last Two Centuries,” Climate Research, Vol. 14, 2001, pp. 123-144. doi:10.3354/cr017123 [6] P. A. Oram, “Sensitivity of Agricultural Production to Climatic Change, An Update,” Climate and Food Secu- rity, IRRI, Manila, Philippines, 1989, pp. 25-44. [7] J. W. Hansen, “Realizing the Potential Benefits of Cli- mate Prediction to Agriculture: Issues, Approaches, Chal- lenges,” Agricultural Systems, Vol. 74, 2002, pp. 309-330. doi:10.1016/S0308-521X(02)00043-4 [8] A. J. Challinov, J. M. Slingo, T. R. Wheeler, P. Q. Craufurd and D. I. F. Grimes, “Toward a Combined Sea- sonal Weather and Crop Productivity Forecasting System: Determination of the Working Spatial Scale,” Journal of Applied Meteorology, Vol. 42, No. 2, 2003, pp. 175-192. doi:10.1175/1520-0450(2003)042<0175:TACSWA>2.0. CO;2 [9] A. A. Arthur, S. Jagtap, C. Rosenz weig, “Spatio-Temporal Effects of El Niño Events on Rainfall and Maize Yield in Kenya,” International Journal of Climatology, Vol. 22, 2002, No. 15, pp. 1849-1860. 2002. [10] C. F. Ropelewski and M. S. Halpert., “Global Regional Scale Rainfall Patterns Associated With El Niño/South- ern Oscillation,” Monthly Weather Review, Vol. 115, 1987, PP. 1606-1626. [11] C. F. Ropelewski and M. S. Halpert, “Quantifying South- ern Oscillation-Rainfall Relationships,” Journal of Cli- mate, Vol. 9, 1996, pp. 1043-1059. doi:10.1175/1520-0442(1996)009<1043:QSOPR>2.0.CO ;2 [12] L. J. Ogallo, “Relationship between Seasonal Rainfall in East Africa and Southern Oscillation,” Journal of Climate, Vol. 8, 1988, pp. 34-43. [13] B. Sultan, C. Baron, M. Dingkuhn, B. Sarr and S. Janicot, “Agricultural Impacts of Large-Scale Variability of the West African Monsoon,” Agricultural and Forestry Me- teorology, Vol. 128, No. 1-2, 2005, pp. 93-110. doi:10.1016/j.agrformet.2004.08.005 [14] M.V. K. Sivakumar, “Predicting Rainy Season Potential from the Onset of Rains in Southern Sahelian and Su- danian Climatic Zones of West Africa,” Agricultural and Forestry Meteorology, Vol. 42, 1988, pp. 295-305. doi:10.1016/0168-1923(88)90039-1 [15] S. E. Nicholson, “Climate, Drought and Famine in Af- rica,” In A. Hansen and D.E McMillan, Eds., Food in Sub-Sa- haran Africa. Lynne Rienner, Boulder, 1986, pp. 107- 128. [16] F. Bazzaz and W. Sombroek, “Global climate change and agricultural production. In FAO, Ed., Direct and Indirect Effects of Changing Hydrological Pedological and Plant Physiological Processes,” Wiley/FAO, Rome, 1996, pp. 66-80. [17] S. G. H. Philander, “El Niño and La Niña Predictable Climate Fluctuations. Reports on Prog,” Physics, Vol. 62, 1999, No. 2, pp. 123- 142. [18] S. J. Mason, “Seasonal Forecasting of South African Rainfall Using a Non-Linear Discriminant Analysis Model,” International Journal of Climatology, Vol. 18, No. 2, 1998, pp. 147-164. doi:10.1002/(SICI)1097-0088(199802)18:2<147::AID-JO C229>3.0.CO;2-6 [19] L. Goddard, S. J. Mason, S. E. Zebiak, C. F. Ropelewski, R. Basher and M. A. Cane, “Current Approaches to Sea- sonal-to-Inter Annual Climate Predictions,” International Journal of Climatology, Vol. 21, No. 9, 2001, pp. 1111- 1152. doi:10.1002/joc.636 [20] A. Wannebo and C. Rosenzweig, “Remote sensing of US Cornbelt Areas Sensitive to the El Niño-Southern Oscil- lation,” International Journal of Remote Sensing, Vol. 24, 2003, pp. 2055-2067. doi:10.1080/01431160210154786 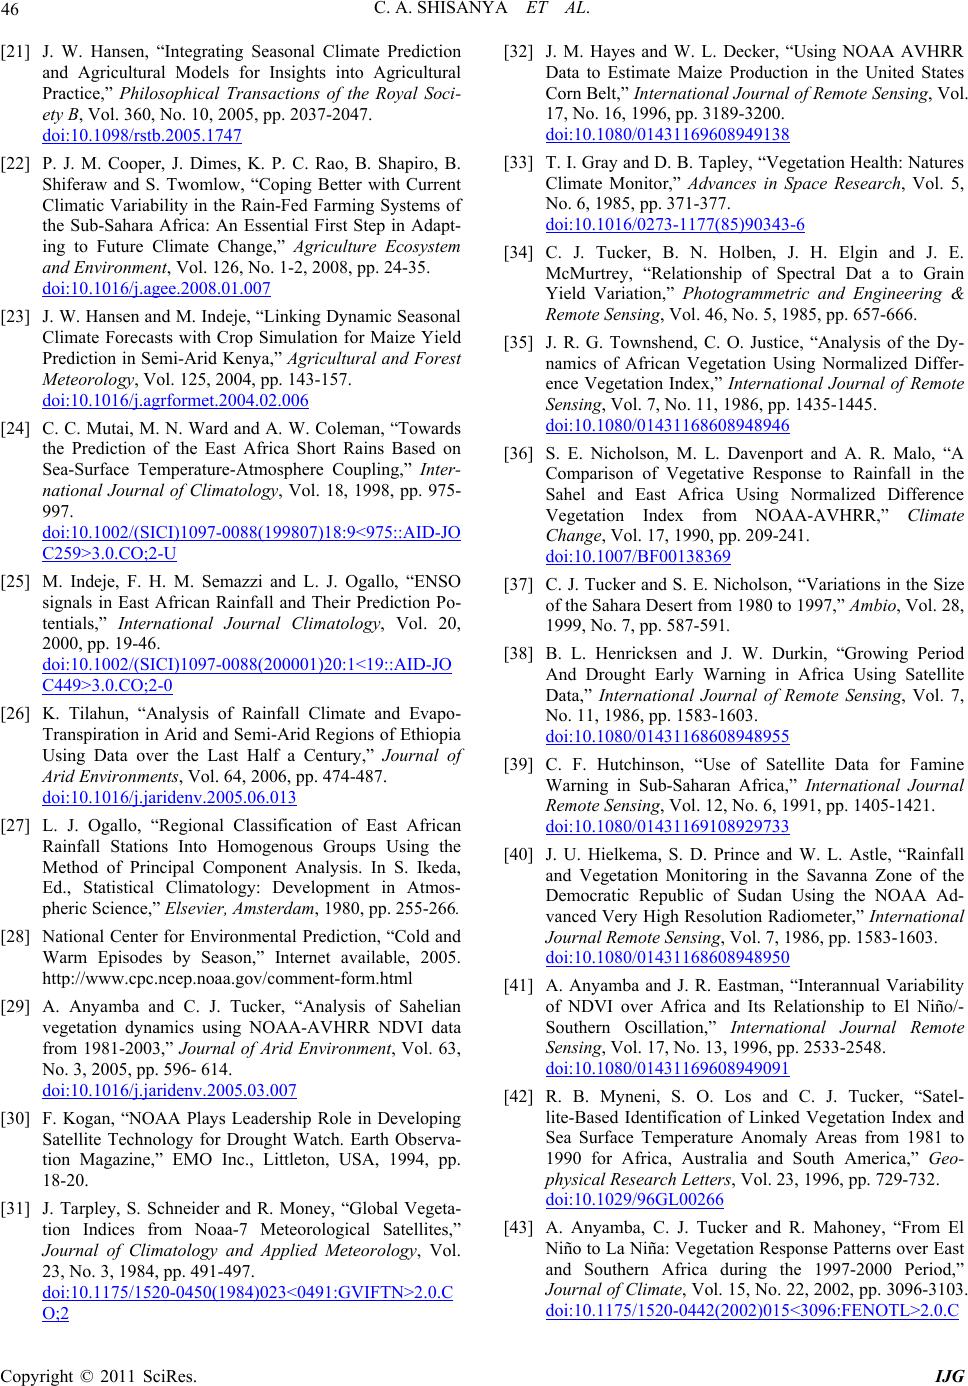 C. A. SHISANYA ET AL. Copyright © 2011 SciRes. IJG 46 [21] J. W. Hansen, “Integrating Seasonal Climate Prediction and Agricultural Models for Insights into Agricultural Practice,” Philosophical Transactions of the Royal Soci- ety B, Vol. 360, No. 10, 2005, pp. 2037-2047. doi:10.1098/rstb.2005.1747 [22] P. J. M. Cooper, J. Dimes, K. P. C. Rao, B. Shapiro, B. Shiferaw and S. Twomlow, “Coping Better with Current Climatic Variability in the Rain-Fed Farming Systems of the Sub-Sahara Africa: An Essential First Step in Adapt- ing to Future Climate Change,” Agriculture Ecosystem and Environment, Vol. 126, No. 1-2, 2008, pp. 24-35. doi:10.1016/j.agee.2008.01.007 [23] J. W. Hansen and M. Indeje, “Linking Dynamic Seasonal Climate Forecasts with Crop Simulation for Maize Yield Prediction in Semi-Arid Kenya,” Agricultural and Forest Meteorology, Vol. 125, 2004, pp. 143-157. doi:10.1016/j.agrformet.2004.02.006 [24] C. C. Mutai, M. N. Ward and A. W. Coleman, “Towards the Prediction of the East Africa Short Rains Based on Sea-Surface Temperature-Atmosphere Coupling,” Inter- national Journal of Climatology, Vol. 18, 1998, pp. 975- 997. doi:10.1002/(SICI)1097-0088(199807)18:9<975::AID-JO C259>3.0.CO;2-U [25] M. Indeje, F. H. M. Semazzi and L. J. Ogallo, “ENSO signals in East African Rainfall and Their Prediction Po- tentials,” International Journal Climatology, Vol. 20, 2000, pp. 19-46. doi:10.1002/(SICI)1097-0088(200001)20:1<19::AID-JO C449>3.0.CO;2-0 [26] K. Tilahun, “Analysis of Rainfall Climate and Evapo- Transpiration in Arid and Semi-Arid Regions of Ethiopia Using Data over the Last Half a Century,” Journal of Arid Environments, Vol. 64, 2006, pp. 474-487. doi:10.1016/j.jaridenv.2005.06.013 [27] L. J. Ogallo, “Regional Classification of East African Rainfall Stations Into Homogenous Groups Using the Method of Principal Component Analysis. In S. Ikeda, Ed., Statistical Climatology: Development in Atmos- pheric Scienc e,” Elsevier, Amsterdam, 1980, pp. 255-266. [28] National Center for Environmental Prediction, “Cold and Warm Episodes by Season,” Internet available, 2005. http://www.cpc.ncep.noaa.gov/comment-form.html [29] A. Anyamba and C. J. Tucker, “Analysis of Sahelian vegetation dynamics using NOAA-AVHRR NDVI data from 1981-2003,” Journal of Arid Environment, Vol. 63, No. 3, 2005, pp. 596- 614. doi:10.1016/j.jaridenv.2005.03.007 [30] F. Kogan, “NOAA Plays Leadership Role in Developing Satellite Technology for Drought Watch. Earth Observa- tion Magazine,” EMO Inc., Littleton, USA, 1994, pp. 18-20. [31] J. Tarpley, S. Schneider and R. Money, “Global Vegeta- tion Indices from Noaa-7 Meteorological Satellites,” Journal of Climatology and Applied Meteorology, Vol. 23, No. 3, 1984, pp. 491-497. doi:10.1175/1520-0450(1984)023<0491:GVIFTN>2.0.C O;2 [32] J. M. Hayes and W. L. Decker, “Using NOAA AVHRR Data to Estimate Maize Production in the United States Corn Belt,” International Journal of Remote Sensing, Vol. 17, No. 16, 1996, pp. 3189-3200. doi:10.1080/01431169608949138 [33] T. I. Gray a nd D. B. Tapley, “Vege tation Health: Nat ures Climate Monitor,” Advances in Space Research, Vol. 5, No. 6, 1985, pp. 371-377. doi:10.1016/0273-1177(85)90343-6 [34] C. J. Tucker, B. N. Holben, J. H. Elgin and J. E. McMurtrey, “Relationship of Spectral Dat a to Grain Yield Variation,” Photogrammetric and Engineering & Remote Sensing, Vol. 46, No. 5, 1985, pp. 657-666. [35] J. R. G. Townshend, C. O. Justice, “Analysis of the Dy- namics of African Vegetation Using Normalized Differ- ence Vegetation Index,” International Journal of Remote Sensing, Vol. 7, No. 11, 1986, pp. 1435-1445. doi:10.1080/01431168608948946 [36] S. E. Nicholson, M. L. Davenport and A. R. Malo, “A Comparison of Vegetative Response to Rainfall in the Sahel and East Africa Using Normalized Difference Vegetation Index from NOAA-AVHRR,” Climate Change, Vol. 17, 1990, pp. 209-241. doi:10.1007/BF00138369 [37] C. J. Tucker and S. E. Nicholson, “Variations in the Size of the Sahara Desert from 1980 to 1997,” Ambio, Vol. 28, 1999, No. 7, pp. 587-591. [38] B. L. Henricksen and J. W. Durkin, “Growing Period And Drought Early Warning in Africa Using Satellite Data,” International Journal of Remote Sensing, Vol. 7, No. 11, 1986, pp. 1583-1603. doi:10.1080/01431168608948955 [39] C. F. Hutchinson, “Use of Satellite Data for Famine Warning in Sub-Saharan Africa,” International Journal Remote Sensing, Vol. 12, No. 6, 1991, pp. 1405-1421. doi:10.1080/01431169108929733 [40] J. U. Hielkema, S. D. Prince and W. L. Astle, “Rainfall and Vegetation Monitoring in the Savanna Zone of the Democratic Republic of Sudan Using the NOAA Ad- vanced Very High Resolution Radiometer,” International Journal Remote Sensing, Vol. 7, 1986, pp. 1583-1603. doi:10.1080/01431168608948950 [41] A. Anyamba and J. R. Eastman, “Interannual Variability of NDVI over Africa and Its Relationship to El Niño/- Southern Oscillation,” International Journal Remote Sensing, Vol. 17, No. 13, 1996, pp. 2533-2548. doi:10.1080/01431169608949091 [42] R. B. Myneni, S. O. Los and C. J. Tucker, “Satel- lite-Based Identification of Linked Vegetation Index and Sea Surface Temperature Anomaly Areas from 1981 to 1990 for Africa, Australia and South America,” Geo- physical Research Letters, Vol. 23, 1996, pp. 729-732. doi:10.1029/96GL00266 [43] A. Anyamba, C. J. Tucker and R. Mahoney, “From El Niño to La Niña: Vegetation Response Patterns over East and Southern Africa during the 1997-2000 Period,” Journal of Climate, Vol. 15, No. 22, 2002, pp. 3096-3103. doi:10.1175/1520-0442(2002)015<3096:FENOTL>2.0.C  C. A. SHISANYA ET AL. Copyright © 2011 SciRes. IJG 47 O;2 [44] R. R. Nemani, C. D. Keeling, H. Hashimoto, W. M. Jolly, S. C. Piper, C. J. Tucker, R. B. Myneni and S. W. Run- ning, “Climate-Driven Increasesin Global Terrestrial Net Primary Production from 1982 to 1999,” Science, Vol. 300, 2003, pp. 1560-1563. doi:10.1126/science.1082750 [45] L. Eklund and L. Olsson, “Vegetation Index Trends for the African Sahel 1982-1999,” Geophysical Research Letters, Vol. 30, No. 5625, 2003, p. 1430. doi:10.1029/2002GL016772 [46] D. A. Slayback, J. E. Pinzon, S. O. Los and C. J. Tucker, “Northern Hemisphere Photosynthetic Trends 1982- 1999,” Global Change Biology, Vol. 9, 2003, pp. 1-15. doi:10.1046/j.1365-2486.2003.00507.x [47] R. Jaetzold, H. Schmidt, B. Hornetz and Shisanya C. A. Eds., “Farm Management Handbook of Kenya, Vol. II/C: East Kenya: Natural Conditions and Farm Management Inf o r m a t i on, ” Mini str y o f Agri c u l t u r e / GTZ , N a irob i , 2007. [48] J. Phillips and P. McIntyre, “ENSO and Inter Annual Rainfall Variability in Uganda: Implications for Agricul- tural Management. International,” Journal of Climatology, Vol. 20, 2000, pp. 171-182. doi:10.1002/(SICI)1097-0088(200002)20:2<171::AID-JO C471>3.0.CO;2-O [49] A. Patt and C. Gwata, “Effective Seasonal Climate Fore- cast Applications: Examining Constraints for Subsistence farmers in Zimbabwe,” Global Environmental Change, Vol. 12, 2002, pp. 185-195. doi:10.1016/S0959-3780(02)00013-4 [50] C. A. Shisanya, “The 1983-1984 Drought in Kenya,” Journal of Eastern African Research & Development, Vol. 20, 1990, pp. 127-148. [51] C. F. Hutchinson, “The Sahelian Desertification Debate: A View from the American South-West,” Journal of Arid Environment, Vol. 33, No. 4, 1996, pp. 519-524. doi:10.1006/jare.1996.0087 [52] S. Odingo, W. Nyakwada and J. K. Njihia, “Weather and Climate Sector,” In IGAD and DMCN, Factoring of weather and climate information and products into dis- aster management policy: A contribution to strategies for disaster management, Nairobi, Kenya, 2002, pp. 1-33. [53] C. Tottrup, and M. S. Rasmussen, “Mapping Long-Term Changes in Savannah Crop Productivity in Senegal through Trend Analysis of Time Series of Remote Sens- ing Data,” Agriculture, Ecosystem and Environment, Vol. 103, No. 3, 2004, pp. 545-560. doi:10.1016/j.agee.2003.11.009 [54] A. K. Thiam, “The Causes and Spatial Patterns of Land Degradation Risk in Southern Mauritania using Multi- Temporal AVHRR NDVI Imagery and Field Data,” Land Degradation and Development, Vol. 14, 2003, pp. 133- 142. doi:10.1002/ldr.533 [55] A. Anyamba, C. J Tucker and J. R. Eastman, “NDVI Anomaly Pattern over Africa during the 1997/98 ENSO Warm Event,” International. Journal of Remote Sensing, Vol. 24, No. 10, 2001, pp. 2055-2067. [56] G. Wang and L. You, “Delayed Impact of the North At- lantic Oscillation on Biosphere Productivity in Asia,” Geophysical Research Letters, Vol. 31, No. 1-4, 2004. [57] C. C. Funk and M. E. Brown, “Intra-Seasonal Ndvi Change Projection in Semi-Arid Africa,” Remote Sensing of Environment, Vol. 101, 2006, pp. 249-256. doi:10.1016/j.rse.2005.12.014 [58] W. Nyakwada, “Predictability of Seasonal Rainfall over Eastern Africa (DMC Climate Fora),” 1999. [59] Y. Seleshi and U. Zanke, “Recent Changes in Rainfall and Rainy Days in Ethiopia,” International Journal of Climatology, Vol. 24, No. 8, 2004, pp. 973-983. doi:10.1002/joc.1052
|