Paper Menu >>
Journal Menu >>
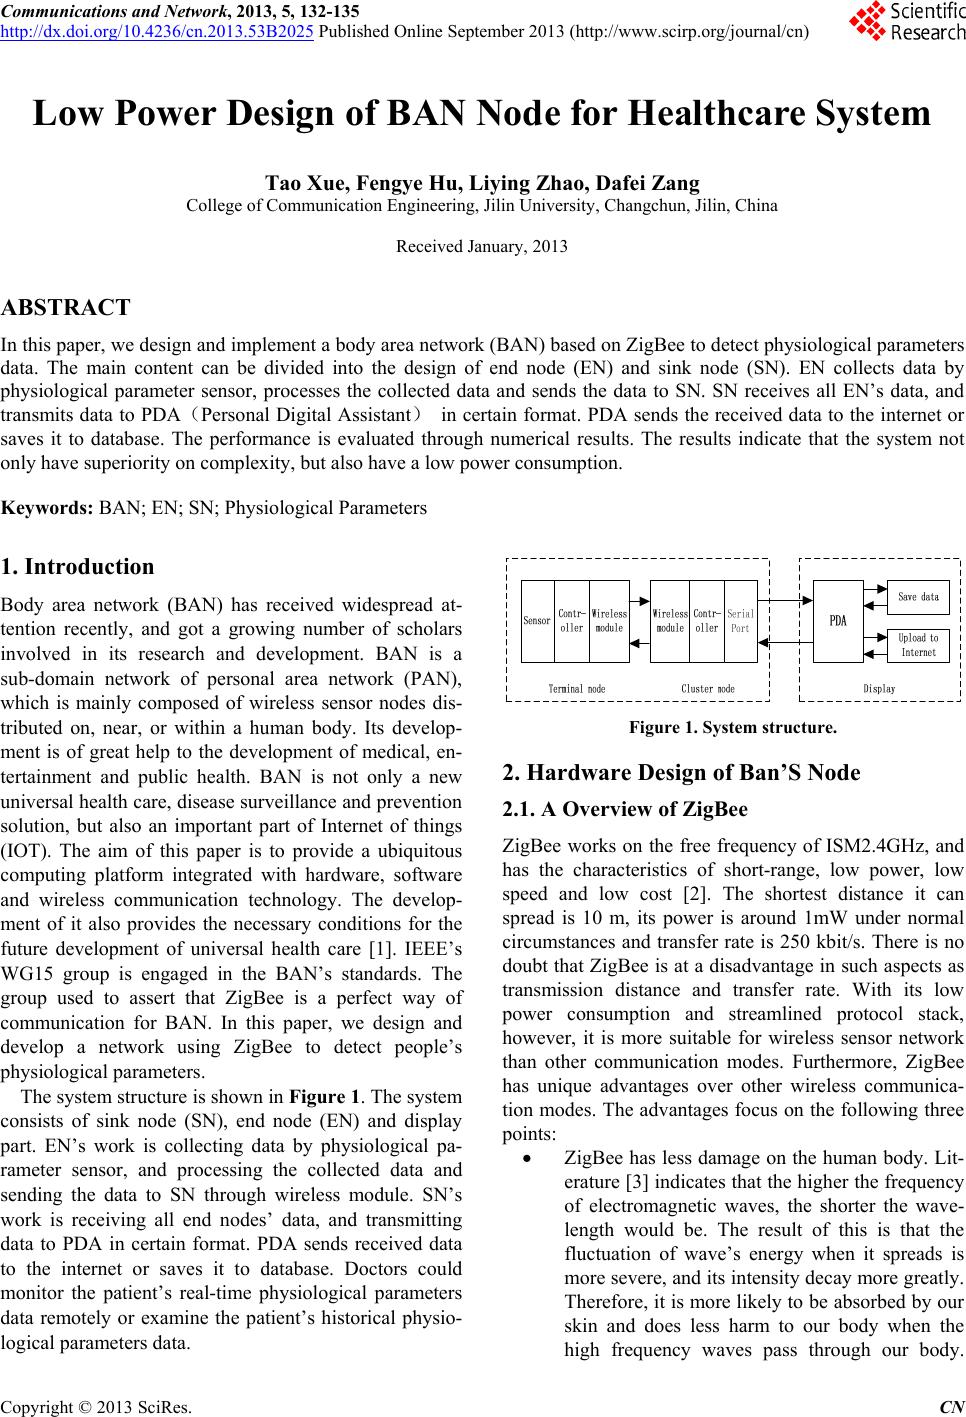 Communications and Network, 2013, 5, 132-135 http://dx.doi.org/10.4236/cn.2013.53B2025 Published Online September 2013 (http://www.scirp.org/journal/cn) Low Power Design of BAN Node for Healthcare System Tao Xue, Fengye Hu, Liying Zhao, Dafei Zang College of Communication Engineering, Jilin University, Changchun, Jilin, China Received January, 2013 ABSTRACT In this paper, we design and implement a body area network (BAN) based on ZigBee to detect physiological parameters data. The main content can be divided into the design of end node (EN) and sink node (SN). EN collects data by physiological parameter sensor, processes the collected data and sends the data to SN. SN receives all EN’s data, and transmits data to PDA(Personal Digital Assistan t) in certain format. PDA sends the received data to the internet or saves it to database. The performance is evaluated through numerical results. The results indicate that the system not only have superiority on complexity, but also have a low power consumption. Keywords: BAN; EN; SN; Physiological Parameters 1. Introduction Body area network (BAN) has received widespread at- tention recently, and got a growing number of scholars involved in its research and development. BAN is a sub-domain network of personal area network (PAN), which is mainly composed of wireless sensor nodes dis- tributed on, near, or within a human body. Its develop- ment is of great help to the development of medical, en- tertainment and public health. BAN is not only a new universal health care, disease surveillance and preven tion solution, but also an important part of Internet of things (IOT). The aim of this paper is to provide a ubiquitous computing platform integrated with hardware, software and wireless communication technology. The develop- ment of it also provides the necessary conditions for the future development of universal health care [1]. IEEE’s WG15 group is engaged in the BAN’s standards. The group used to assert that ZigBee is a perfect way of communication for BAN. In this paper, we design and develop a network using ZigBee to detect people’s physiological parameters. The system structure is shown in Figure 1. The system consists of sink node (SN), end node (EN) and display part. EN’s work is collecting data by physiological pa- rameter sensor, and processing the collected data and sending the data to SN through wireless module. SN’s work is receiving all end nodes’ data, and transmitting data to PDA in certain format. PDA sends received data to the internet or saves it to database. Doctors could monitor the patient’s real-time physiological parameters data remotely or examine the patient’s historical physio- logical parameters data. Figure 1. System structure. 2. Hardware Design of Ban’S Node 2.1. A Overview of ZigBee ZigBee works on the free frequency of ISM2.4GHz, and has the characteristics of short-range, low power, low speed and low cost [2]. The shortest distance it can spread is 10 m, its power is around 1mW under normal circumstances and transfer rate is 250 kbit/s. There is no doubt that ZigBee is at a disadvantage in such aspects as transmission distance and transfer rate. With its low power consumption and streamlined protocol stack, however, it is more suitable for wireless sensor network than other communication modes. Furthermore, ZigBee has unique advantages over other wireless communica- tion modes. The advantages focus on the following three points: ZigBee has less damage on the human body. Lit- erature [3] indicates that the higher the frequency of electromagnetic waves, the shorter the wave- length would be. The result of this is that the fluctuation of wave’s energy when it spreads is more severe, and its intensity decay more greatly. Therefore, it is more likely to b e absorbed by our skin and does less harm to our body when the high frequency waves pass through our body. C opyright © 2013 SciRes. CN 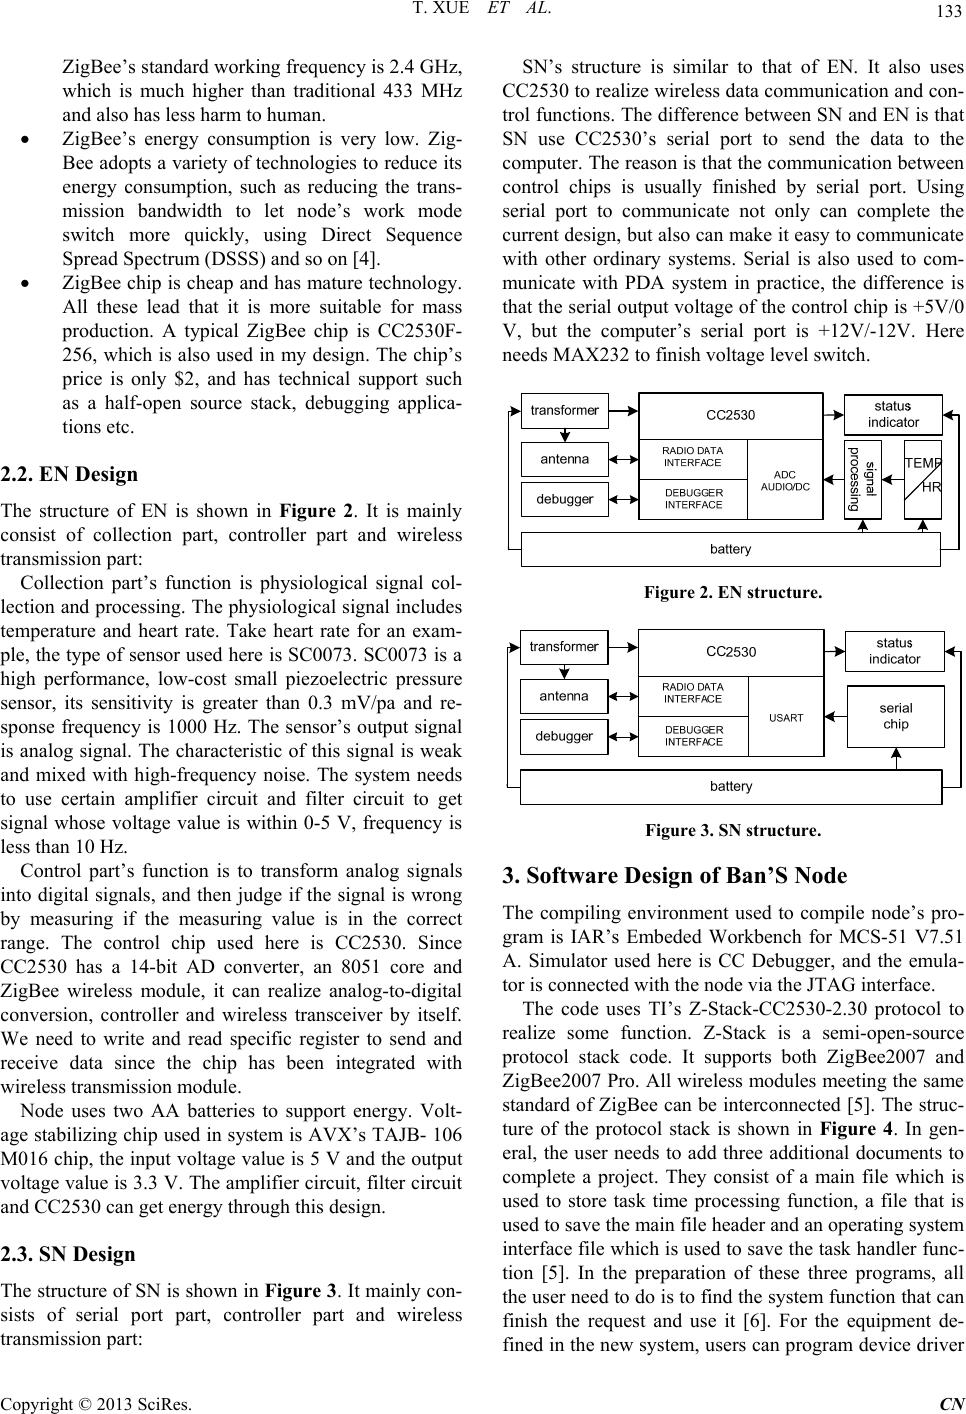 T. XUE ET AL. 133 ZigBee’s standard working frequency is 2.4 GHz, which is much higher than traditional 433 MHz and also has less harm to human. ZigBee’s energy consumption is very low. Zig- Bee adopts a variety of technologies to reduce its energy consumption, such as reducing the trans- mission bandwidth to let node’s work mode switch more quickly, using Direct Sequence Spread Spectrum (DSSS) and s o o n [4 ] . ZigBee chip is cheap and has mature technology. All these lead that it is more suitable for mass production. A typical ZigBee chip is CC2530F- 256, which is also used in my design. The chip’s price is only $2, and has technical support such as a half-open source stack, debugging applica- tions etc. 2.2. EN Design The structure of EN is shown in Figure 2. It is mainly consist of collection part, controller part and wireless transmission part: Collection part’s function is physiological signal col- lection and processing. The physiological signal includes temperature and heart rate. Take heart rate for an exam- ple, the type of sensor used here is SC0073. SC0073 is a high performance, low-cost small piezoelectric pressure sensor, its sensitivity is greater than 0.3 mV/pa and re- sponse frequency is 1000 Hz. The sensor’s output signal is analog signal. The characteristic of this signal is weak and mixed with high-frequency noise. The system needs to use certain amplifier circuit and filter circuit to get signal whose voltage value is within 0-5 V, frequency is less than 10 Hz. Control part’s function is to transform analog signals into digital signals, and then judge if the signal is wrong by measuring if the measuring value is in the correct range. The control chip used here is CC2530. Since CC2530 has a 14-bit AD converter, an 8051 core and ZigBee wireless module, it can realize analog-to-digital conversion, controller and wireless transceiver by itself. We need to write and read specific register to send and receive data since the chip has been integrated with wireless transmission module. Node uses two AA batteries to support energy. Volt- age stabilizing chip used in syste m is AVX’s TAJB- 106 M016 chip, the input vo ltage value is 5 V and the output voltage value is 3.3 V. The amplifier circuit, filter circuit and CC2530 can get energy through this design. 2.3. SN Design The struc ture of SN is shown in Figure 3. It mainly con- sists of serial port part, controller part and wireless transmission part: SN’s structure is similar to that of EN. It also uses CC2530 to realize wireless data communication and con- trol functions. The difference between SN and EN is that SN use CC2530’s serial port to send the data to the computer. The reason is that the communication between control chips is usually finished by serial port. Using serial port to communicate not only can complete the current design, but also can make it easy to communicate with other ordinary systems. Serial is also used to com- municate with PDA system in practice, the difference is that the serial output voltage of the control chip is +5V/0 V, but the computer’s serial port is +12V/-12V. Here needs MAX232 to finish voltage level switch. Figure 2. EN structure. Figure 3. SN structure. 3. Software Design of Ban’S Node The compiling environment used to compile node’s pro- gram is IAR’s Embeded Workbench for MCS-51 V7.51 A. Simulator used here is CC Debugger, and the emula- tor is connected with the node via the JTAG in terface. The code uses TI’s Z-Stack-CC2530-2.30 protocol to realize some function. Z-Stack is a semi-open-source protocol stack code. It supports both ZigBee2007 and ZigBee2007 Pro. All wireless modules meeting the same standard of ZigBee can be interconnected [5]. The struc- ture of the protocol stack is shown in Figure 4. In gen- eral, the user needs to add three additional documents to complete a project. They consist of a main file which is used to store task time processing function, a file that is used to save the main file header and an op erating system interface file which is used to save the task handler func- tion [5]. In the preparation of these three programs, all the user need to do is to find the system function that can finish the request and use it [6]. For the equipment de- fined in the new system, users can program device driver Copyright © 2013 SciRes. CN 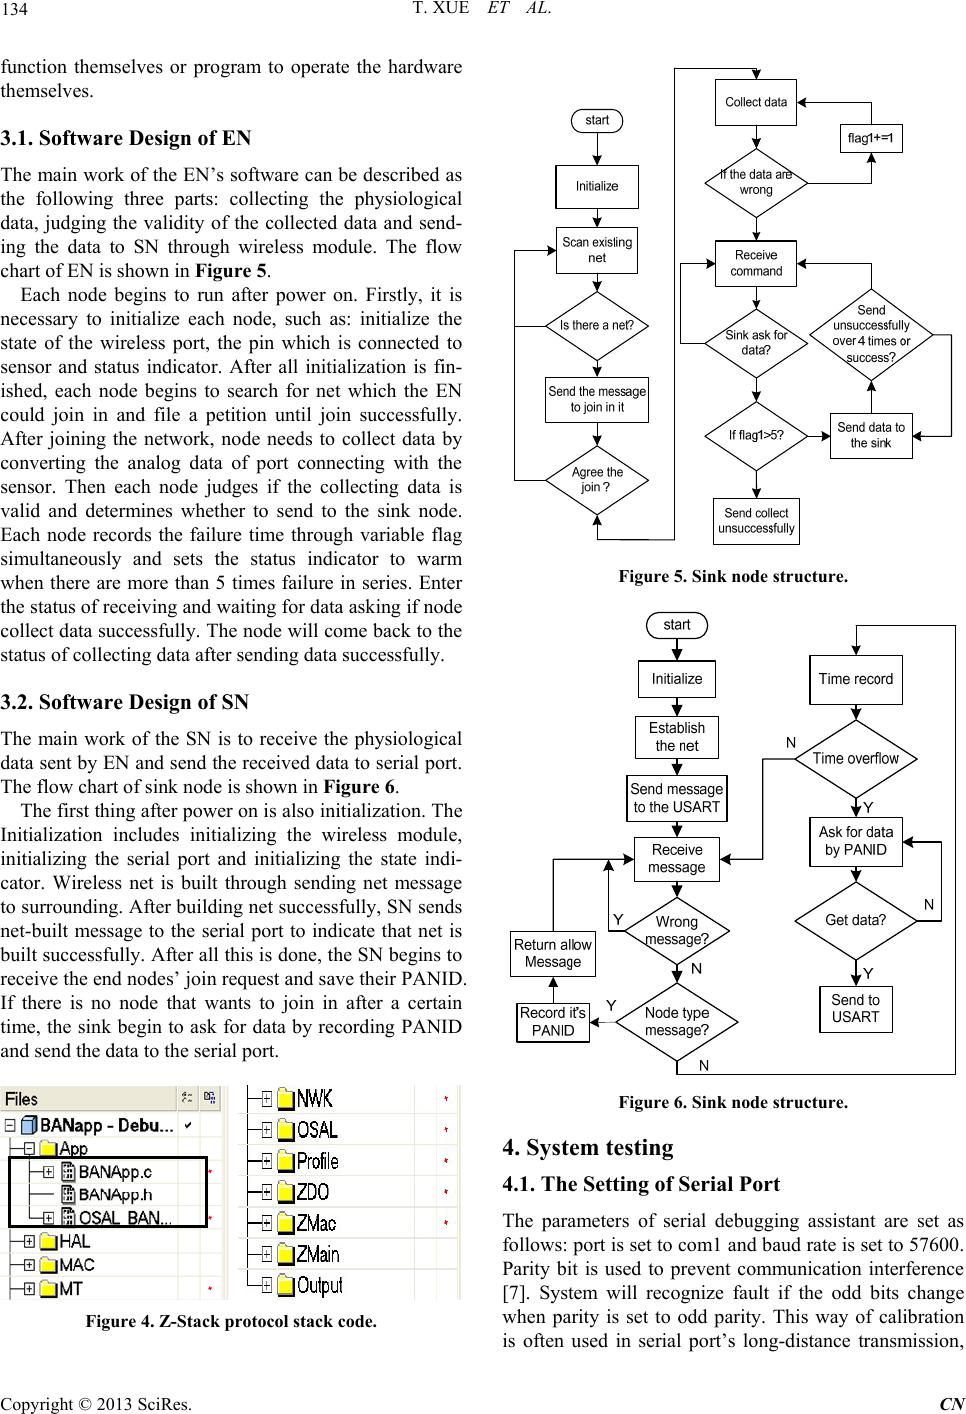 T. XUE ET AL. 134 function themselves or program to operate the hardware themselves. 3.1. Software Design of EN The main work of the EN’s software can be described as the following three parts: collecting the physiological data, judging the validity of the collected data and send- ing the data to SN through wireless module. The flow chart of EN is shown in Figure 5. Each node begins to run after power on. Firstly, it is necessary to initialize each node, such as: initialize the state of the wireless port, the pin which is connected to sensor and status indicator. After all initialization is fin- ished, each node begins to search for net which the EN could join in and file a petition until join successfully. After joining the network, node needs to collect data by converting the analog data of port connecting with the sensor. Then each node judges if the collecting data is valid and determines whether to send to the sink node. Each node records the failure time through variable flag simultaneously and sets the status indicator to warm when there are more than 5 times failure in series. Enter the status of receiving and waiting for data asking if node collect data successfully. The no de will come back to the status of collecting data after sending data successfully. 3.2. Software Design of SN The main work of the SN is to receive the physiological data sent by EN and send the received data to serial port. The flow chart of sink no de is sho w n in Figure 6. The first thing after power on is also initialization . The Initialization includes initializing the wireless module, initializing the serial port and initializing the state indi- cator. Wireless net is built through sending net message to surrounding. After building net successfully, SN sends net-built message to the serial port to indicate that net is built successfully. After all this is done, the SN begins to receive the end nodes’ join request and save their PANID. If there is no node that wants to join in after a certain time, the sink begin to ask for data by recording PANID and send the data to the serial port. Figure 4. Z-Stack protocol stack code. Figure 5. Sink node structure. Figure 6. Sink node structure. 4. System testing 4.1. The Setting of Serial Port The parameters of serial debugging assistant are set as follows: port is set to com1 and baud rate is set to 57600. Parity bit is used to prevent communication interference [7]. System will recognize fault if the odd bits change when parity is set to odd parity. This way of calibration is often used in serial port’s long-distance transmission, Copyright © 2013 SciRes. CN 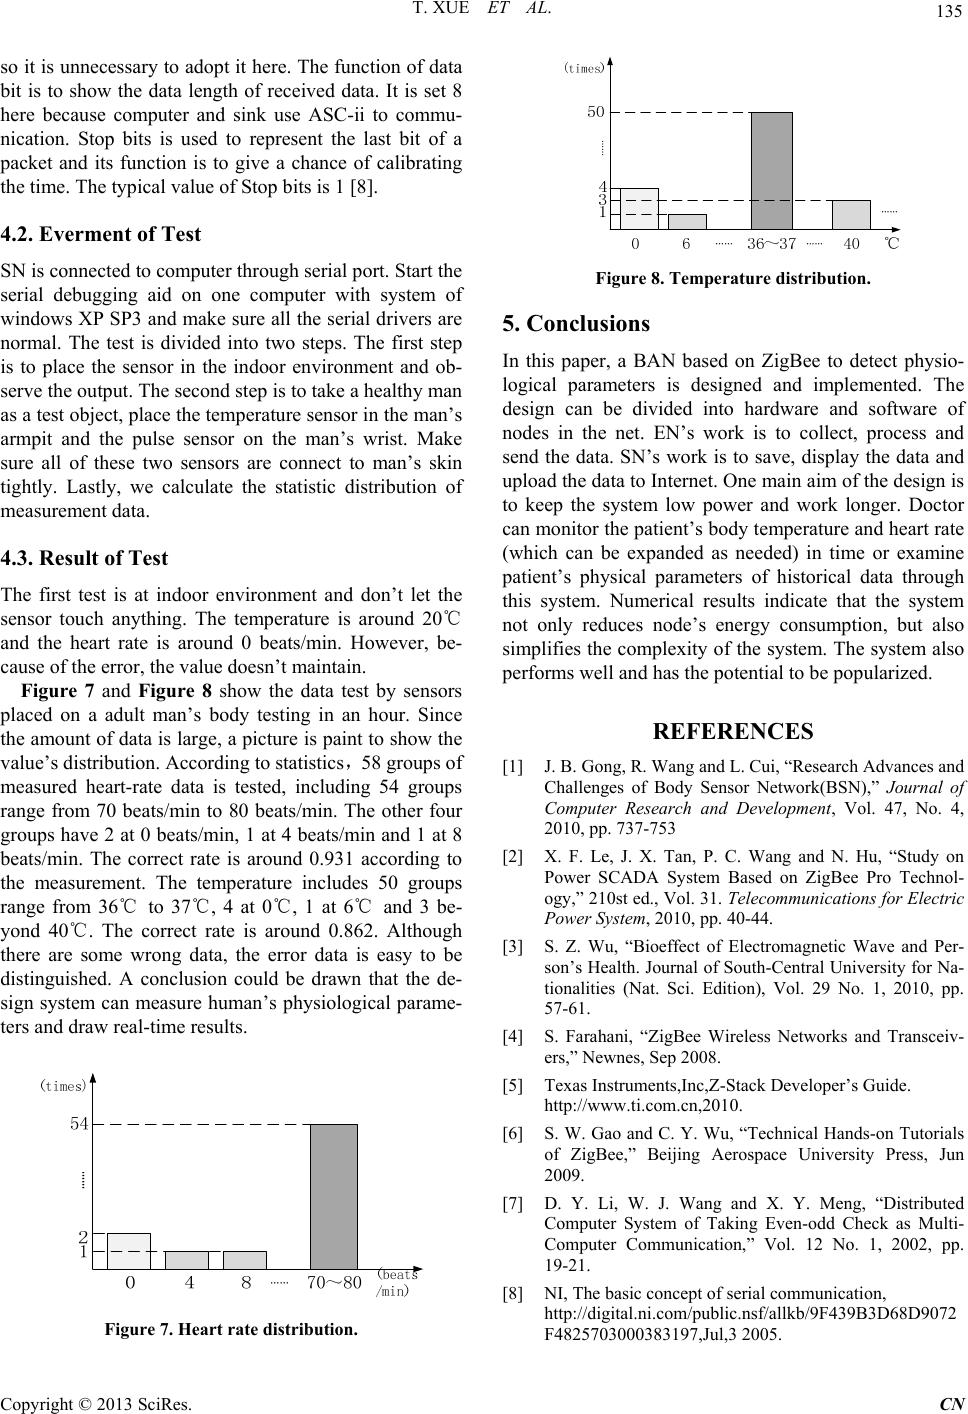 T. XUE ET AL. Copyright © 2013 SciRes. CN 135 so it is unnecessary to adopt it here. The function of data bit is to show the data length of received data. It is set 8 here because computer and sink use ASC-ii to commu- nication. Stop bits is used to represent the last bit of a packet and its function is to give a chance of calibrating the time. The typical value of Stop bits is 1 [8]. …… 4.2. Everment of Test SN is connected to computer through serial port. Start the serial debugging aid on one computer with system of windows XP SP3 and make sure all the serial drivers are normal. The test is divided into two steps. The first step is to place the sensor in the indoor environment and ob- serve the output. The second step is to take a healthy man as a test object, place the temperature sensor in the man’s armpit and the pulse sensor on the man’s wrist. Make sure all of these two sensors are connect to man’s skin tightly. Lastly, we calculate the statistic distribution of measurement data. Figure 8. Temperature distribution. 5. Conclusions In this paper, a BAN based on ZigBee to detect physio- logical parameters is designed and implemented. The design can be divided into hardware and software of nodes in the net. EN’s work is to collect, process and send the data. SN’s work is to save, display the data and upload the data to Internet. One main aim of the design is to keep the system low power and work longer. Doctor can monitor the patient’s body temperature and heart rate (which can be expanded as needed) in time or examine patient’s physical parameters of historical data through this system. Numerical results indicate that the system not only reduces node’s energy consumption, but also simplifies the complexity of the system. The system also performs well and has the potential to be popu larized. 4.3. Result of Test The first test is at indoor environment and don’t let the sensor touch anything. The temperature is around 20℃ and the heart rate is around 0 beats/min. However, be- cause of the error, the value doesn ’t maintain. Figure 7 and Figure 8 show the data test by sensors placed on a adult man’s body testing in an hour. Since the amount of data is large, a picture is paint to show the value’s distribution. According to statistics,58 groups of measured heart-rate data is tested, including 54 groups range from 70 beats/min to 80 beats/min. The other four groups have 2 at 0 beats/min, 1 at 4 beats/min and 1 at 8 beats/min. The correct rate is around 0.931 according to the measurement. The temperature includes 50 groups range from 36℃ to 37℃, 4 at 0℃, 1 at 6℃ and 3 be- yond 40℃. The correct rate is around 0.862. Although there are some wrong data, the error data is easy to be distinguished. A conclusion could be drawn that the de- sign system can measure human’s physiological parame- ters and draw real-time results. REFERENCES [1] J. B. Gong, R. Wang and L. Cui, “Research Advances and Challenges of Body Sensor Network(BSN),” Journal of Computer Research and Development, Vol. 47, No. 4, 2010, pp. 737-753 [2] X. F. Le, J. X. Tan, P. C. Wang and N. Hu, “Study on Power SCADA System Based on ZigBee Pro Technol- ogy,” 210st ed., Vol. 31. Telecommunications for Electric Power System, 2010, pp. 40-44. [3] S. Z. Wu, “Bioeffect of Electromagnetic Wave and Per- son’s Health. Journal of South-Central University for Na- tionalities (Nat. Sci. Edition), Vol. 29 No. 1, 2010, pp. 57-61. [4] S. Farahani, “ZigBee Wireless Networks and Transceiv- ers,” Newnes, Sep 2008. [5] Texas Instruments,Inc,Z-Stack Developer’s Guide. http://www.ti.com.cn,2010. [6] S. W. Gao and C. Y. Wu, “Technical Hands-on Tutorials of ZigBee,” Beijing Aerospace University Press, Jun 2009. [7] D. Y. Li, W. J. Wang and X. Y. Meng, “Distributed Computer System of Taking Even-odd Check as Multi- Computer Communication,” Vol. 12 No. 1, 2002, pp. 19-21. [8] NI, The basic concept of serial communication, http://digital.ni.com/public.nsf/allkb/9F439B3D68D9072 F4825703000383197,Jul,3 2005. Figure 7. Heart ra te distr ibution. |