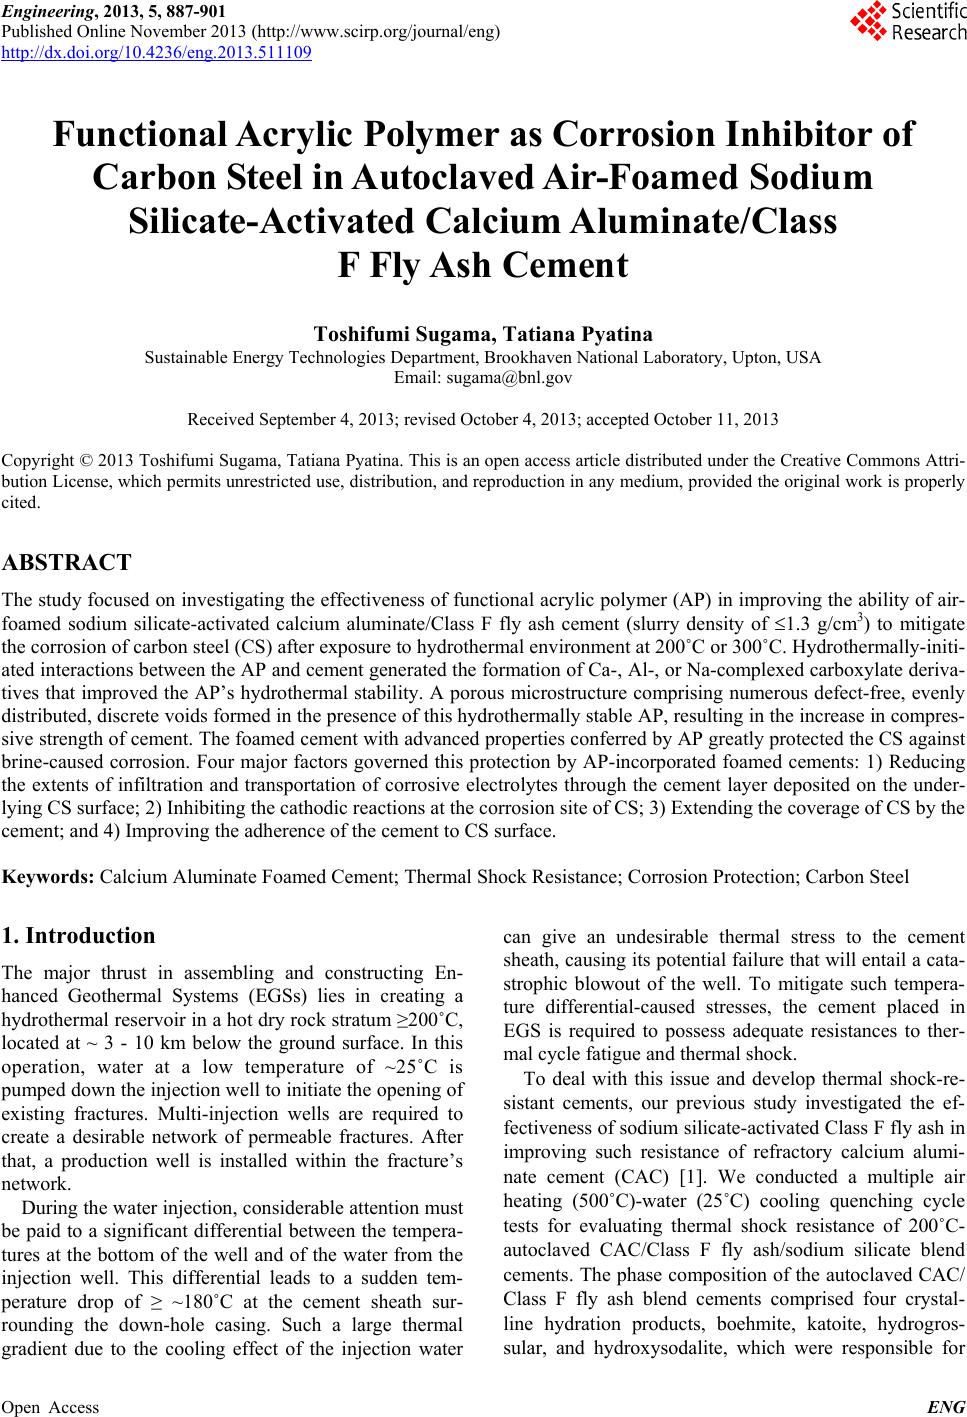
 Engineering, 2013, 5, 887-901 Published Online November 2013 (http://www.scirp.org/journal/eng) http://dx.doi.org/10.4236/eng.2013.511109 Open Access ENG Functional Acrylic Polymer as Corrosion Inhibitor of Carbon Steel in Autoclaved Air-Foamed Sodium Silicate-Activated Calcium Aluminate/Class F Fly Ash Cement Toshifumi Sugama, Tatiana Pyatina Sustainable Energy Technologies Department, Brookhaven National Laboratory, Upton, USA Email: sugama@bnl.gov Received September 4, 2013; revised October 4, 2013; accepted October 11, 2013 Copyright © 2013 Toshifumi Sugama, Tatiana Pyatina. This is an open access article distributed under the Creative Commons Attri- bution License, which permits unrestricted use, distribution, and reproduction in any medium, provided the original work is properly cited. ABSTRACT The study focused on investigating the effectiveness of functional acrylic polymer (AP) in improving the ability of air- foamed sodium silicate-activated calcium aluminate/Class F fly ash cement (slurry density of 1.3 g/cm3) to mitigate the corrosion of carbon steel (CS) after exposure to hydrothermal environment at 200˚C or 300˚C. Hydrothermally-initi- ated interactions between the AP and cement generated the formation of Ca-, Al-, or Na-complexed carboxylate deriva- tives that improved the AP’s hydrothermal stability. A porous microstructure comprising numerous defect-free, evenly distributed, discrete voids formed in the presence of this hydrothermally stable AP, resulting in the increase in compres- sive strength of cement. The foamed cement with advanced properties conferred by AP greatly protected the CS against brine-caused corrosion. Four major factors governed this protection by AP-incorporated foamed cements: 1) Reducing the extents of infiltration and transportation of corrosive electrolytes through the cement layer deposited on the under- lying CS surface; 2) Inhibiting the cathodic reactions at the corrosion site of CS; 3) Extending the coverage of CS by the cement; and 4) Improving the adherence of the cement to CS surface. Keywords: Calcium Aluminate Foamed Cement; Thermal Shock Resistance; Corrosion Protection; Carbon Steel 1. Introduction The major thrust in assembling and constructing En- hanced Geothermal Systems (EGSs) lies in creating a hydrothermal reservoir in a hot dry rock stratum ≥200˚C, located at ~ 3 - 10 km below the ground surface. In this operation, water at a low temperature of ~25˚C is pumped down the injection well to initiate the opening of existing fractures. Multi-injection wells are required to create a desirable network of permeable fractures. After that, a production well is installed within the fracture’s network. During the water injection, considerable attention must be paid to a significant differential between the tempera- tures at the bottom of the well and of the water from the injection well. This differential leads to a sudden tem- perature drop of ≥ ~180˚C at the cement sheath sur- rounding the down-hole casing. Such a large thermal gradient due to the cooling effect of the injection water can give an undesirable thermal stress to the cement sheath, causing its potential failure that will entail a cata- strophic blowout of the well. To mitigate such tempera- ture differential-caused stresses, the cement placed in EGS is required to possess adequate resistances to ther- mal cycle fatigue and thermal shock. To deal with this issue and develop thermal shock-re- sistant cements, our previous study investigated the ef- fectiveness of sodium silicate-activated Class F fly ash in improving such resistance of refractory calcium alumi- nate cement (CAC) [1]. We conducted a multiple air heating (500˚C)-water (25˚C) cooling quenching cycle tests for evaluating thermal shock resistance of 200˚C- autoclaved CAC/Class F fly ash/sodium silicate blend cements. The phase composition of the autoclaved CAC/ Class F fly ash blend cements comprised four crystal- line hydration products, boehmite, katoite, hydrogros- sular, and hydroxysodalite, which were responsible for 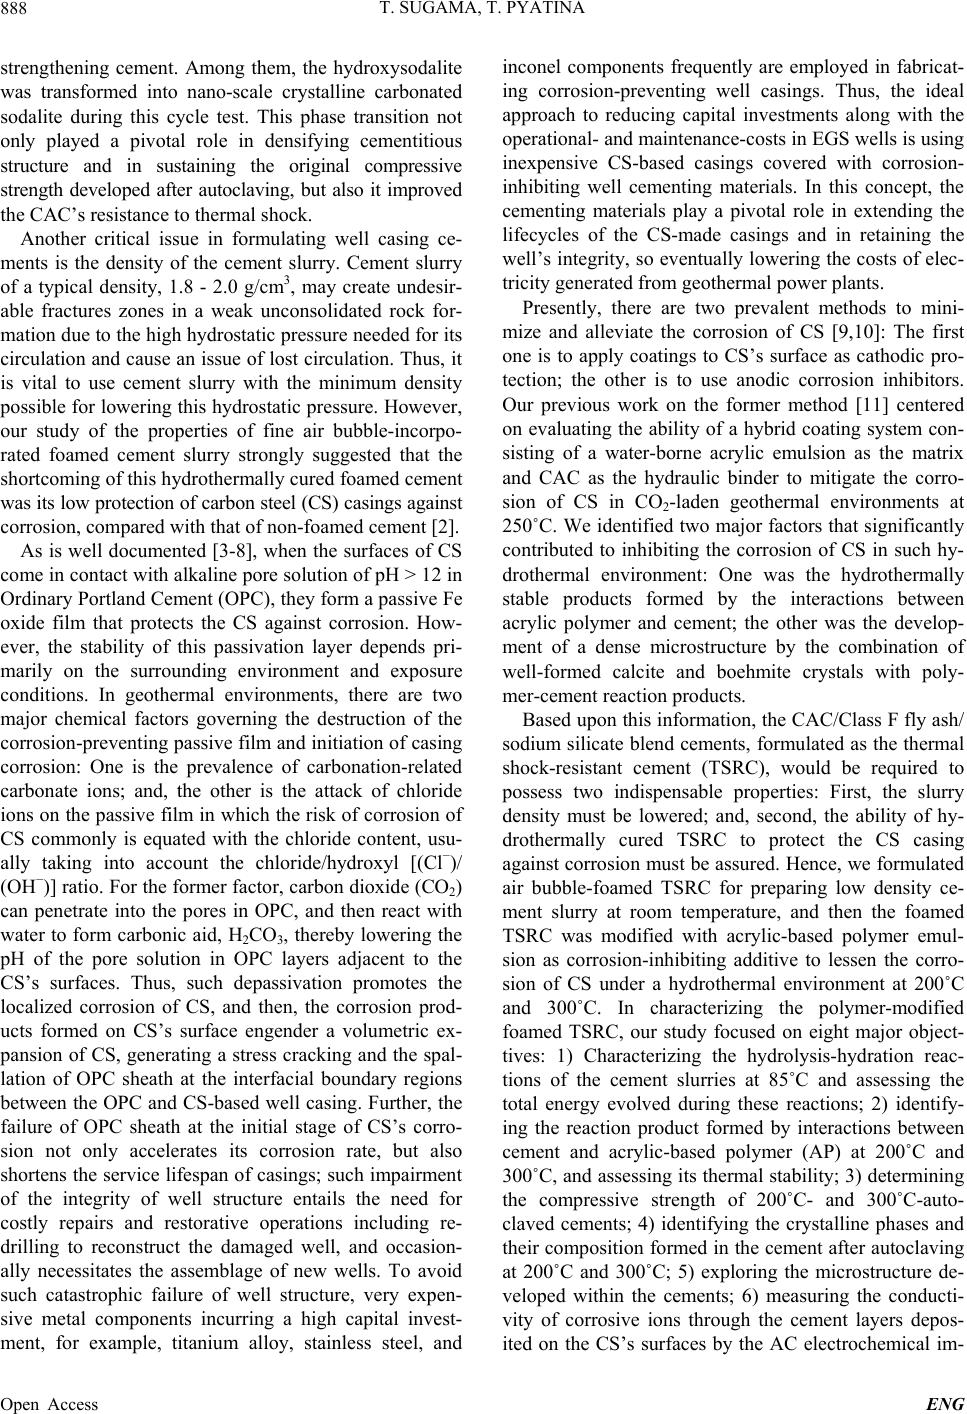 T. SUGAMA, T. PYATINA 888 strengthening cement. Among them, the hydroxysodalite was transformed into nano-scale crystalline carbonated sodalite during this cycle test. This phase transition not only played a pivotal role in densifying cementitious structure and in sustaining the original compressive strength developed after autoclaving, but also it improved the CAC’s resistance to thermal shock. Another critical issue in formulating well casing ce- ments is the density of the cement slurry. Cement slurry of a typical density, 1.8 - 2.0 g/cm3, may create undesir- able fractures zones in a weak unconsolidated rock for- mation due to the high hydrostatic pressure needed for its circulation and cause an issue of lost circulation. Thus, it is vital to use cement slurry with the minimum density possible for lowering this hydrostatic pressure. However, our study of the properties of fine air bubble-incorpo- rated foamed cement slurry strongly suggested that the shortcoming of this hydrothermally cured foamed cement was its low protection of carbon steel (CS) casings against corrosion, compared with that of non-foamed cement [2]. As is well documented [3-8], when the surfaces of CS come in contact with alkaline pore solution of pH > 12 in Ordinary Portland Cement (OPC), they form a passive Fe oxide film that protects the CS against corrosion. How- ever, the stability of this passivation layer depends pri- marily on the surrounding environment and exposure conditions. In geothermal environments, there are two major chemical factors governing the destruction of the corrosion-preventing passive film and initiation of casing corrosion: One is the prevalence of carbonation-related carbonate ions; and, the other is the attack of chloride ions on the passive film in which the risk of corrosion of CS commonly is equated with the chloride content, usu- ally taking into account the chloride/hydroxyl [(Cl−)/ (OH−)] ratio. For the former factor, carbon dioxide (CO2) can penetrate into the pores in OPC, and then react with water to form carbonic aid, H2CO3, thereby lowering the pH of the pore solution in OPC layers adjacent to the CS’s surfaces. Thus, such depassivation promotes the localized corrosion of CS, and then, the corrosion prod- ucts formed on CS’s surface engender a volumetric ex- pansion of CS, generating a stress cracking and the spal- lation of OPC sheath at the interfacial boundary regions between the OPC and CS-based well casing. Further, the failure of OPC sheath at the initial stage of CS’s corro- sion not only accelerates its corrosion rate, but also shortens the service lifespan of casings; such impairment of the integrity of well structure entails the need for costly repairs and restorative operations including re- drilling to reconstruct the damaged well, and occasion- ally necessitates the assemblage of new wells. To avoid such catastrophic failure of well structure, very expen- sive metal components incurring a high capital invest- ment, for example, titanium alloy, stainless steel, and inconel components frequently are employed in fabricat- ing corrosion-preventing well casings. Thus, the ideal approach to reducing capital investments along with the operational- and maintenance-costs in EGS wells is using inexpensive CS-based casings covered with corrosion- inhibiting well cementing materials. In this concept, the cementing materials play a pivotal role in extending the lifecycles of the CS-made casings and in retaining the well’s integrity, so eventually lowering the costs of elec- tricity generated from geothermal power plants. Presently, there are two prevalent methods to mini- mize and alleviate the corrosion of CS [9,10]: The first one is to apply coatings to CS’s surface as cathodic pro- tection; the other is to use anodic corrosion inhibitors. Our previous work on the former method [11] centered on evaluating the ability of a hybrid coating system con- sisting of a water-borne acrylic emulsion as the matrix and CAC as the hydraulic binder to mitigate the corro- sion of CS in CO 2-laden geothermal environments at 250˚C. We identified two major factors that significantly contributed to inhibiting the corrosion of CS in such hy- drothermal environment: One was the hydrothermally stable products formed by the interactions between acrylic polymer and cement; the other was the develop- ment of a dense microstructure by the combination of well-formed calcite and boehmite crystals with poly- mer-cement reaction products. Based upon this information, the CAC/Class F fly ash/ sodium silicate blend cements, formulated as the thermal shock-resistant cement (TSRC), would be required to possess two indispensable properties: First, the slurry density must be lowered; and, second, the ability of hy- drothermally cured TSRC to protect the CS casing against corrosion must be assured. Hence, we formulated air bubble-foamed TSRC for preparing low density ce- ment slurry at room temperature, and then the foamed TSRC was modified with acrylic-based polymer emul- sion as corrosion-inhibiting additive to lessen the corro- sion of CS under a hydrothermal environment at 200˚C and 300˚C. In characterizing the polymer-modified foamed TSRC, our study focused on eight major object- tives: 1) Characterizing the hydrolysis-hydration reac- tions of the cement slurries at 85˚C and assessing the total energy evolved during these reactions; 2) identify- ing the reaction product formed by interactions between cement and acrylic-based polymer (AP) at 200˚C and 300˚C, and assessing its thermal stability; 3) determining the compressive strength of 200˚C- and 300˚C-auto- claved cements; 4) identifying the crystalline phases and their composition formed in the cement after autoclaving at 200˚C and 300˚C; 5) exploring the microstructure de- veloped within the cements; 6) measuring the conducti- vity of corrosive ions through the cement layers depos- ited on the CS’s surfaces by the AC electrochemical im- Open Access ENG  T. SUGAMA, T. PYATINA 889 pedance spectroscopy; 7) evaluating the ability of cement coating to reduce the corrosion rate of CS using the DC electrochemical potentiodynamic polarization; and 8) assessing the extent of adherence of the cements to the underlying CS. Integrating all the data obtained from the objectives described above would clarify the potential of the AP- modified foamed TSRC as corrosion-alleviating well cement for CS casings in EGS environment at 200˚C and 300˚C. 2. Experimental Procedures 2.1. Materials Class F fly ash was obtained from Boral Material Tech- nologies, Inc., and its chemical composition detected by micro energy-dispersive X-ray spectrometer (EDX) was as follows; 50.4% SiO2, 34.8% Al2O3, 7.1% Fe2O3, 3.1% K2O, 2.7% CaO, 1.6% TiO2, and 0.4% SO3. A sodium silicate granular powder under the trade name “Metso Beads 2048,” supplied by the PQ Corporation was used as the alkali activator of Class F fly ash. Its chemical composition was 50.5 wt% Na2O and 46.6 wt% SiO2. Secar #80, supplied by Kerneos Inc. was used as refract- tory calcium aluminate cement (CAC). The X-ray pow- der diffraction (XRD) data showed that the crystalline compounds of Class F fly ash had three major phases, quartz (SiO2), mullite (3Al2O3·2SiO2), and hematite (Fe2O3), while CAC encompassed three crystalline phas- es, corundum ( -Al2O3), calcium monoaluminate (CaO·Al2O3, CA), and calcium dialuminate (CaO·2Al2O3, CA2). The AISI 1008 cold rolled steel test panel according to ASTM D 609C was used as the carbon steel (CS) sub- strate, supplied by ACT Test Panels, LLC. An alkaline cleaner #4429, from American Chemical Products, was employed to remove surface contaminants from it. This cleaner was diluted with deionized water to prepare 5 wt% cleaning solution. Acrylic emulsion under the trade name “HYCAR 26- 0688,” supplied by Lubrizol, was evaluated as the corro- sion-inhibiting additive for cement. This water-disperse- ble acrylic emulsion consisted of 49.5 wt% solid acrylic polymer (AP) and 41.5 wt% aqueous medium, and its pH was 2.32. Halliburton supplied the cocamidopropyl dimethyl- amine oxide-based foaming agent (FA) under the trade name “ZoneSealant 2000.” The formula of dry-blend cement employed in this study consisted of 60 wt% CAC and 40 wt% Class F fly ash. The sodium silicate at 6.2% by total weight of the blended cement was added to 60/40 CAC/Class F fly ash ratio to prepare the one dry-mix cement component. The amounts of AP used to modify the cement were 0.5, 1.0, and 2.0% by total weight of this dry mixture. The FA was added at 1.0% by total weight of water. The follow- ing sequence was employed to make the foamed AP- containing cement slurry: First, the proper amount of water-miscible FA was blended in water, and then the proper amount of acrylic emulsion was incorporated into it; second, this water-based solution was added to the dry cement component to prepare a pumpable slurry; the water/(cement + acrylic emulsion) [W/(C + AE)] ratios for 0, 0.5, 1.0, and 2.0 wt% AP-modified cements were 0.44, 0.37, 0.28, and 0.15, receptivity; and, finally, the AP-containing foamed cement slurry was mixed thor- oughly in a shear-blender for 30 sec. This shear mixing made it possible to prepare aerated slurry containing a vast number of air bubbles, leading to the transformation of the original stiff slurry into a smooth creamy one. The surfaces of the 65 mm × 65 mm CS test panels were coated with the foamed AP-containing cements in the following sequence: First, the “as-received” test pan- els were immersed in a 5 wt% alkali-cleaning solution at 40˚C for 10 min; second, alkali-cleaned panels’ surfaces were rinsed with a tap water at 25˚C, and dried for 24 hours in air at room temperature; third, the panels were dipped into a soaking bath of cement slurries at room temperature, and withdrawn slowly; fourth, the cement slurry-covered panels were left for 3 days at room tem- perature, allowing the slurry to convert into a solid layer; and, finally, the cement-coated panels were autoclaved for 24 hours at 200˚C and 300˚C before conducting the electrochemical corrosion tests. The thickness of the de- posited cement layers on the CS’s surfaces ranged from ~1.0 to ~1.4 mm. 2.2. Measurements The density, g/cm3, of the foamed cement slurries was determined using the fluid density container. Then, the slurries were poured in cylindrical molds (20 mm diam. and 40 mm long) and left for 3 days at room temperature before compressive strength measurements. Thereafter, the hardened foamed cements were removed from the mold and autoclaved at 200˚C and 300˚C for 24 hours, then left for 24 hours at room temperature. TAM Air Isothermal Microcalorimeter was adapted to investigate the hydrolysis-hydration reactions in cement slurries and to determine the cumulative heat flow evolved during these reactions at 85˚C. The changes in compressive strength of the 200˚C- and 300˚C-24 h- autoclaved cements as a function of AP’s content were obtained using Instron Model 5967. The reaction prod- ucts between the AP and cement at hydrothermal tem- peratures of 85˚C, 200˚C, and 300˚C were identified us- ing Fourier Transform Infrared Spectroscopy (FT-IR), and then the thermal stability of identified reaction prod- ucts was surveyed using Thermo Gravimetric Analyzer Open Access ENG  T. SUGAMA, T. PYATINA 890 (TGA) at the heating rate of 20˚C/min in a N2 flow. The composition of crystalline phases formed in 200˚C- and 300˚C-autoclaved foamed cements was identified by X- ray diffraction (XRD). Alterations of the microstructure developed in foamed cements at 200˚C by AP were ex- plored with the High-Resolution Scanning Electron Mi- croscopy (HR-SEM). The adherence behavior of AP- modified and non-modified foamed cements to CS’s sur- face was surveyed using EDX. DC electrochemical testing for corrosion of the underlying CS was performed with the EG&G Princeton Applied Research Model 326-1 Corrosion Measurement System. For this assess- ment, the cement-coated CS specimen was mounted in a holder, and then inserted into an EG&G Model K47 electrochemical cell containing a 1.0 M sodium chloride electrolyte solution. The test was conducted under an aerated condition at 25˚C, on an exposed surface area of 1.0 cm2. The polarization curves were measured at a scan rate of 0.5 mVs−1 in the corrosion potential range from −0.05 to −0.75 V. AC electrochemical impedance spec- troscopy (EIS) was used to evaluate the ability of the cement layers to protect the CS from corrosion. For this, the coated CS specimens with a surface area of 13 cm2 were mounted in a holder, and then inserted into an elec- trochemical cell containing a 1.0 M sodium chloride electrolyte at 25˚C; single-sine technology with an input AC voltage of 10 mV (rms) was employed over a fre- quency range of 105 to 10−3 Hz. To estimate the protec- tive performance of the cements, the pore resistance, Rp, (ohm-cm2) was determined from the plateau in Bode-plot scans occurring in low frequency regions. 3. Results and Discussion 3.1. Density of Slurries Figure 1 shows the changes in slurry density as a func- tion of AP content. Without any AP, the density of the AP content, wt% 0.0 0.5 1.0 1.5 2.0 Slurry density, g/cm 3 1.1 1.2 1.3 1.4 1.5 1.6 1.7 1.8 1.9 0% FA 1% FA Figure 1. Changes in slurry density for FA-foamed and non-foamed cement slurries as a function of AP content. non-foamed cement slurry denoted as 0% FA was 1.86 g/cm3. This density drastically dropped by 31% to 1.29 g/cm3, as 1% FA was added to it, demonstrating that this FA is very effective in and suitable for reducing the den- sity of this specific blend cement slurry. When AP addi- tive was incorporated into non-foamed and foamed slur- ries, their densities gradually declined with an increasing content of AP; adding 2 wt% AP reduced the density to 1.82 g/cm3 for non-foamed and to 1.2 g/cm3 for foamed slurry, suggesting that AP has air-entraining properties in slurry during mixing. 3.2. Hydrothermal Stability of AP in Cement One inevitable question that must be asked is the suscep- tibility of AP to the hydrothermal degradation in cement slurries at 200˚C and 300˚C. To respond to this question, we prepared samples composed of 50 wt% acrylic emul- sion and 50 wt% CAC/Class F fly ash/sodium silicate blend cement at room temperature, and then autoclaved them for 24 hours at 85˚C, 200˚C, and 300˚C, to conduct FT-IR and TGA analyses. The “as-received” acrylic emulsion was used as the control for FT-IR analysis. Figure 2 shows the FT-IR spectra over frequency range from 1850 to 1250 cm−1, for the control, and APs formed in 85˚C-, 200˚C -, and 300˚C-autoclaved cements. The absorbance spectrum of 85˚C-autoclaved sample encompassed four prominent bands: At 1730 cm−1 attrib- uted to the acrylic acid, -COOH, and alkyl ester, -COOR (R, ethyl or butyl ester); at 1552 and 1405 cm−1 corre- sponding to the symmetric and anti-symmetric stretching, respectively, of the carboxylate anion, –COO− in –COO− M (M, metallic cations) linkage structure; and, at 1452 cm−1 associating with CO3 2− in carbonated compounds. In comparison, no bands related to carboxylate anion were found in the control. The spectrum of 200˚C-ex- 17501850 1650 1550 1450 13501250 Wavenumber cm -1 Absorbance 1730 1552 1452 1405 85°C 200°C 300°C Control Absorbance ratio of 1552 cm -1 / 1730 cm -1 = 0.0 1552 cm -1 / 1730 cm -1 = 0.2 1552 cm -1 / 1730 cm -1 = 2.3 1552 cm -1 / 1730 cm -1 = 5.0 Figure 2. Comparison of FT-IR spectral features and absor- bance ratios of 1552 cm−1 to 1730 cm−1 bands for control AP and AP autoclaved in cement slurry at 85˚C, 200˚C and 300˚C. Open Access ENG  T. SUGAMA, T. PYATINA 891 posed sample displayed two features different from the sample exposed to 85˚C: One was a striking decay in the intensity of band at 1730 cm−1; the other was the marked growth of the absorbance bands at 1552 and 1405 cm−1. This fact strongly suggested that raising the hydro- thermal temperature promoted the transformation of acrylic acid and alkyl ester within the molecular structure of AP into the carboxylate anion derivative. This trans- formation was further enhanced as the temperature rose to 300˚C, reflecting a near disappearance of the band at 1730 cm−1. To support this information, we compared the absorbance ratios of 1552 cm−1 to 1730 cm−1 for the con- trol, and 85˚C, 200˚C, and 300˚C samples (Figure 2). For the control, it was very difficult to determine the ab- sorbance at 1552 cm−1. The 85˚C sample had an absorb- ance ratio of 0.2, strongly verifying that the reactions between AP and cement already had occurred at such a relatively lower temperature. As expected, the value of this ratio increased with an increasing autoclave tem- perature; at 300˚C, the ratio of 5.0 was twenty five fold greater than that at 85˚C. These results clearly validated that the acrylic acid or alkyl ester → carboxylate anions transformation occurred progressively at elevated hydro- thermal temperatures. One important criterion of a high-temperature corro- sion inhibitor is its stability at ≥200˚C. Hence, our atten- tion next focused on surveying the thermal stability of AP derivatives obtained in high-temperature hydrother- mal reactions. The same samples as those used in the previous FT-IR analysis were dried for 24 hours at 85˚C to eliminate any free moisture and tested by TGA. Fig- ure 3 depicts the TGA curves between 25˚C and nearly 500˚C for the 85˚C-, 200˚C-, and 300˚C-autoclaved sam- ples. The major thermal decomposition of AP formed in 85˚C-autoclaved samples occurred around 300˚C. De- composition temperature of AP in 200˚C-autoclaved sample increased to ~349˚C, which was ~49˚C higher than for 85˚C sample. The decomposition temperature further increased to 85C 200C 300C 0 100 100 200 300 400 500 70 60 80 90 Temperature, °C Weight, % Figure 3. Thermal decomposition curves of AP autoclaved in cement slurry at 85˚C, 200˚C or 300˚C. ~438˚C for AP from 300˚C-autoclaved sample. Combined results of FT-IR and TGA studies high- lighted that the hydrothermal stability of AP in auto- claved cement was improved by incorporating more Metal-complexed carboxylate structures at 300˚C, com- pared to AP autoclaved in cement at 200˚C. Thus the AP in cement withstood the 300˚C hydrothermal environ- ment. 3.3. Hydration of AP-Modified Foamed Cement To investigate the changes in cement hydration with ad- dition of FA, AP or both we measured heat flow evolved at the isothermal temperature of 85˚C during cement hy- dration as a function of elapsed time. Figure 4 depicts relations between the normalized heat flow energy and elapsed time for non-foamed and foamed cement slurries without AP. For all the samples, the initial heat release peak denoted as the peak No. 1, corresponds to the particle wetting, dissolution of sodium silicate activator, beginning of the hydrolysis of some CAC and Class F fly ash by the alkali activation of dis- solved sodium silicate. This peak was observed shortly after placing an ampoule of the sample in a calorimeter with the maximum heat flow (MHF) been reached within 50 min. Subsequently, two other heat peaks marked as No. 2 and No. 3 were traced for both the non-foamed and 1 wt% FA-foamed slurries. This cement system consisted of two cement-forming reactants, CAC and Class F fly ash, our preliminary study (not shown) demonstrated that the hydration reactions of CAC were much faster than those of Class F fly ash. Thus, in the non-foamed cement slurry, the No. 2 peak emerged at elapsed time of 11 h 32 min was more likely associated with CAC hydration. It had MHF of 0.83 mW/g. The Class F fly ash-related No. 3 peak generated a 0.56 mW/g MHF at the elapsed time of 47 h 13 min. When non-foamed slurry was modi- 0 Heat flow, mW/g 1 2 3 4 01224 36 48 Time, hour 1 2 3 2 3 Non-foamed cement 1 wt% FA-foamed cement Figure 4. Microcalorimetric curves for non-foamed and 1 wt% FA-foamed cement slurries at 85˚C. Open Access ENG  T. SUGAMA, T. PYATINA Open Access ENG 892 fied with 1 wt% FA, its heat flow-time curve differed in three aspects from that of non-foamed one: First, the time to reach No. 2 and No. 3 peaks became shorter; second, the MHF value of the No. 2 peak increased pronouncedly to 2.52 mW/g; and, third, the MHF value at No. 3 peak had declined by ~45% to 0.31 mW/g. These results sug- gested that the foaming agent promoted the hydration reactions of CAC, so enhancing CAC-related MHF en- ergy. Table 1 lists the elapsed times at the onset and end of No.2 and No. 3 reactions along with the total energies evolved in these reactions for non-foamed and foamed- cement slurries at 85˚C. The total energies were com- puted from the enclosed areas of the heat flow-elapsed time curves with the baseline extending between peaks’ starts and ends. The No. 2 reaction, attributed to CAC’s hydration, clearly verified that it was accelerated by adding the 1 wt% FA. The onset of this reaction was shortened to 1 h 59 min by FA, compared to 4 h 6 min for the FA-free slurry. The computed heat flow energy, J/g, verified the increase of this energy by FA; in fact, a 40.4 J/g generated with 1 wt% FA was tantamount to 11.3% higher than for the non-foamed slurry. Such an effect of FA on CAC reactions accelerated the reactivity of Class F fly ash, thereby shortening the time to reach the onset of the No.3 reaction to 25 h 6 min for 1 wt% FA from 33 h 53 min required for non-foamed slurry. However, as for the Class F fly ash-related heat release, the contribution of FA to the increase in this energy was minimal; in fact, the value of 11.8 J/g for non-foamed slurry declined 1.8 times when 1 wt% FA was added to it. Nevertheless, the total energy evolved from No. 2 and No. 3 reactions rose with FA. Next, we obtained information on heat flow-elapsed time relations for the foamed slurries with 0.5, 1.0, and 2.0 wt% AP at 85˚C. Table 2 summarizes the elapsed times at the onset and end of each No. 2 and No. 3 reactions along with the total energy evolved from these two reactions for 0, 0.5, 1.0, and 2.0 wt% AP-modified foamed slurries. As is evident from these data, addition of AP in the concentra- tion range of 0.5 - 2.0 wt% pronouncedly retarded the CAC reaction. The onset time of this reaction for un- modified foamed slurry was delayed by as much as 3 and 5 hours with 1 and 2 wt% of AP, respectively. In contrast, AP was not as effective in delaying the onset time of Class F fly ash hydration as it was with CAC. On the other hand, the total energy evolved from the No. 2 reac- tion was strikingly augmented with an increasing AP content, from 33.9 J/g for 0 wt% to 55.8 J/g for 2 wt%, for Class F fly ash-associated No. 3 reaction. Hence, AP preferentially retarded the hydration reaction of CAC, rather than that of Class F fly ash. Such augmentation of CAC reaction energy by adding AP could be due to the energy generated by the acid-base interactions between the AP and CAC to form M-complexed carboxylates (M- aluminum, calcium, alkali metals) as the reaction prod- ucts. 3.4. Compressive Strength Figure 5 plots the compressive strength of the 200˚C- and 300˚C-autoclaved foamed cements modified with 0, 0.5, 1.0, and 2.0 wt% AP. The value of compressive strength depended on two factors, the content of AP and the hydrothermal temperature. For the latter, cement autoclaved at 300˚C was more effective in developing the compressive strength, than cement autoclaved at 200˚C. For the foamed cement without AP, autoclaving at Table 1. Calorimetric test results for non-foamed, and 1 wt% FA-foamed cement slurries at 85˚C. No. 2 reaction No. 3 reaction FA, wt% Onset time, h: min End time, h: min Evolved heat, J/gOnset time, h: minEnd time, h: minEvolved heat, J/g Total evolved heat, J/g 0 4:06 34:28 24.5 33:53 60:41 11.8 36.3 1 1:59 22:19 33.9 25:06 48:02 6.5 40.4 Table 2. Calorimetric test results for No. 2 and 3 reactions with 0, 0.5, 1.0, and 2.0 wt% AP-modified foamed slurries. No. 2 reaction No. 3 reaction AP, wt% Onset time, h: min End time, h: min Evolved heat, J/gOnset time, h: minEnd time, h: minEvolved heat, J/g Total evolved heat, J/g 0.0 1:59 22:19 33.9 25:06 48:02 6.5 40.4 0.5 2:20 22:49 42.5 25:15 47:10 7.1 49.6 1.0 3:59 21:30 47.2 25:46 48:21 8.8 56.0 2.0 5:33 21:51 55.8 26:03 45:35 10.8 66.6  T. SUGAMA, T. PYATINA 893 AP content, wt% 0.00.51.01.52.0 Compressive strength, MPa 2 3 4 5 6 7 8 After 200°C autoclave After 300°C autoclave Figure 5. Changes in compressive strength of the 200˚C- and 300˚C-autoclaved foamed cements as a function of AP content. 200˚C resulted in a compressive strength of 2.79 MPa. This strength rose by 1.5-fold to 4.13 MPa after auto- claving at 300˚C, so confirming that sodium silicate- activated CAC/Class F fly ash blended cement system withstood the hydrothermal temperatures up to 300˚C. Importantly, the rise in compressive strength at 300˚C reflected the densification of formed cement; in fact, the bulk density of 300˚C-autoclaved cements was ~15% higher than that one autoclaved at 200˚C. The presence of AP improved the compressive strength at both 200˚C and 300˚C; this strength tended to rise progressively with increasing AP content. At 200˚C, adding only 0.5 wt% AP resulted in the compressive strength increase by 19% to 3.45 MPa. Further increasing AP content to 2.0 wt% strengthened it more; reaching a value of 6.68 MPa, equivalent to 2.4-fold improvement compared with that of AP-free cement. A similar trend was observed from 300˚C-autoclaved foamed cement; adding 2.0 wt% AP developed a 7.54 MPa compressive strength, corresponding to 1.4-fold improvements above that of 0.5 wt% AP. Thus, the AP additive greatly con- tributed to improving the cement’s compressive strength in a hydrothermal environment at 200˚C and 300˚C. 3.5. Phase identification and Microstructure Development One intriguing question of the incorporation of AP into the autoclaved foamed cement was whether it would change the composition of the crystalline phases as the hydrothermal reaction products responsible for strength- ening it. Accordingly, XRD was used to identify the phases assembled in the foamed cements containing 0 and 2 wt% AP after autoclaving at 200˚C and 300˚C. Figure 6 depicts the XRD traces, 2θ degree, ranging from 3 to 51, for the powder samples of 200˚C-auto- 10 2040 5030 2θ(degree) Intensity (arb. Unit) S: Hydroxysodalite B: Boehmite K: Katoite Q: Quartz G: Hydrograssular C: Corundum S B K QS S C C Q BGGG K S G GQ K B C G KG Q C B QBB Q S B K K Q S C Q B G G GK SG G C Q KC BG K Q C BQ S Figure 6. XRD patterns for 200˚C -autclaved foamed ce- ments containing 0 (bottom) and 2% AP (top). claved foamed cements with and without AP. For AP- free foamed cement, the XRD pattern (bottom) showed that the cement was composed of the four crystalline hydration reaction products, hydroxysodalite [Na4Al3Si3O12(OH)], boehmite (γ-AlOOH), Si-free ka- toite [Ca5Al2(OH)12], and intermediate hydrogrossular [Ca3Al2Si2O8(OH)4] phases, and two non-reacted crystal- line products, quartz (SiO2) and corundum (α-Al2O3). The quartz originated from the Class F fly ash, while corundum came from CAC. The boehmite and Si-free katoite phases were categorized as the hydration reaction products of CAC. Since the dissolution of sodium meta- silicate activator in water generated two major hydrolys- ate reactants, sodium hydroxide, NaOH, and metasilicic acid, H2SiO3 (and its sodium salt), the hydroxysodalite in the family of zeolite, was formed by the hydrothermal reactions between sodium hydroxide and mullite (3Al2O3·2SiO2) in Class F fly ash. On the other hand, the hydrothermal reactions between CAC and quartz in Class F fly ash led to the formation of hydrogrossular phases. Both hydrogrossular and Si-free katoite phases are in the hydrogarnet family. After modifying this cement with 2 wt% AP, the XRD patterns (top) closely resembled that of AP-free one, suggesting that the AP had no significant effect upon the final phase composition assembled in the 200˚C-autoclaved foamed cement. Thus, relating this finding to the result of compressive strength at 200˚C, the improvement of this strength engendered by adding AP depended on the content of AP, but was independent of the phase composition. Figure 7 illustrates the XRD tracings of 300˚C-auto- claved foamed cements with and without AP. Without AP, there were two major differences in this XRD pat- tern (bottom) from that of the cement made at 200˚C. First, the intensity of d-spacing lines related to quartz considerably decayed, implying that most of it in Class F Open Access ENG  T. SUGAMA, T. PYATINA 894 10 20 30 40 50 2θ(degree) Intensity (arb. Unit) S: Hydroxysodalite B: Boehmite Z: Na-P type zeolite K: Katoite Q: Quartz G: Hydrograssular C: Corundum S K BK Q KS S C K QB G G K S G C Q C BG K G Q C B QCB B Z S B KZ K QZ SS C K Q B Z G G Z C Q K C B G K GQ C B Q C BB Q Figure 7. XRD patterns for 300˚C-autclaved foamed ce- ments containing 0 (bottom) and 2% AP (top). fly ash hydrothermally reacted with the other cement- forming reactants. Second, intensive d-spacing lines were observed from hydroxysodalite, katoite, and hydrogros- sular hydration products, emphasizing that these products were well crystallized at 300˚C and became the major crystalline phases in conjunction with the corundum. We interpreted these results as follows: Since the ka- toite phase had no silicate, seemingly the hydration reac- tion of CAC at 300˚C created a well-formed katoite. Also, this high temperature promoted the extent of hydrother- mal reactions between sodium hydroxide and mullite to form a well-crystallized hydroxysodalite. The principal reason for the depletion of quartz was the formation of more hydrogrossular because of an extensive reaction of CAC with quartz in Class F fly ash. As described in compressive strength testing, the 300˚C-autoclaved cements had a higher compressive strength than those autoclaved at 200˚C. Thus, good for- mation at 300˚C of these three crystalline hydrate phases, hydroxysodalite, katoite, and hydrograssular, seems to be responsible for improving compressive strength. Of particular interest was the XRD pattern (top) of 2% AP-modified cement, compared with that of unmodified one. The pattern of the former was characterized by hav- ing three distinctive features; 1) the incorporation of a new crystalline hydrate phase attributed to Na-P type zeolite into the cement, 2) the presence of intensive d- spacing related to non-reacted quartz, and 3) the expres- sion of a relatively weak line intensity of hydroxyso- dalite-, katoite-, and hydrograssular-associated d-spacing. The last two results suggested that AP not only inhibited the reactions of quartz in Class F fly ash with CAC to form hydrogrossular, but also restrained the extent of crystallization of hydroxysodalite and katoite, while an additional zeolite phase belonging to Na-P type was in- troduced in 300˚C-autoclaved cement. Similar to the re- lationship between AP content and compressive strength at 200˚C, the improvement of compressive strength at 300˚C depended primarily on the AP content, but not on the crystalline phases and their composition. Our attention next shifted to exploring the microstruc- ture developed in the foamed cement with AP. Figure 8 shows the SEM images for the fractured surfaces of foamed cements without and with 2 wt% AP after auto- claving at 200˚C. Without AP, the image of the foamed cement made by incorporating numerous air bubbles into the slurry revealed a typical honeycomb-like porous structure encompassing craters of ~300 to ~ 50 m. Most of these craters had a partially defective structure, which can be interpreted as the formation of continuous voids. After modifying the cement with 2 wt% AP, the image was characterized by much smaller-size creators. Addi- tionally, the defects in individual creators were minimal, implying that AP aided in forming defect-free small cra- ters as discrete voids. A similar microstructure was ap- parent from the fractured surfaces of 300˚C-autoclaved foamed cements with and without AP (not shown). Unlike the continuous voids-containing porous struc- ture in the foamed cement, we can assume that the struc- ture assembled by discrete voids would reduce the rates of permeability and transportation of corrosive electro- lytes through the cement, assuring its ability to protect carbon steel (CS) against corrosion. 3.6. Corrosion Mitigation To verify the potential of AP to mitigate the corrosion of CS, we conducted two electrochemical corrosion studies. The first study centered on investigating the resistance of AP to the infiltration and transportation of a corrosive electrolyte through the foamed cement layer covering the underlying CS surface; and, the second one was to sur- vey the effectiveness of AP in preventing the corrosion of CS at its interface with the foamed cement. The latter Figure 8. SEM images for fractured surfaces of foamed cements without AP (top) and 2 wt% AP-modified foamed cement (bottom). Open Access ENG 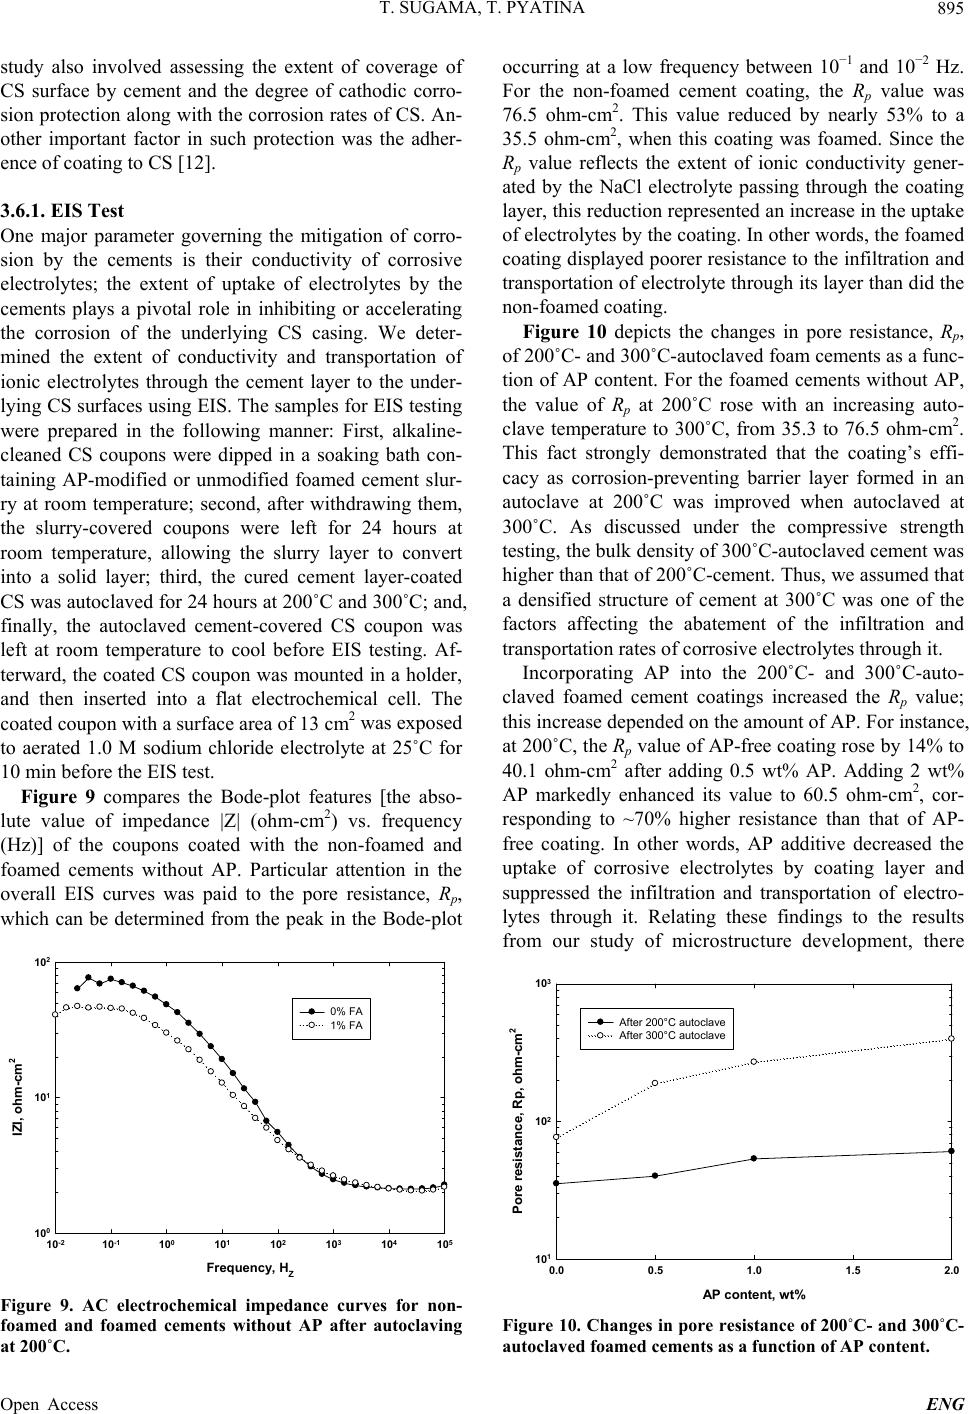 T. SUGAMA, T. PYATINA 895 study also involved assessing the extent of coverage of CS surface by cement and the degree of cathodic corro- sion protection along with the corrosion rates of CS. An- other important factor in such protection was the adher- ence of coating to CS [12]. 3.6.1. EIS Test One major parameter governing the mitigation of corro- sion by the cements is their conductivity of corrosive electrolytes; the extent of uptake of electrolytes by the cements plays a pivotal role in inhibiting or accelerating the corrosion of the underlying CS casing. We deter- mined the extent of conductivity and transportation of ionic electrolytes through the cement layer to the under- lying CS surfaces using EIS. The samples for EIS testing were prepared in the following manner: First, alkaline- cleaned CS coupons were dipped in a soaking bath con- taining AP-modified or unmodified foamed cement slur- ry at room temperature; second, after withdrawing them, the slurry-covered coupons were left for 24 hours at room temperature, allowing the slurry layer to convert into a solid layer; third, the cured cement layer-coated CS was autoclaved for 24 hours at 200˚C and 300˚C; and, finally, the autoclaved cement-covered CS coupon was left at room temperature to cool before EIS testing. Af- terward, the coated CS coupon was mounted in a holder, and then inserted into a flat electrochemical cell. The coated coupon with a surface area of 13 cm2 was exposed to aerated 1.0 M sodium chloride electrolyte at 25˚C for 10 min before the EIS test. Figure 9 compares the Bode-plot features [the abso- lute value of impedance |Z| (ohm-cm2) vs. frequency (Hz)] of the coupons coated with the non-foamed and foamed cements without AP. Particular attention in the overall EIS curves was paid to the pore resistance, Rp, which can be determined from the peak in the Bode-plot Frequency, H Z 10 -2 10 -1 10 0 10 1 10 2 10 3 10 4 10 5 IZI, ohm-cm 2 10 0 10 1 10 2 0% FA 1% FA Figure 9. AC electrochemical impedance curves for non- foamed and foamed cements without AP after autoclaving at 200˚C. occurring at a low frequency between 10−1 and 10−2 Hz. For the non-foamed cement coating, the Rp value was 76.5 ohm-cm2. This value reduced by nearly 53% to a 35.5 ohm-cm2, when this coating was foamed. Since the Rp value reflects the extent of ionic conductivity gener- ated by the NaCl electrolyte passing through the coating layer, this reduction represented an increase in the uptake of electrolytes by the coating. In other words, the foamed coating displayed poorer resistance to the infiltration and transportation of electrolyte through its layer than did the non-foamed coating. Figure 10 depicts the changes in pore resistance, Rp, of 200˚C- and 300˚C-autoclaved foam cements as a func- tion of AP content. For the foamed cements without AP, the value of Rp at 200˚C rose with an increasing auto- clave temperature to 300˚C, from 35.3 to 76.5 ohm-cm2. This fact strongly demonstrated that the coating’s effi- cacy as corrosion-preventing barrier layer formed in an autoclave at 200˚C was improved when autoclaved at 300˚C. As discussed under the compressive strength testing, the bulk density of 300˚C-autoclaved cement was higher than that of 200˚C-cement. Thus, we assumed that a densified structure of cement at 300˚C was one of the factors affecting the abatement of the infiltration and transportation rates of corrosive electrolytes through it. Incorporating AP into the 200˚C- and 300˚C-auto- claved foamed cement coatings increased the Rp value; this increase depended on the amount of AP. For instance, at 200˚C, the Rp value of AP-free coating rose by 14% to 40.1 ohm-cm2 after adding 0.5 wt% AP. Adding 2 wt% AP markedly enhanced its value to 60.5 ohm-cm2, cor- responding to ~70% higher resistance than that of AP- free coating. In other words, AP additive decreased the uptake of corrosive electrolytes by coating layer and suppressed the infiltration and transportation of electro- lytes through it. Relating these findings to the results from our study of microstructure development, there AP content, wt% 0.00.51.01.52.0 Pore resistance, Rp, ohm-cm 2 10 1 10 2 10 3 After 200°C autoclave After 300°C autoclave Figure 10. Changes in pore resistance of 200˚C- and 300˚C- autoclaved foamed cements as a function of AP content. Open Access ENG 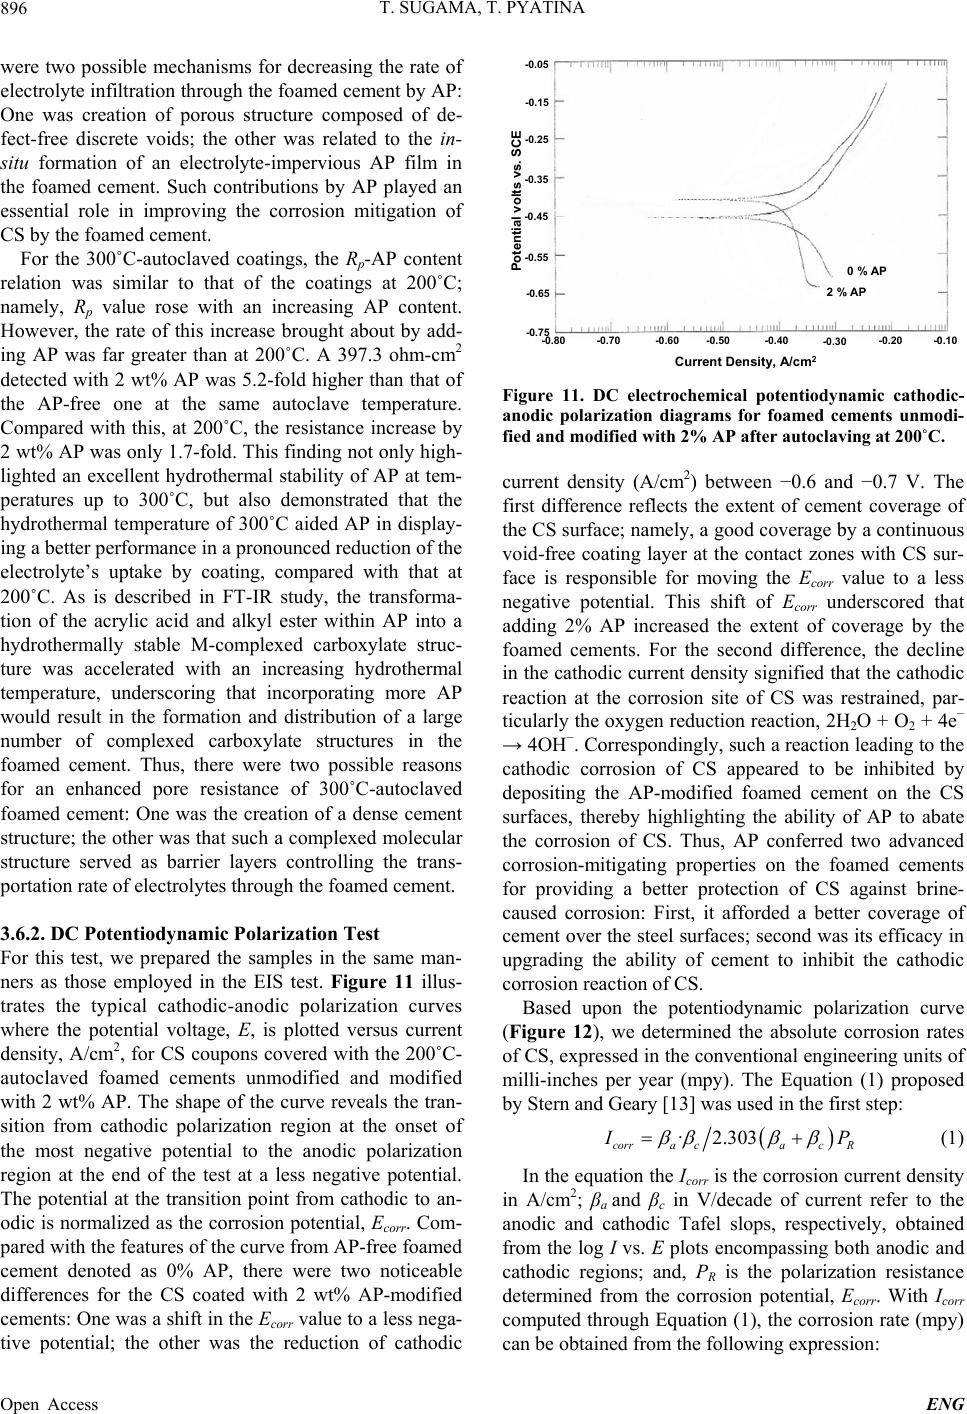 T. SUGAMA, T. PYATINA 896 were two possible mechanisms for decreasing the rate of electrolyte infiltration through the foamed cement by AP: One was creation of porous structure composed of de- fect-free discrete voids; the other was related to the in- situ formation of an electrolyte-impervious AP film in the foamed cement. Such contributions by AP played an essential role in improving the corrosion mitigation of CS by the foamed cement. For the 300˚C-autoclaved coatings, the Rp-AP content relation was similar to that of the coatings at 200˚C; namely, Rp value rose with an increasing AP content. However, the rate of this increase brought about by add- ing AP was far greater than at 200˚C. A 397.3 ohm-cm2 detected with 2 wt% AP was 5.2-fold higher than that of the AP-free one at the same autoclave temperature. Compared with this, at 200˚C, the resistance increase by 2 wt% AP was only 1.7-fold. This finding not only high- lighted an excellent hydrothermal stability of AP at tem- peratures up to 300˚C, but also demonstrated that the hydrothermal temperature of 300˚C aided AP in display- ing a better performance in a pronounced reduction of the electrolyte’s uptake by coating, compared with that at 200˚C. As is described in FT-IR study, the transforma- tion of the acrylic acid and alkyl ester within AP into a hydrothermally stable M-complexed carboxylate struc- ture was accelerated with an increasing hydrothermal temperature, underscoring that incorporating more AP would result in the formation and distribution of a large number of complexed carboxylate structures in the foamed cement. Thus, there were two possible reasons for an enhanced pore resistance of 300˚C-autoclaved foamed cement: One was the creation of a dense cement structure; the other was that such a complexed molecular structure served as barrier layers controlling the trans- portation rate of electrolytes through the foamed cement. 3.6.2. DC Potenti od yn ami c Pol arization Test For this test, we prepared the samples in the same man- ners as those employed in the EIS test. Figure 11 illus- trates the typical cathodic-anodic polarization curves where the potential voltage, E, is plotted versus current density, A/cm2, for CS coupons covered with the 200˚C- autoclaved foamed cements unmodified and modified with 2 wt% AP. The shape of the curve reveals the tran- sition from cathodic polarization region at the onset of the most negative potential to the anodic polarization region at the end of the test at a less negative potential. The potential at the transition point from cathodic to an- odic is normalized as the corrosion potential, Ecorr. Com- pared with the features of the curve from AP-free foamed cement denoted as 0% AP, there were two noticeable differences for the CS coated with 2 wt% AP-modified cements: One was a shift in the Ecorr value to a less nega- tive potential; the other was the reduction of cathodic 0 % AP 2 % AP -0.70-0.80-0.60 -0.50-0.40 -0.30 -0.20 -0.10 Potential volts vs. SCE -0.65 -0.75 -0.55 -0.35 -0.45 -0.25 -0.15 -0.05 Current Density, A/cm 2 Figure 11. DC electrochemical potentiodynamic cathodic- anodic polarization diagrams for foamed cements unmodi- fied and modified with 2% AP after autoclaving at 200˚C. current density (A/cm2) between −0.6 and −0.7 V. The first difference reflects the extent of cement coverage of the CS surface; namely, a good coverage by a continuous void-free coating layer at the contact zones with CS sur- face is responsible for moving the Ecorr value to a less negative potential. This shift of Ecorr underscored that adding 2% AP increased the extent of coverage by the foamed cements. For the second difference, the decline in the cathodic current density signified that the cathodic reaction at the corrosion site of CS was restrained, par- ticularly the oxygen reduction reaction, 2H2O + O2 + 4e− → 4OH−. Correspondingly, such a reaction leading to the cathodic corrosion of CS appeared to be inhibited by depositing the AP-modified foamed cement on the CS surfaces, thereby highlighting the ability of AP to abate the corrosion of CS. Thus, AP conferred two advanced corrosion-mitigating properties on the foamed cements for providing a better protection of CS against brine- caused corrosion: First, it afforded a better coverage of cement over the steel surfaces; second was its efficacy in upgrading the ability of cement to inhibit the cathodic corrosion reaction of CS. Based upon the potentiodynamic polarization curve (Figure 12), we determined the absolute corrosion rates of CS, expressed in the conventional engineering units of milli-inches per year (mpy). The Equation (1) proposed by Stern and Geary [13] was used in the first step: ·2.303 corra cacR P (1) In the equation the Icorr is the corrosion current density in A/cm2; βa and βc in V/decade of current refer to the anodic and cathodic Tafel slops, respectively, obtained from the log I vs. E plots encompassing both anodic and cathodic regions; and, PR is the polarization resistance determined from the corrosion potential, Ecorr. With Icorr computed through Equation (1), the corrosion rate (mpy) can be obtained from the following expression: Open Access ENG  T. SUGAMA, T. PYATINA Open Access ENG 897 Corrosion rate = 0.13 Icorr (EW)/d; where EW is the equivalent weight of the corroding CS in g; and d is the density of the corroding CS in g/cm3. Table 3 gives the Icorr and corrosion rate calculated for CS panels coated with unmodified and modified with AP cement after au- toclaving at 200 and 300˚C for 24 hours. For the 200˚C-autoclaved test panels, the corrosion rate of the CS for AP-free coating was 175.7 mpy with accompany- ing Icorr of 38.5 × 10⁻⁵ A/cm2. These values conspicu- ously dropped to 68.9 mpy and 15.07 × 10⁻⁵ A/cm2 when the cement was modified with 2% AP, clearly validating the effectiveness of the AP in mitigating the CS’s corro- sion and in resisting the cathodic corrosion reactions. displayed a better performance in inhibiting the carthodic reaction and mitigating the CS’s corrosion. A further reduction of both the corrosion rate and Icorr value was realized by adding AP to it; in fact, a 2% AP provided a very low corrosion rate and Icorr value of 6.8 mpy and 1.49 × 10⁻⁵ A/cm2, respectively, reflecting 6.3-fold low- ering over those of AP-free cement. This finding also verified that AP not only withstood exposure to a hydro- thermal environment at 300˚C, but also improved CS protection against brine-caused corrosion by 300˚C- autoclaved foamed cement. Hence, AP had a potential as a high-temperature cor- rosion-inhibiting additive responsible for mitigating the CS’s corrosion at temperatures up to 300˚C. A very interesting data on corrosion mitigation was obtained from the 300˚C-autoclaved test panels; namely, the CS’s corrosion rate of 43.1 mpy and Icorr value of 9.42 × 10⁻⁵ A/cm2 by AP-free foamed cement was con- siderably lower than those of the 200˚C-autoclaved AP- free one. This corrosion rate represented nearly a 4-fold reduction compared with that of 200˚C; correspondingly, the similar reduction was observed in the Icorr value, suggesting that the foamed cement autoclaved at 300˚C 3.6.3. Adherence of Foamed Cement to CS Since a better interfacial bond between coating and CS was another factor governing the alleviation of the CS’s corrosion, we evaluated the extent of adherence of the 200˚C and 300˚C-autoclaved foamed cements modified with 0, 0.5, 1.0, and 2.0 wt% AP to CS surfaces by EDX-elemental mapping and -oxide quantitative analy- sis. The samples were prepared in the following sequences: First, the CS coupons’ surfaces were coated with AP-modified and unmodified foamed cements; second, the coated CS coupons were autoclaved at 200˚C or 300˚C for 24 hours; third, the autoclaved coupons were placed on the center-loading bending apparatus to gener- ate the tensile shear-bonding failure at the side of cement coating of CS, leading to the delamination of cement layer from underlying CS surface; and fourth, the CS side separated from the cement layer was used for the EDX mapping and the quantitative analysis of metal oxides. Assuming the cement adhered well to CS sur- faces and the failure of interfacial bonding occurs in ce- ment layers, our attention centered on obtaining the fol- lowing information: One was to visualize the distribution of cement-related Ca, Al, and Si elements remained Figure 12. Typical Tafel plot from a polarization experi- ment. Table 3. Tafel analyses of potentiodynamic polarization curves for steel panels covered with AP-modified and unmodified foamed cements. Temperature, ˚C AP content, wt% Ecorr (I = 0), (V) a, (V/decade) c, (V/decade) Icorr, (A/cm2) Corrosion rate, (mpy)* 200 0 −0.4551 0.2556 0.3814 38.50 × 10⁻⁵ 175.7 200 2.0 −0.4099 0.1623 0.6835 15.07 × 10⁻⁵ 68.9 300 0 −0.3226 0.1562 0.2756 9.42 × 10⁻⁵ 43.1 300 0.5 −0.4668 0.0955 0.3224 7.03 × 10⁻⁵ 32.1 300 1.0 −0.3128 0.2046 0.4188 4.29 × 10⁻⁵ 19.6 300 2.0 −0.3414 0.1700 0.3136 1.49 × 10⁻⁵ 6.8 * mpy: milli-inches per year.  T. SUGAMA, T. PYATINA 898 over the separated CS surfaces; the other was the changes in the content of metal oxides, in particular, Fe2O3, CaO, Al2O3, and SiO2, as a function of AP content. Thus, if we observed a widespread distribution of these elements and a great deal of these oxides, a possible interpretation was that the cement was well adhered to CS surfaces. Also, it should be noted that since the penetration depth of X-ray from µEDX is ~2 µm, all data related to elemental mapping and oxide compositions came from a top ~2 µm thick surface layer. Figure 13 represents the individual µEDX maps of Fe and Ca elements for CS surface separated from the 200˚C- and 300˚C-autoclaved AP-free foamed cement layers. The µEDX analyses were conducted on the map- ping areas of 4.0 × 3.0 mm (12 mm2) and targeted for detecting the two specific elements, Fe belonging to un- derlying CS and Ca attributed to cement. During the mapping operation, X-ray intensities of 6.4 and 3.7 keV lines for Fe Kα and Ca Kα respectively were recorded and used for creating color-coded maps of their relative distribution. The maximum amount, in percent, of each tested element is given above the color-barcode. Further, the concentration of these elements is ranked by the dif- ference in colors; namely, the area in white color coding indicates the highest concentration of these elements present on the CS surfaces, the dark red color is their secondary concentrated areas, while no presence or neg- ligible amount of these elements is signified by the areas in the darkest blue color. Correspondingly, the greenish and yellowish colors reflect a moderate presence of these elements. For the 200˚C-autoclaved foamed cement, the elemental mapping of Fe revealed mainly two different regions on the CS surface: One was the top- and bot- tom-central regions representing the distributions of the 4.290 100.0 [%] 4.0 x 3.0mm 0.80mm FeKa 0.000 30.37 [% ] 4.0 x 3.0mm 0.80mm CaKa 14.66 100.0 [%] 4.0 x 3.0mm 0.80mm FeKa 0.000 22.35 [%] 4.0 x 3.0mm 0.80mm CaKa Figure 13. EDX elemental mapping of Fe (top) and Ca (bottom) for interfacial CS sides separated from AP-free foamed cements after autoclaving at 200˚C (left) and 300˚C (right). red signal as major color code, and some green signal as well as blue signal as minor one; the other was the rest of this detected area, which mostly was white. The last re- sult meant that this region was dominated by Fe element originating from the underlying CS, implying no or poor converge of CS surface by any other elements. In con- trast, the former region was covered by some different elements. Hence, although the amount of Ca was only 22.4% at maximum on the studied area, Ca mapping ex- hibited some presence of this element over the top- and bottom-central regions, signifying that some cement re- mained locally on the CS surface separated from the ce- ment layer. This Ca-presence increased to 30.4%, when the foamed cement was autoclaved at 300˚C. In fact, as seen in Fe map, a large area over the CS surface was covered by other elements coexisting with Fe, compared with that of 200˚C-autoclaved foamed cement/CS inter- face sample. This finding demonstrated that the climbing the temperature to 300˚C from 200˚C improved the ad- herence of the foamed cement to CS. Figure 14 gives the EDX mapping results of four elements, Fe, Ca, Al, and Si for the interfacial CS dis- lodged from the 1.0 wt.% AP-modified foamed cement layer after autoclaving the cement/CS sample at 300˚C. X-ray intensity counts of Al and Si were taken from Al Kα and Si Kα at 1.5 and 1.7 keV, respectively. When the configuration of Fe mapping was compared with that of Ca over the CS surfaces, the distribution pattern of these two elements were very similar; thus, the highly concentrated region of Fe marked as the white- color code was directly opposite to the lowest concentra- tion region of Ca (dark blue). In contrast, although a high amount of 93.8% and 72.3% was detected for Al and Si, respectively, the configuration of their mapping images was quite distinct from those of Fe and Ca. 4.083 100.0 [%] 4.0 x 3.0mm 0.80mm FeKa0.000 24.56 [%] 4.0 x 3.0mm 0.80mm CaKa 0.000 93.84 [% ] 4.0 x 3.0mm 0.80mm AlKa0.000 72.31 [%] 4.0 x 3.0mm 0.80mm SiKa Figure 14. Comparison of Fe, Ca, Al, and Si elemental mapping images for interfacial CS surfaces dislodged from the 1.0 wt% AP-modified foamed cement after autoclaving at 300˚C. Open Access ENG 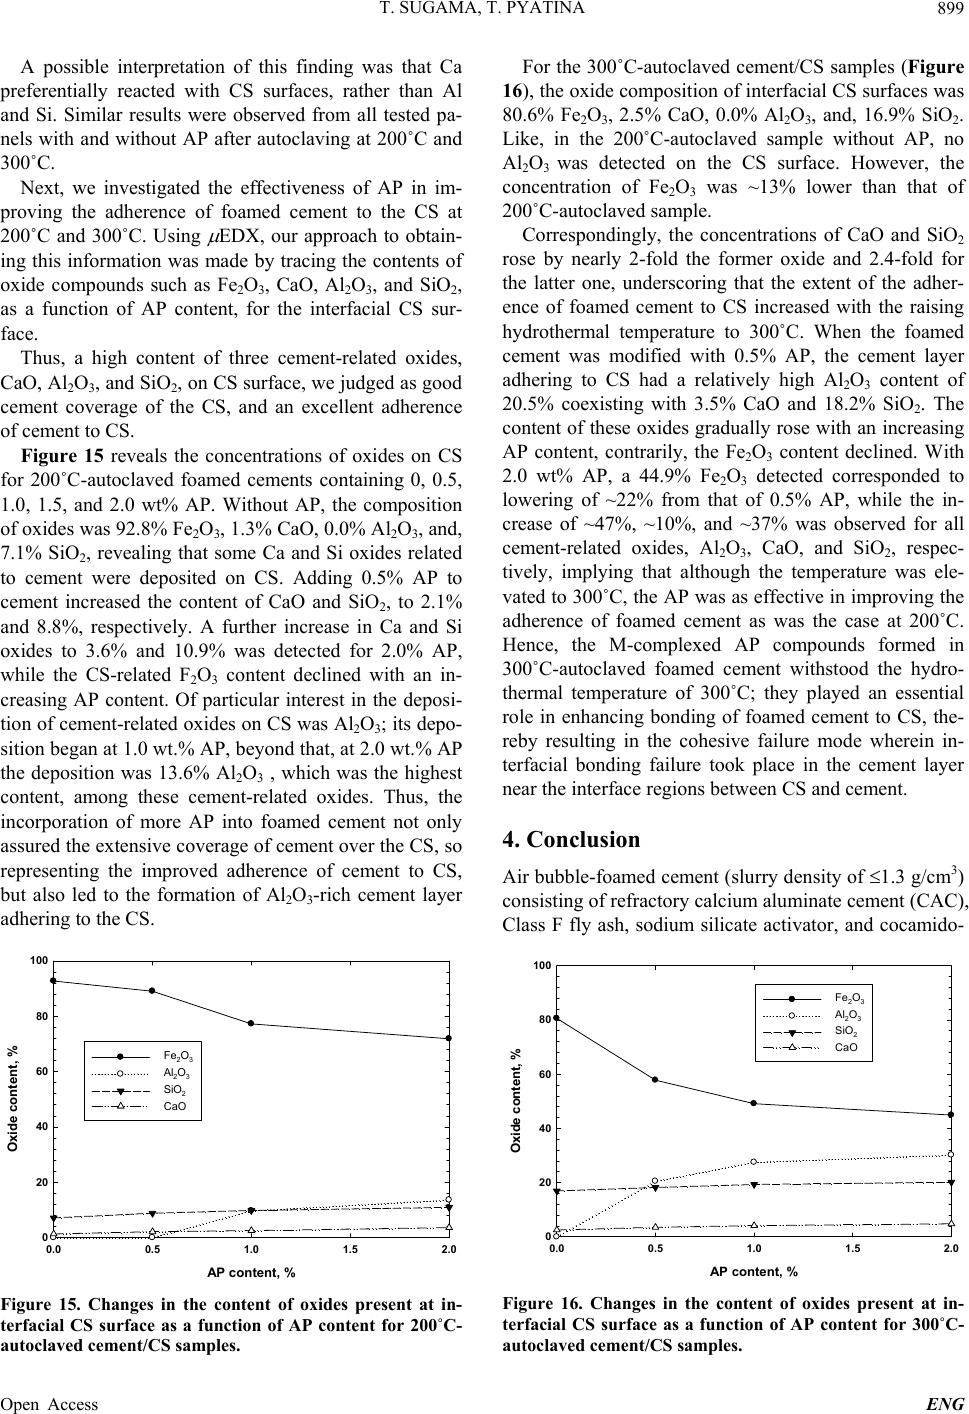 T. SUGAMA, T. PYATINA 899 A possible interpretation of this finding was that Ca preferentially reacted with CS surfaces, rather than Al and Si. Similar results were observed from all tested pa- nels with and without AP after autoclaving at 200˚C and 300˚C. Next, we investigated the effectiveness of AP in im- proving the adherence of foamed cement to the CS at 200˚C and 300˚C. Using EDX, our approach to obtain- ing this information was made by tracing the contents of oxide compounds such as Fe2O3, CaO, Al2O3, and SiO2, as a function of AP content, for the interfacial CS sur- face. Thus, a high content of three cement-related oxides, CaO, Al2O3, and SiO2, on CS surface, we judged as good cement coverage of the CS, and an excellent adherence of cement to CS. Figure 15 reveals the concentrations of oxides on CS for 200˚C-autoclaved foamed cements containing 0, 0.5, 1.0, 1.5, and 2.0 wt% AP. Without AP, the composition of oxides was 92.8% Fe2O3, 1.3% CaO, 0.0% Al2O3, and, 7.1% SiO2, revealing that some Ca and Si oxides related to cement were deposited on CS. Adding 0.5% AP to cement increased the content of CaO and SiO2, to 2.1% and 8.8%, respectively. A further increase in Ca and Si oxides to 3.6% and 10.9% was detected for 2.0% AP, while the CS-related F2O3 content declined with an in- creasing AP content. Of particular interest in the deposi- tion of cement-related oxides on CS was Al2O3; its depo- sition began at 1.0 wt.% AP, beyond that, at 2.0 wt.% AP the deposition was 13.6% Al2O3 , which was the highest content, among these cement-related oxides. Thus, the incorporation of more AP into foamed cement not only assured the extensive coverage of cement over the CS, so representing the improved adherence of cement to CS, but also led to the formation of Al2O3-rich cement layer adhering to the CS. AP content, % 0.0 0.5 1.01.5 2.0 Oxide content, % 0 20 40 60 80 100 Fe 2 O 3 Al 2 O 3 SiO 2 CaO Figure 15. Changes in the content of oxides present at in- terfacial CS surface as a function of AP content for 200˚C- autoclaved cement/CS samples. For the 300˚C-autoclaved cement/CS samples (Figure 16), the oxide composition of interfacial CS surfaces was 80.6% Fe2O3, 2.5% CaO, 0.0% Al2O3, and, 16.9% SiO2. Like, in the 200˚C-autoclaved sample without AP, no Al2O3 was detected on the CS surface. However, the concentration of Fe2O3 was ~13% lower than that of 200˚C-autoclaved sample. Correspondingly, the concentrations of CaO and SiO2 rose by nearly 2-fold the former oxide and 2.4-fold for the latter one, underscoring that the extent of the adher- ence of foamed cement to CS increased with the raising hydrothermal temperature to 300˚C. When the foamed cement was modified with 0.5% AP, the cement layer adhering to CS had a relatively high Al2O3 content of 20.5% coexisting with 3.5% CaO and 18.2% SiO2. The content of these oxides gradually rose with an increasing AP content, contrarily, the Fe2O3 content declined. With 2.0 wt% AP, a 44.9% Fe2O3 detected corresponded to lowering of ~22% from that of 0.5% AP, while the in- crease of ~47%, ~10%, and ~37% was observed for all cement-related oxides, Al2O3, CaO, and SiO2, respec- tively, implying that although the temperature was ele- vated to 300˚C, the AP was as effective in improving the adherence of foamed cement as was the case at 200˚C. Hence, the M-complexed AP compounds formed in 300˚C-autoclaved foamed cement withstood the hydro- thermal temperature of 300˚C; they played an essential role in enhancing bonding of foamed cement to CS, the- reby resulting in the cohesive failure mode wherein in- terfacial bonding failure took place in the cement layer near the interface regions between CS and cement. 4. Conclusion Air bubble-foamed cement (slurry density of 1.3 g/cm3) consisting of refractory calcium aluminate cement (CAC), Class F fly ash, sodium silicate activator, and cocamido- AP content, % 0.0 0.51.0 1.52.0 Oxide content, % 0 20 40 60 80 100 Fe 2 O 3 Al 2 O 3 SiO 2 CaO Figure 16. Changes in the content of oxides present at in- terfacial CS surface as a function of AP content for 300˚C- autoclaved cement/CS samples. Open Access ENG 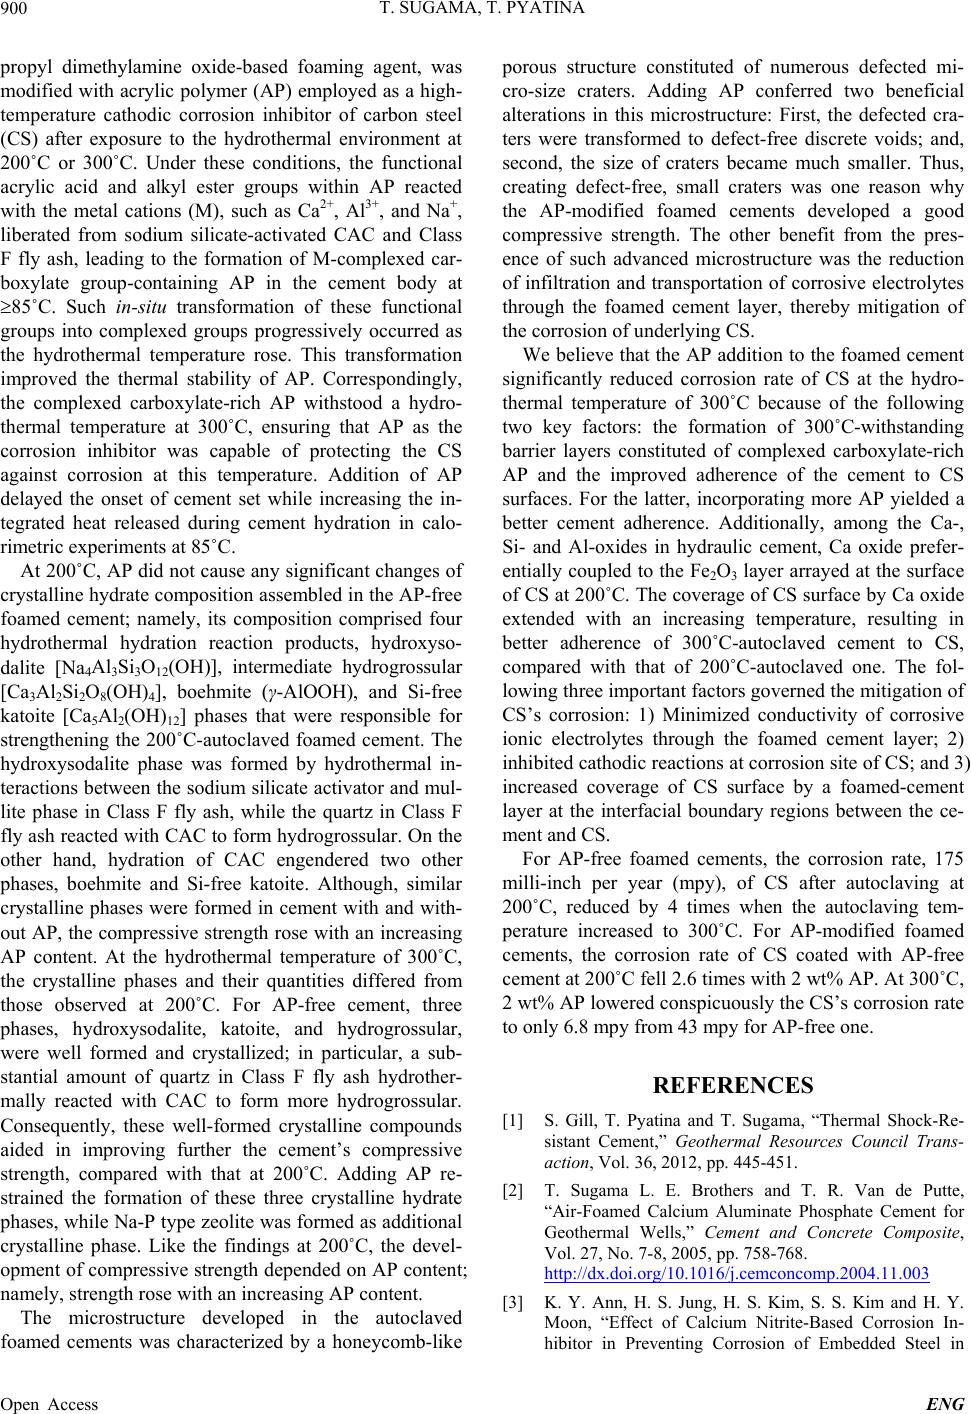 T. SUGAMA, T. PYATINA 900 propyl dimethylamine oxide-based foaming agent, was modified with acrylic polymer (AP) employed as a high- temperature cathodic corrosion inhibitor of carbon steel (CS) after exposure to the hydrothermal environment at 200˚C or 300˚C. Under these conditions, the functional acrylic acid and alkyl ester groups within AP reacted with the metal cations (M), such as Ca2+, Al3+, and Na+, liberated from sodium silicate-activated CAC and Class F fly ash, leading to the formation of M-complexed car- boxylate group-containing AP in the cement body at 85˚C. Such in-situ transformation of these functional groups into complexed groups progressively occurred as the hydrothermal temperature rose. This transformation improved the thermal stability of AP. Correspondingly, the complexed carboxylate-rich AP withstood a hydro- thermal temperature at 300˚C, ensuring that AP as the corrosion inhibitor was capable of protecting the CS against corrosion at this temperature. Addition of AP delayed the onset of cement set while increasing the in- tegrated heat released during cement hydration in calo- rimetric experiments at 85˚C. At 200˚C, AP did not cause any significant changes of crystalline hydrate composition assembled in the AP-free foamed cement; namely, its composition comprised four hydrothermal hydration reaction products, hydroxyso- dalite [Na4Al3Si3O12(OH)], intermediate hydrogrossular [Ca3Al2Si2O8(OH)4], boehmite (γ-AlOOH), and Si-free katoite [Ca5Al2(OH)12] phases that were responsible for strengthening the 200˚C-autoclaved foamed cement. The hydroxysodalite phase was formed by hydrothermal in- teractions between the sodium silicate activator and mul- lite phase in Class F fly ash, while the quartz in Class F fly ash reacted with CAC to form hydrogrossular. On the other hand, hydration of CAC engendered two other phases, boehmite and Si-free katoite. Although, similar crystalline phases were formed in cement with and with- out AP, the compressive strength rose with an increasing AP content. At the hydrothermal temperature of 300˚C, the crystalline phases and their quantities differed from those observed at 200˚C. For AP-free cement, three phases, hydroxysodalite, katoite, and hydrogrossular, were well formed and crystallized; in particular, a sub- stantial amount of quartz in Class F fly ash hydrother- mally reacted with CAC to form more hydrogrossular. Consequently, these well-formed crystalline compounds aided in improving further the cement’s compressive strength, compared with that at 200˚C. Adding AP re- strained the formation of these three crystalline hydrate phases, while Na-P type zeolite was formed as additional crystalline phase. Like the findings at 200˚C, the devel- opment of compressive strength depended on AP content; namely, strength rose with an increasing AP content. The microstructure developed in the autoclaved foamed cements was characterized by a honeycomb-like porous structure constituted of numerous defected mi- cro-size craters. Adding AP conferred two beneficial alterations in this microstructure: First, the defected cra- ters were transformed to defect-free discrete voids; and, second, the size of craters became much smaller. Thus, creating defect-free, small craters was one reason why the AP-modified foamed cements developed a good compressive strength. The other benefit from the pres- ence of such advanced microstructure was the reduction of infiltration and transportation of corrosive electrolytes through the foamed cement layer, thereby mitigation of the corrosion of underlying CS. We believe that the AP addition to the foamed cement significantly reduced corrosion rate of CS at the hydro- thermal temperature of 300˚C because of the following two key factors: the formation of 300˚C-withstanding barrier layers constituted of complexed carboxylate-rich AP and the improved adherence of the cement to CS surfaces. For the latter, incorporating more AP yielded a better cement adherence. Additionally, among the Ca-, Si- and Al-oxides in hydraulic cement, Ca oxide prefer- entially coupled to the Fe2O3 layer arrayed at the surface of CS at 200˚C. The coverage of CS surface by Ca oxide extended with an increasing temperature, resulting in better adherence of 300˚C-autoclaved cement to CS, compared with that of 200˚C-autoclaved one. The fol- lowing three important factors governed the mitigation of CS’s corrosion: 1) Minimized conductivity of corrosive ionic electrolytes through the foamed cement layer; 2) inhibited cathodic reactions at corrosion site of CS; and 3) increased coverage of CS surface by a foamed-cement layer at the interfacial boundary regions between the ce- ment and CS. For AP-free foamed cements, the corrosion rate, 175 milli-inch per year (mpy), of CS after autoclaving at 200˚C, reduced by 4 times when the autoclaving tem- perature increased to 300˚C. For AP-modified foamed cements, the corrosion rate of CS coated with AP-free cement at 200˚C fell 2.6 times with 2 wt% AP. At 300˚C, 2 wt% AP lowered conspicuously the CS’s corrosion rate to only 6.8 mpy from 43 mpy for AP-free one. REFERENCES [1] S. Gill, T. Pyatina and T. Sugama, “Thermal Shock-Re- sistant Cement,” Geothermal Resources Council Trans- action, Vol. 36, 2012, pp. 445-451. [2] T. Sugama L. E. Brothers and T. R. Van de Putte, “Air-Foamed Calcium Aluminate Phosphate Cement for Geothermal Wells,” Cement and Concrete Composite, Vol. 27, No. 7-8, 2005, pp. 758-768. http://dx.doi.org/10.1016/j.cemconcomp.2004.11.003 [3] K. Y. Ann, H. S. Jung, H. S. Kim, S. S. Kim and H. Y. Moon, “Effect of Calcium Nitrite-Based Corrosion In- hibitor in Preventing Corrosion of Embedded Steel in Open Access ENG  T. SUGAMA, T. PYATINA Open Access ENG 901 Concrete,” Cement and Concrete Research, Vol. 36, No. 3, 2006, pp. 530-535. http://dx.doi.org/10.1016/j.cemconres.2005.09.003 [4] M. Saremi and E. Mahallati, “A Study on Chloride-In- duced Depassivation of Mild Steel in Simulated Concrete Pore Solution,” Cement and Concrete Research, Vol. 32, No. 12, 2002, pp. 1915-1921. http://dx.doi.org/10.1016/S0008-8846(02)00895-5 [5] P. Ghods, O. B. Isgor, G. A. McRae and G. P. Gu, “Elec- trochemical Investigation of Chloride-Induced Depas- sivation of Black Steel Rebar under Simulated Service Conditions,” Corrosion Science, Vol. 52, 2010, pp. 1649- 1659. http://dx.doi.org/10.1016/j.corsci.2010.02.016 [6] Y. M. Tang, Y. F. Miao, Y. Zuo, G. D. Zhang and C. L. Wang, “Corrosion Behavior of Steel in Simulated Con- crete Pore Solutions Treated with Calcium Silicate Hy- drates,” Construction and Building Materials, Vol. 30, 2012, pp. 252-256. http://dx.doi.org/10.1016/j.conbuildmat.2011.11.033 [7] A. R. Boga and I. B. Topcu, “Influence of Fly Ash on Corrosion Resistance and Chloride Ion Permeability of Concrete,” Construction and Building Materials, Vol. 31, 2012, pp. 258-264. http://dx.doi.org/10.1016/j.conbuildmat.2011.12.106 [8] J. Hu, D. A. Koleva and K. van Breugel, “Corrosion Per- formance of Reinforced Mortar in the Presence of Poly- meric Nano-Aggregates: Electrochemical Behavior, Sur- face Analysis, and Properties of the Steel/Cement Past Interface,” Journal of Material Science, Vol. 47, 2012, pp. 4981-4995. http://dx.doi.org/10.1007/s10853-012-6374-6 [9] S. X. Wang, W. W. Lin, S. A. Ceng and J. Q. Zhang, “Corrosion Inhibition of Reinforcing Steel by Using Acrylic Latex,” Cement and Concrete Research, Vol. 28, 1998, pp. 649-653. http://dx.doi.org/10.1016/S0008-8846(98)00048-9 [10] R. Selvaraj, M. Selvaraj and S. V. K. Iyer, “Studies on the Evaluation of the Performance of Organic Coatings Used for the Prevention of Corrosion of Steel Rebars in Con- crete Structure,” Progress in Organic Coatings, Vol. 64, No. 4, 2009, pp. 454-459. http://dx.doi.org/10.1016/j.porgcoat.2008.08.005 [11] T. Sugama, “Hydrothermally Self-Advancing Hybrid Coatings for Mitigating Corrosion of Carbon Steel,” Brookhaven National Laboratory, 2006, BNL-77335. [12] P. R. Sere, A. R. Armas, C. I. Elsner and A. R. Di Sarli, “The Surface Condition Effect on Adhesion and Corro- sion Resistance of Carbon Steel/Chlorinated Rubber/Ar- tificial Sea Water Systems,” Corrosion Science, Vol. 38, 1996, pp. 853-866. http://dx.doi.org/10.1016/0010-938X(96)00171-0 [13] M. Stern and A. L. Geary, “Electrochemical Polarization I. A Theoretical Analysis of the Shape of Polarization Curves,” Journal of Electrochemical Society, Vol. 104, No. 1, 1975, pp. 56-62. http://dx.doi.org/10.1149/1.2428496
|