 Vol.4, No.9B, 12-22 (2013) Agricultural Sciences http://dx.doi.org/10.4236/as.2013.49B003 Copyright © 2013 SciRes. OPEN ACCESS Optimisation of extrusion cooking conditions and characterization of rice (Oryza sativa)—Sweet potato (Ipomoea batatas) and rice-yam (Dioscorea alata) based RTE products Elina Brahma Hazarika, Anjan Borah, Charu Lata Mahanta* Department of Food Engineering and Technology, School of Engineering, Tezpur University, Assam, India; *Corresponding Author: charu@tezu.ernet.in Received June 2013 AB STRACT Extrusion cooking has been extensively used to produce variety of foods like ready to eat break- fast cereals, baby foods, snack foods, etc. Tak- ing rice flour as the base ingredient, two locally available tuberous root vegetables, greater yam (Dioscorea alata) and sweet potato (Ipomoea ba- tatas) were used in this study for the develop- ment of ready-to-eat breakfast products in a sin- gle screw extruder. During extrusion cooking, the screw speeds ranged from 132 to 468 rpm and the barrel temperatures ranged from 103˚C to 137˚C. T he extrudat es were th en analyzed for various physical and physicochemical proper- ties. Optimization was done following Response Surface Methodology (RSM) using Central Com- posite Design. Using screw speed, barrel tem- perature and feed composition as the three in- dependent variables, the three responses taken were bulk de nsity, expansion in dex and breaking strength. The optimized conditio n s were used for developing 3 new products one of which also contained tomato pulp powder. The products were analyzed for their physical, proximate, sensory and antioxidant properties. There was significant colour change in all the three samples as indi- cated by total colour change (∆E). Texture anal- ysis of t he extrudat e samples showed hardnes s values ranging from 28.68 N to 47.57 N. Amylose content was found to be 15.3% in rice-sweet potato extrudate, 14.7% in rice-yam extrudate and 18.2% in r ice-sweet potato-tomato extrudate. The antioxidant profile of the extrudates studied through DPPH (2,2-diphenyl-picryhydrazyl) sc a- venging activity and FRAP (ferric reducing an- tioxidant property) showed that the antioxidant capacity in all the 3 extrudates was very low. Rice flour incorporated with sweet potato was judged the best on sensory evaluation. The study has shown that both sweet potato and greater yam tubers can be commercially exploited for the development of ready-to-eat (RTE) products . Keywords: Extrusion; RSM; RTE; Physicochemical Properties 1. INTRODUCTION Consumers want snacks that taste good, smell good, feel good, look good and in addition, are nutritionally su- perior and healthy. Extrusion cooking is one of the most important food processing technologies which have been used since the mid 1930s for the production of breakfast cereals, ready to eat snacks, and other textured foods. In the past decade, extrusion cooking has been studied ex- tensively to produce variety of specialty foods including pasta products and ready to eat breakfast cereals, baby foods, snack foods, texturised vegetable protein, pet foods, dried soups and dry beverage mixes, as it not only im- proves digestibility (Singh, Dartois, & Kaur, 2010) but also improves the nutrients bioavailability (Gu, Hous Rooney, & Prior, 2008) compared to conventional cook- ing. The quality of the product depends on the process conditions, such as the extruder type, the feed moisture, the temperature profile in the barrel sections, the screw speed and the feed rate (Thymi, Krokida, Pappa & Ma- roulis, 2005). Owing to the popularity and high nutritive value of vegetables, their utilization has increased either in raw form or processed form. Greater yam (Dioscorea alata) and sweet potato (Ipomoea batatas) are two species of large underground tuberous root vegetables seasonally available and are gaining importance as processed food  E. B. Hazarika et al. / Agricultural Sciences 4 (2013) 12-22 Copyright © 2013 SciRes. OPEN ACCESS sources. Work on extrusion cooking of sweet potato - soybean blend (Iwe et al., 1998) and sweet potato-whole wheat bran (Dansby et al., 2003) has been reported. Oke et al. (2012) and Chiu et al. (2013) have worked on ex- trusion cooking of yam (Dioscorea alata). However, extrusion cooking of sweet potato and grater yam with rice has not been reported. In this study sweet potato and grater yam powders were blended with rice to obtain a ready to eat breakfast product. The products were ana- lyzed for their physical, physicochemical, nutritional and sensory properties. 2. MATERIALS A ND METHODS 2.1. Materials The tubers of Dioscorea alata (greater yam) and Ipo- moea batatas (sweet potato) and tomatoes (Solanum ly- copersicum) were obtained from the market place near Tezpur University campus. The chemicals were obtained from Merck, Hi-Media and Rankem, and the glasswares used were from Borosil and Rankem. The extruder ma- chine ( G.L. Ext rusio n System Pvt. Ltd , New Del hi) used in the current study is a single-screw one, driven by 5 H.P. induction motor (DC). 2.2. Sample Preparation for Extrusion The water yam and sweet potato tubers were washed, peeled and cut into thin slices using Slicer (Alpha In- struments, Delhi) while yam tubers were dipped in 0.5% sodium metabisulphite solution to reduce browning. All samples were dried in a tray drier at 55˚C. The dried chips were subsequently milled into flour in a pulverizer (Alpha Instruments, Delhi) to pass through a 1.00 mm mes h sc ree n. T he flour samples were put in sealed pouch- es and kept in covered plastic containers until used for extrusion processes and analyses. Blends were prepared from sweet potato flour and rice flour in definite ratios for carrying out 18 different runs in the extruder. The moisture contents of the blended samples for extruder feed were adjusted at around 12% by adding calculated amounts of water into each blend and then mixing them properly. The blended mix in different ratios were kept overnight in a tightly covered vessel for moisture equili- bration. The extrusion processes were performed on a sin- gle screw extruder. Raw materials were fed into the ex- truder barrel a nd at the end of extrusion cooking was dis- charged from the end of the barrel as the extrudates. 2.3. Sample Preparation for Analysis of Extrudates The samples were ground in a mixer grinder into powder and ke pt in sealing pouches for t heir analysis. 2.4. Pasting Properties Pasting properties of extrudate powders were deter- mined using a Rapid Visco Analyser (RVA) model 2-D (Newport Scientific Instrument) with Thermocline soft- ware (3.0 version) by ICC Standard Method No. 162 (1995). Briefly, sample suspension was prepared by placing 3.5 g extrudate powder, in an aluminum canister containing 25 mL distilled water. A programmed heating and cooling cycle was used. Each sample was stirred at 960 rpm for 10 s while heating at 50˚C, and then constant shear rate (160 rpm) was maintained for the rest of the process. Temperature was held at 50˚C for 1 min. Then the sam- ples were heated from 50˚C to 95˚C within 3 min 42 s and held at 95˚C for 2 min 30 s. Subsequently samples were cooled down from 95˚C to 50˚C within 3 min 48 s and the n held at 5 0˚C for 2 min. The RVA plot of viscos- ity (cP) versus time (s) was used to determine peak vis- cosity (PV) and final viscosity (FV). 2.5. Expansion Index (EI) Expa nsion of e xtrudate s was meas ured usi ng a vernier caliper (Mitutoyo, Japan) according to the method of Ding et al. (2005). Measurements were taken on ten randomly selected pieces of extrudates. The die diameter of the extruder used in the stu dy is 2 mm. 2.6. Bulk Den sity (BD) Bulk density (BD) of extrudates was determined fol- lowing the method of Bhat nagar et al. (1995). 2.7. Color The colour values of the rice extrudates incorporated with sweet potato powder in terms of L, a, b values was measured using colour measurement spectrophotometer (Hunter Lab, Ultra-scan VIS). 2.8. Texture Profile Analysis (TPA) Texture evaluation of the extrudates was performed with texture analyzer (TA-HD-plus, Stable Micro Sys- tems, UK) with a 5 kg load cell. Hardness (HRD), punc- ture force (PF) and breaking strength (BS) of extrudates were determined as the maximum force offered by ex- trudates during compression and three point cutter test, respectively. Bre aki ng Str en gth ( N/m m2) = Peak breaking for ce/Cross sectional area 2.9. Water Absorption Index (WAI) and W a ter Solubility Index (WSI) WAI and WSI were determined following the proce- dure of Anderson et al. (1969).  E. B. Hazarika et al. / Agricultural Sciences 4 (2013) 12-22 Copyright © 2013 SciRes. OPEN A CCESS 2.10. Determination of Amylose Amylose content was measured according to Sowba- hagya & Bhattacharya (1979). 2.11. Sensory Properties The extruded products were sensorily evaluated by ten panelists. The samples were provided along with milk (for soaking) and sugar (for taste). Based on a 9-point Hedonic scale (0 - 9), the panel members were asked to give their score s on 6 different attributes, namely, appear- ance, colour, taste, texture, mouthfeel and overall accep- tability. 2.12. Determination of Proximate Content The moist ure, cr ude fat, crude protein, crude fiber and ash were determined as per AOAC (1999). The total car- bohydrate in the samples was calculated by the method of difference on wet basis. 2.13. Determination of DPPH Activity The radical scavenging activity of the extrudates was measured by determining the inhibition rate of DPPH (2, 2-diphe nyl-1-picrylhydrazyl) radical (Brand-Williams, 1995). 2.14. Determination of Ferric Reducing Ant i oxidant Property (F RAP) FRAP activity of the samples were measured by the method of Benzie and Strain (1999), after preparing ex- tracts in the same way as for DP PH analysis. 2.15. Statistical Analysis All the readings are average of minimum two readings. Analyses of all parameters are reported with standard deviation error bar. 3. RESULTS AND DISCUSSION 3.1. Experimental Design and Statistical Analysis Response Surface Met hodolo gy ( RSM), wh ic h explores the relationship between several explanatory variables and one or more response variables, was applied to the experimental data using the package, Design expert ver- sion 7.1.1, (STATE-EASE Inc, Minneapolis, USA. Trial version). The same software was used for generation of response surface plots, superimposition of counter plots and optimizatio n of process variables (Altan et al., 2008; Yagci & Gogus, 2008; Ding et al., 2005). The results are reported as means o f three rep licate s. A four var iable (five level of each variable) central composite design (CCD) was employed (Montgomery, 2001; Yagci & Gogus, 2008). The parameters and their levels were chosen based on literature available on rice based extrudates (Yagci and Gogus, 2008; Ding et al., 2005; Upadhyaya, 2008). The ingredients used for the extrudates were: rice flour, sweet potato po wder, yam powder and tomato pulp powder. The independent variables included screw speed (SS), barrel temperature (BT ) and feed composition (FCM). Re sponse variables were expansion index (EI), bulk density (BD) and breaking strength (BS). T he five levels of the process variables were coded as −1.682, −1, 0, 1, 1.682 (Mont- gomery, 2001) and the design in coded (x) form is given in Table 1. A quad ratic p olyno mial equatio n was fitted to the data to obtain a regression equation. The statistical significance of the terms in the regression equation was examined by analysis of variance (ANOVA) for each re- sponse. The extrusion processing parameters were opti- mized by using a conventional graphical method of RSM in order to obtain extrudates with acceptable properties. All the processing variables were kept within range while the responses were either maximized (for expansion in- dex) or kept less than a sp ecific value ( bulk den sity, break- ing str ength) . The ANO VA re sults a re shown i n Table 2. The Optimized parameters thus obtained from the above model are s hown in Table 3. Finally, the optimized solution that was obtained with the values of predicted responses are shown in Ta b l e 4 . The desirability level was 0.84. The Coefficients of va- riables in the predictive model for response variables (coded units) are: 2 123 1 22 23 1213 23 EI 4.790.16x0.44x0.032 x0.048 x 0.25x0.090x0.19xx0.11 xx 0.021 xx =++ +−+ +++ ⋅−⋅ −⋅ (1) 33 12 3 2 232 12 3 3 33 1213 23 BD 0.177.70510x0.026 x9.18110x 0.010 x0.015 x4.40510x3.150 10 xx3.15010 xx1.05010 xx −− − − −− =+−×−+ × −−+× + ×⋅−×⋅+× ⋅ (2) 3 12 3 32 22 1 2312 13 23 BS 0.290.025x0.098 x8.44610x7.975 10x0.021x0.021 x0.011 xx 0.017 xx0.013 xx − − =+−−+ ×− ×− −−⋅ + ⋅−⋅ (3) For EI, R2 = 0.761 For BD , R2 = 0.742 For BS, R2 = 0.706 3.2. Properties of the Extrudates of Rice and Sweet Potato Powder Various parameters of the 20 extrudates of rice and sweet potato were studied. Their colour profile is given  E. B. Hazarika et al. / Agricultural Sciences 4 (2013) 12-22 Copyright © 2013 SciRes. OPEN ACCESS Table 1. Experimental design fo r ext rusion experiment with coded and actu al variable levels. Sample cod es Coded Un coded x1 x2 x3 X1 X2 X3 RS(92:8)A −1 1 −1 200 130 80 RS(80:20)A −1 1 1 200 130 200 RS(86:14)A 1.682 0 0 468 120 140 RS(80:20)B 1 1 1 400 130 200 RS(86:14)B 0 0 0 300 120 140 RS(86:14)C 0 0 0 300 120 140 RS(80:20)C 1 −1 1 400 11 0 200 RS(86:14)D 0 0 0 300 120 140 RS(86:14)E 0 0 0 300 120 140 RS(92:8)B 1 1 −1 400 130 80 RS(86:14)F 0 0 0 300 120 140 RS(76:24) 0 0 1.682 300 120 240 RS(86:14)G 0 0 0 300 120 140 RS(86:14)H 0 1.682 0 300 137 140 RS(92:8)C −1 −1 −1 200 110 80 RS(86:14)I −1.682 0 0 132 120 140 RS(92:8)D 1 −1 −1 400 110 80 RS(80:20)D −1 −1 1 200 110 200 RS(96:4) 0 0 −1.682 300 120 40 RS(86:14)J 0 −1.682 0 300 103 140 x1 and X1, screw Speed (rpm); x2 and X2, extrusion temperature (˚C); x3 and X3, concen t ration of swee t pot at o powde r (g ∙kg−1); R denotes rice flour; S denotes sweet pota to . Table 2. Analysis of variance results for fitted models of product properties. Response Source df Sum of square Mean squares F-value P-value EI Regres sion 9 4.30 0.48 3.54 0.0307∗ Lack of Fit 5 0.40 0.080 0.42 0.8159 Pure error 5 0.95 0.19 Residual 10 1.35 0.13 Total 19 BD Regres sion 9 0.017 1.842 × 10 3.19 0.0426∗ Lack of Fit 5 2.519 × 10⁻³ 5.039 × 10⁻⁴ 0.77 0.6 078 Pure error 5 3.259 × 10⁻³ 6.519 × 10⁻⁴ Residual 10 5.779 × 10⁻³ 5.779 × 10⁻⁴ Total 19 BS Regres sion 9 0.16 0.017 2.67 0.0 708 Lack of Fit 5 0.028 5.564 × 10⁻³ 0.75 0.6203 Pure error 5 0.037 7.424 × 10⁻³ Residual 10 0.065 6.494 × 10 Total 19 ∗Sig nifica n t a t P < 0.05; df: degree of freedom. Table 3. Optimized parameters i n the response optimizer. Response Goa l Lower Limit Upper Limit Lower Weight Upper Weight Importance EI Maximum 4.388 6.22 1 1 3 BD Minimum 0.101 0.22 1 1 3 BS Minimum 0.085 0.46 1 1 3 Table 4. Optimized solution obtained using the response optimizer. Opt imal solution Predicted r esponses Desirability X1 (rpm) X2 (˚C) X3 (g/kg) EI BS, N/mm2 BD, g/cm3 400 130 150 5.84 0.13 0.12 0.84  E. B. Hazarika et al. / Agricultural Sciences 4 (2013) 12-22 Copyright © 2013 SciRes. OPEN A CCESS in Tabl e 5 and physical properties are given in Ta b le 6. The 3-D graphical representations of the 3 responses (ex- pansion index, bulk density and breaking strength) against different screw speeds (SS), barrel temperatures (BT) and feed composition (FCM) are given in Fig u re 1. T he water absorption index (WAI) and water solubility index (WSI) of the 20 samples are give n in Table 7. 3.3. Selection of Best-5 Extrudates Based on Their A ppearances Based on the appearence of the 20 samples, a score rangi ng fr om 1 t o 9 was give n to eac h sa mple as gi ven i n Ta b le 7 . The 5 samples that got the highest scores of 9 were selected for sensory evaluation and RVA studies. For convenience of terms, the product codes of the 5 samples with the highest score of 9 are changed as given in Table 8. 3.4. Pasting Profile of the Ex trudates The RVA study of the extrudates showing their peak, hold and fi na l visc o si tie s a long wit h t hei r b r ea kd o wn a nd setback values are given in Table 8. The Table shows Table 5. Color profile of the 20 extrudate samples developed from rice flour and sweet potato. Sample ∆E 0 0 0 RS(80:20)A 78.75 0.50 9.42 69.05 2.04 11.56 10.05 RS(86:14)A 76.58 0.26 8.93 65.65 2.91 12.17 11.70 RS(80:20)B 77.45 0.54 9.14 65.85 2.10 11.10 11.87 RS(86:14)B 75.97 0.40 8.76 67.34 0.94 9.33 8.67 RS(80:20)C 78.23 0.75 9.42 66.35 2.32 11.41 12.15 RS(86:14)D 76.33 1.09 10.24 64. 45 1.95 10. 45 11.91 RS(92:8)B 76.03 0.51 9.00 67.81 2.93 12.67 9.32 RS(76:24) 75.68 0.62 9.51 66.35 2.92 12.60 10.09 RS(86:14)G 75.97 0.40 8.76 67.34 0.94 9.33 8.67 RS(86:14)H 73.91 0.41 7.78 68.03 3.01 11.95 7.66 RS(92:8)C 75.76 0.39 8.91 67.41 1.07 9.59 8.41 RS(92:8)D 75.89 0.55 8.05 67. 76 2.13 10.94 8.77 RS(80:20)D 76.67 0.59 9.16 67.39 1.55 10.46 9.42 RS(96:4) 75.90 0.50 7.53 64. 43 1.07 8.93 11.57 RS(86:14)J 77.45 0.55 8.59 65.58 1.14 8.5 11.88 Table 6. Physical propert ies of the 20 extrudate sampl es made from rice flour and sweet potato. Sample Hardness (N) BS (N/mm2) EI (mm) BD (g/cm3) RS(92:8)A 12.15 ± 0 .11 0.21 ± 0.03 4.90 ± 0.48 0.14 ± 0.02 RS(86:14)A 20.42 ± 0.09 0.34 ± 0.04 5.00 ± 0.24 0.12 ± 0.0 RS(80:20)B 14.17 ± 0.01 0.26 ± 0.02 4.60 ± 0.43 0. 11 ± 0.01 RS(86:14)B 24.35 ± 0.16 0.37 ± 0.02 5.55 ± 0.33 0.14 ± 0.01 RS(86:14)C 22.36 ± 0.09 0.37 ± 0.05 5.00 ± 0.35 0.13 ± 0.01 RS(86:14)D 24.35 ± 0.16 0.37 ± 0.02 5.55 ± 0.33 0.14 ± 0.01 RS(86:14)E 22.36 ± 0.09 0.37 ± 0.05 5.00 ± 0.35 0.13 ± 0.01 RS(92:8)B 15.66 ± 0.25 0.26 ± 0.03 5.08 ± 0.04 0.11 ± 0.0 RS(86:14)F 14. 11 ± 0.03 0.22 ± 0.01 5.39 ± 0.36 0.13 ± 0.0 RS(86:14)G 31.21 ± 0.18 0.37 ± 0.02 4.51 ± 0.35 0.16 ± 0.01 RS(86:14)H 19.33 ± 0.14 0.31 ± 0.05 5.22 ± 0.28 0.12 ± 0.0 RS(92:8)C 11.97 ± 0.11 0.21 ± 0.03 4.77 ± 0.38 0.12 ± 0.01 RS(86:14)I 23.46 ± 0.52 0.37 ± 0.01 5.12 ± 0.18 0.17 ± 0.01 RS(80:20)D 14.54 ± 0.16 0.23 ± 0.02 5.34 ± 0.45 0.17 ± 0.01 RS(96:4) 19.24 ± 0.14 0.33 ± 0.04 4.82 ± 0.27 0.20 ± 0.0 1 RS(86:14)J 19.06 ± 0.28 0.32 ± 0.04 5.04 ± 0.42 0.19 ± 0.0  E. B. Hazarika et al. / Agricultural Sciences 4 (2013) 12-22 Copyright © 2013 SciRes. OPEN ACCESS Figure 1. The nine 3-D graphs showing changes in EI, BD and BS with respect to changes in screw speeds (SS), barrel temperatures (BT) and feed compo s ition (FCM). 4.5919 4.91182 5.23174 5.55166 5.87157 EI 200.00 250.00 300.00 350.00 400.00 110.00 115.00 120.00 125.00 130.00 A: SS B: BT 4.66461 4.80401 4.94341 5.08282 5.22222 EI 200.00 250.00 300.00 350.00 400.00 80.00 110.00 140.00 170.00 200.00 A: SS C: FCM 4.59567 4.85048 5.10529 5.3601 5.61491 EI 110.00 115.00 120.00 125.00 130.00 80.00 110.00 140.00 170.00 200.00 B: BT C: FCM 0.117484 0.135081 0.152679 0.170276 0.187874 BD 200.00 250.00 300.00 350.00 400.00 110.00 115.00 120.00 125.00 130.00 A: SS B: BT 0.153433 0.162587 0.171741 0.180895 0.190049 BD 200.00 250.00 300.00 350.00 400.00 80.00 110.00 140.00 170.00 200.00 A: SS C: FCM 0.126657 0.144459 0.162262 0.180065 0.197867 BD 110.00 115.00 120.00 125.00 130.00 80.00 110.00 140.00 170.00 200.00 B: BT C: FCM 0.130983 0.192157 0.253331 0.314505 0.375679 BS 200.00 250.00 300.00 350.00 400.00 110.00 115.00 120.00 125.00 130.00 A: SS B: BT 0.213751 0.238004 0.262257 0.28651 0.310762 BS 200.00 250.00 300.00 350.00 400.00 80.00 110.00 140.00 170.00 200.00 A: SS C: FCM 0.148583 0.205369 0.262155 0.318942 0.375728 BS 110.00 115.00 120.00 125.00 130.00 80.00 110.00 140.00 170.00 200.00 B: BT C: FCM 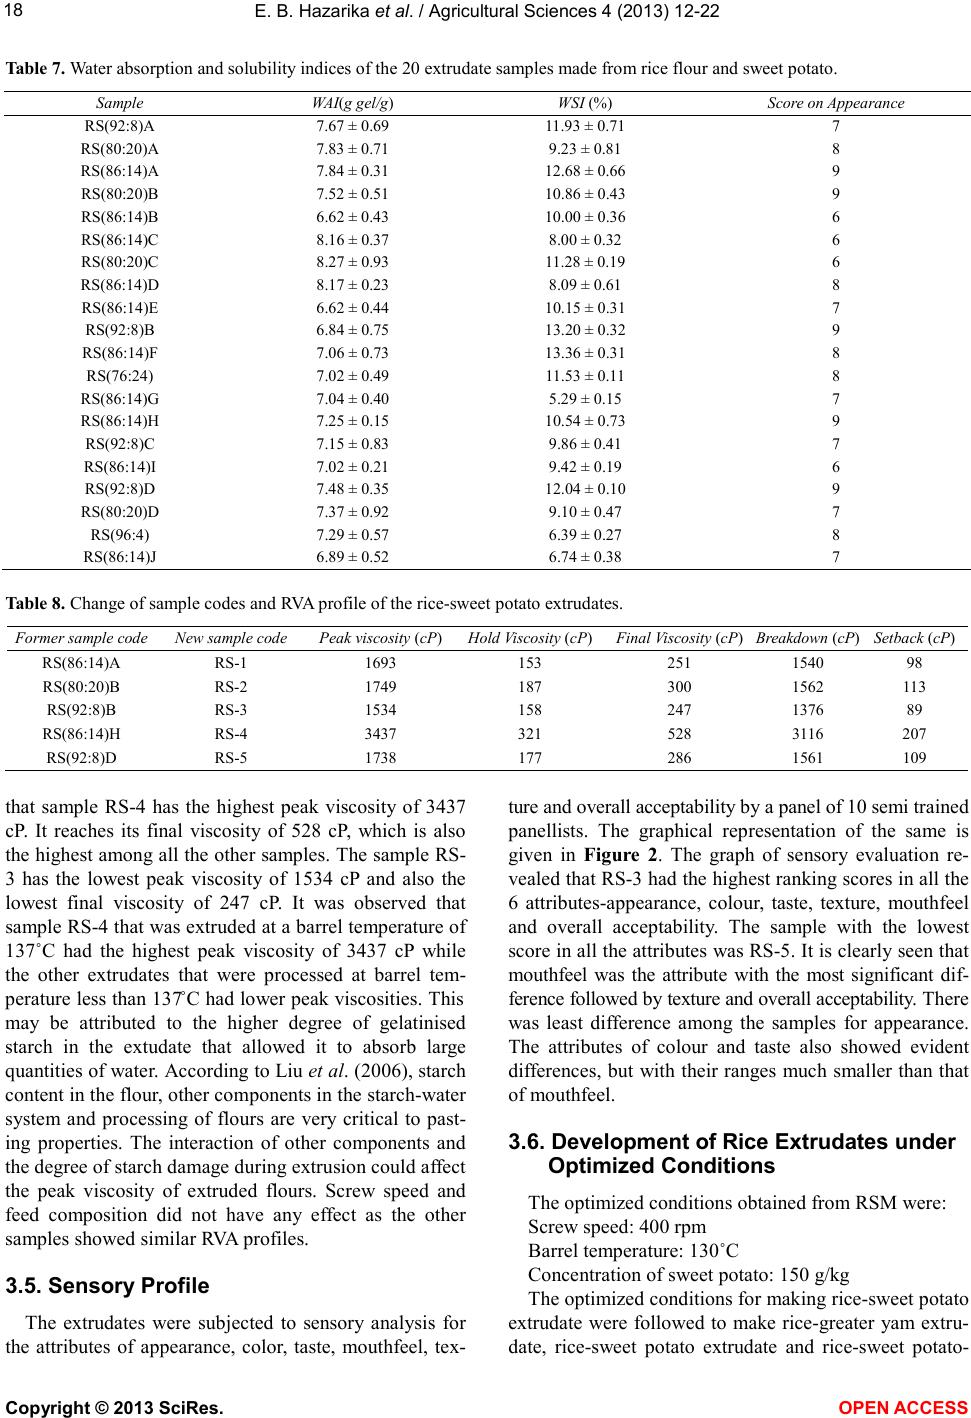 E. B. Hazarika et al. / Agricultural Sciences 4 (2013) 12-22 Copyright © 2013 SciRes. OPEN A CCESS Table 7. Water absorption and solubility indices of the 20 extrudate samples made from rice flour and sweet potato. Sample WA I(g gel/ g) WSI (%) Score on App earance RS(92:8)A 7.67 ± 0.6 9 11.93 ± 0.71 7 RS(80:20)A 7. 83 ± 0. 71 9.23 ± 0.81 8 RS(86:14)A 7. 84 ± 0. 31 12.68 ± 0.66 9 RS(80:20)B 7. 52 ± 0.51 10. 8 6 ± 0.43 9 RS(86:14)B 6. 62 ± 0.43 10. 0 0 ± 0.36 6 RS(86:14)C 8. 16 ± 0.37 8.00 ± 0. 3 2 6 RS(80:20)C 8. 27 ± 0.93 11.28 ± 0.19 6 RS(86:14)D 8. 17 ± 0. 23 8. 09 ± 0. 61 8 RS(86:14)E 6.62 ± 0.44 10. 1 5 ± 0.31 7 RS(92:8)B 6.84 ± 0.7 5 13.2 0 ± 0. 3 2 9 RS(86:14)F 7. 06 ± 0. 73 13.36 ± 0.31 8 RS(76:24) 7.02 ± 0. 4 9 11.53 ± 0.11 8 RS(86:14)G 7. 04 ± 0. 40 5. 29 ± 0. 15 7 RS(86:14)H 7. 25 ± 0. 15 10.54 ± 0.73 9 RS(92:8)C 7.15 ± 0.8 3 9 . 86 ± 0.41 7 RS(86:14)I 7. 02 ± 0. 21 9. 42 ± 0. 19 6 RS(92:8)D 7.48 ± 0.3 5 12.0 4 ± 0.10 9 RS(80:20)D 7. 37 ± 0. 92 9. 10 ± 0. 47 7 RS(96:4) 7.29 ± 0. 5 7 6.39 ± 0. 2 7 8 RS(86:14)J 6.89 ± 0. 5 2 6 . 74 ± 0.38 7 Table 8. Change of sample codes and RVA profile of the rice-sweet potato extru dates. Former sample code New s amp le co de Peak viscosity (cP) Hold Viscosity (cP) Final Viscosity (cP) Breakdown (cP) Set b ack (cP) RS(86:14)A RS-1 1693 153 251 1540 98 RS(80:20)B RS-2 1749 187 300 1562 113 RS(92:8)B RS-3 1534 158 247 1376 89 RS(86:14)H RS-4 3437 321 528 3116 207 RS(92:8)D RS-5 1738 177 286 1561 109 that sample RS-4 has the highest peak viscosity of 3437 cP. It reaches its final viscosity of 528 cP, which is also the hi ghest a mong all the othe r sample s. T he sample RS- 3 has the lowest peak viscosity of 1534 cP and also the lowest final viscosity of 247 cP. It was observed that sample RS -4 that was extruded at a barrel temperature of 137˚C had the highest peak viscosity of 3437 cP while the other extrudates that were processed at barrel tem- perature less than 137˚C had lower peak viscosities. This may be attributed to the higher degree of gelatinised starch in the extudate that allowed it to absorb large quantities of wate r. Accord ing to Liu et al. (2006), starch conte nt in the fl our, othe r comp one nts i n the st ar ch -water system and processing of flours are very critical to past- ing properties. The interaction of other components and the degree of starch damage during extrusion could affect the peak viscosity of extruded flours. Screw speed and feed composition did not have any effect as the other samples showed similar RVA profiles. 3.5. Sensory Profile The extrudates were subjected to sensory analysis for the attributes of appearance, color, taste, mouthfeel, tex- ture and overall acceptability by a panel of 10 semi trained panellists. The graphical representation of the same is given in Figure 2. The graph of sensory evaluation re- vealed that R S-3 ha d the hi ghe st ra nki ng scores in all the 6 attributes-appearance, colour, taste, texture, mouthfeel and overall acceptability. The sample with the lowest score in all the attributes was RS-5. It is clearly seen that mouthfeel was the attribute with the most significant dif- ference follo wed b y textur e and over all a ccep tab ilit y. There was least difference among the samples for appearance. The attributes of colour and taste also showed evident differences, but with their ranges much smaller than that of mouthfeel. 3.6. Development of Rice Extrudates under Optimized Conditions The optimized conditions obtained from RSM were: Screw speed: 400 rpm Barrel temperature: 130˚C Concentratio n o f sweet potato: 150 g/kg The optimized conditions for making rice-sweet potato extrudate were followed to make rice-greater yam extru- date, rice-sweet potato extrudate and rice-sweet potato- 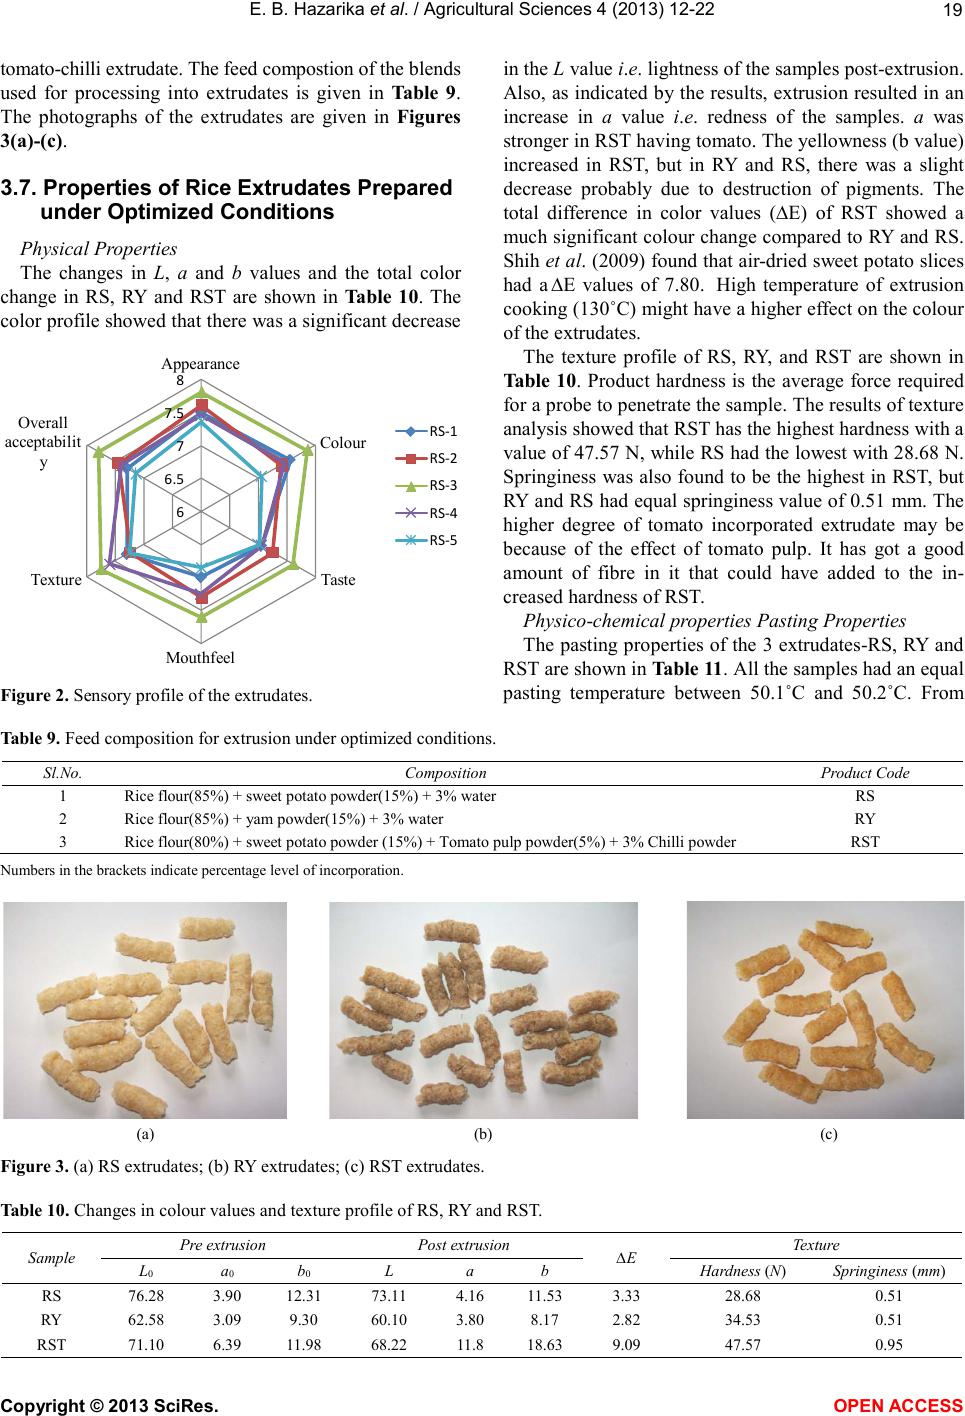 E. B. Hazarika et al. / Agricultural Sciences 4 (2013) 12-22 Copyright © 2013 SciRes. OPEN ACCESS tomato-chilli extrudate. The feed compostion of the blends used for processing into extrudates is given in Ta bl e 9. The photographs of the extrudates are given in Figures 3(a)-(c). 3.7. Properties of Rice Extrudates Prepared under Optimized Conditions Physical Properties The changes in L, a and b values and the total color change in RS, RY and RST are shown in Table 10. The color profile showed that there was a significant decrease Fi g ure 2. Sensory profile of the extrudates. in the L value i.e. lightness of the sa mples post-extrusion. Also, as indicated by the results, extrusion resulted in an increase in a value i.e. redness of the samples. a was stro nger i n R ST ha vi n g to mat o . The yel lowness ( b value) increased in RST, but in RY and RS, there was a slight decrease probably due to destruction of pigments. The total difference in color values (∆E) of RST showed a much significant colour change compared to RY and RS. Shih et al. (20 09) fo und that air-dried sweet pota to slices had a ∆E values of 7.80. High temperature of extrusion cooking (130˚C) mi ght ha ve a hi ghe r effect o n the co lour of the extrudates. The texture profile of RS, RY, and RST are shown in Table 10. Product hardness is the average force required for a probe to penetrate the sample. T he results of texture analysis showed that RST has the highest ha rdness with a value of 47.57 N, while RS had the lo west with 28.68 N. Springiness was also found to be the hi ghest in RST, b ut RY and RS had equal springiness value of 0.51 mm. The higher degree of tomato incorporated extrudate may be because of the effect of tomato pulp. It has got a good amount of fibre in it that could have added to the in- creased hardness of RST. Physico-chemical properties Pasting Properties The pasting properties of the 3 extrudates-R S , RY a n d RST are shown in Table 11. All the samples had an equal pasting temperature between 50.1˚C and 50.2˚C. From Table 9. Feed composition for extrusion under optimized conditions. Sl.No. Composition Product Code 1 Rice flour(85%) + sweet potato powder(15%) + 3% wat er RS 2 Rice flour(85%) + yam powder(15%) + 3% water RY 3 Rice flour(80%) + sweet potato powder (15%) + Tomato pulp powde r ( 5% ) + 3% Chilli powder RST Numbers in the brackets indicate percentage level of incorporation. (a) (b) (c) Figure 3. (a) RS extrudates; (b) RY extrudates; (c) RST extrudates. Table 10. Changes in colour values and texture profile of RS, RY and RST. Sample Pre extrusion Post extrusion ∆E Texture L0 a0 b0 L a b Hardness (N) Springiness (mm) RS 76.28 3.90 12.31 7 3.11 4.16 11.53 3.33 28.68 0.51 RY 62.58 3.09 9.30 60. 10 3.80 8.17 2.82 34.53 0.51 RST 71.10 6.39 11.98 68.22 11 .8 1 8.63 9.09 47.57 0.95 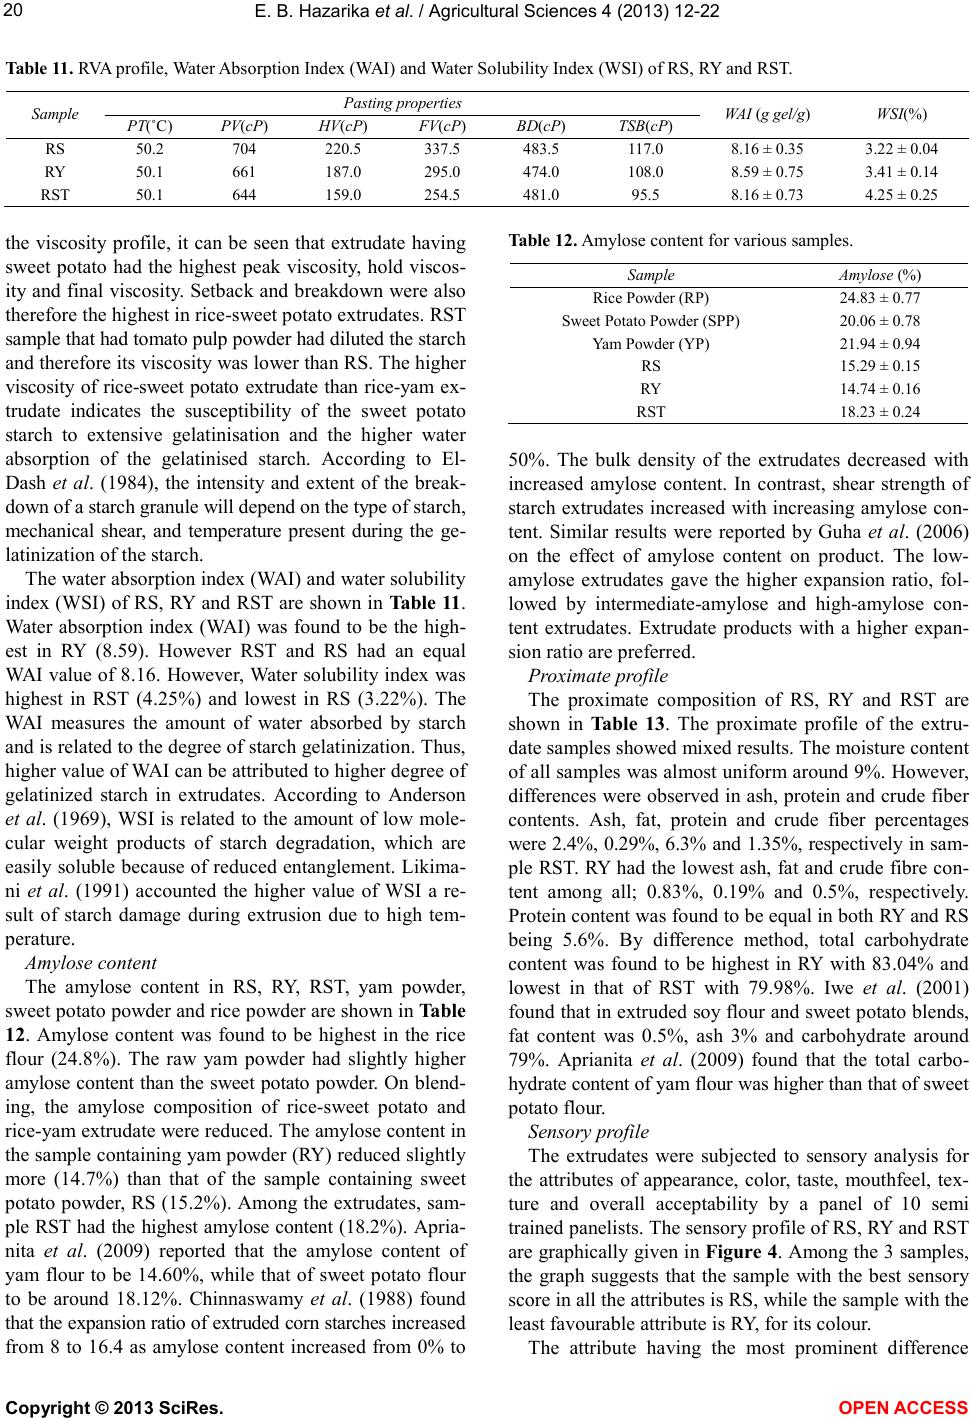 E. B. Hazarika et al. / Agricultural Sciences 4 (2013) 12-22 Copyright © 2013 SciRes. OPEN A CCESS Table 11. RVA profile, Water Absorption Index (WAI) and Water Solubility Index (WSI) of RS, RY and RST. Sample Pasting properties WA I (g gel/ g) WSI(%) PT(˚C) PV(cP) HV(cP) FV(cP) BD(cP) TSB(cP) RS 50.2 704 220.5 337.5 483.5 117. 0 8.16 ± 0. 3 5 3.22 ± 0. 0 4 RY 50.1 661 187.0 295.0 474.0 108.0 8.59 ± 0.75 3. 41 ± 0. 14 RST 50.1 644 159.0 254.5 481.0 95.5 8.16 ± 0.73 4.25 ± 0.25 the viscosity profile, it can be seen that extrudate having sweet potato had the highest peak viscosity, hold viscos- ity and final viscosity. Setback and breakdo wn were also therefore the hi ghest in rice-sweet potato extrudates. RST sample tha t had to mato p ulp powder had diluted the starch and therefore its viscosity was lo wer than RS. The higher viscosity of rice-sweet potato extrudate than rice-yam ex- trudate indicates the susceptibility of the sweet potato starch to extensive gelatinisation and the higher water absorption of the gelatinised starch. According to El- Dash et al. (1984), the intensity and extent of the break- down of a starch granule will depend on the type of starch, mec ha nic al shear, and temperature present during the ge- latinization of the starch. The water absorption index (WAI) and water solubility index ( WSI) o f RS, RY and RST are s hown in Table 1 1. Water absorption index (WAI) was found to be the high- est in RY (8.59). However RST and RS had an equal WAI value of 8.16. However, Water solubility index was highest in RST (4.25%) and lowest in RS (3.22%). The WAI measures the amount of water absorbed by starch and is related to the degree of starch gelatinization. T hus, higher value of WAI can be attributed to higher degree of gelatinized starch in extrudates. According to Anderson et al. (1969), WSI is related to the amount of low mole- cular weight products of starch degradation, which are easily soluble because of reduced entanglement. L ikima- ni et al. (1991) accounted the higher value of WSI a re- sult of starch damage during extrusion due to high tem- perature. Amylose content The amylose content in RS, RY, RST, yam powder, sweet potato powder and rice powder are shown in Table 12. Amylose content was found to be highest in the rice flour (24.8%). The raw yam powder had slightly higher amylo se content than the sweet potato powder. On blend- ing, the amylose composition of rice-sweet potato and rice-yam extrudate were reduced. The amylose content in the sample containing yam powder (RY) reduced slightly more (14.7%) than that of the sample containing sweet potato powder, RS (15.2%). Among the extrudates, sam- ple RST had the highest amylose content (18.2%). Apri a- nita et al. (2009) reported that the amylose content of yam flour to be 14.60%, while that of sweet potato flour to be around 18.12%. Chinnaswamy et al. (1988) found that the expansion ratio of extruded corn starches increased from 8 to 16.4 as amylose content increased from 0% to Table 12. Amylose content for various samples. Sample Amylose (%) Rice Powder (RP) 24.8 3 ± 0.77 Sweet Potato Powder (SPP) 20.0 6 ± 0.78 Yam Powder (YP) 21.94 ± 0.94 RS 15.29 ± 0.15 RY 14.7 4 ± 0. 16 RST 18.2 3 ± 0. 24 50%. The bulk density of the extrudates decreased with increased amylose content. In contrast, shear strength of starch extrudates increased with increasing amylose con- tent. Similar results were reported by Guha et al. (2006) on the effect of amylose content on product. The low- amylose extrudates gave the higher expansion ratio, fol- lowed by intermediate-amylose and high-amylose con- tent extrudates. Extrudate products with a higher expan- sion ratio are preferred. Proximate p rofile The proximate composition of RS, RY and RST are shown in Table 13. The proximate profile of the extru- date samples showed mixed results. The moisture content of all samples was almost uniform around 9%. However, differences were observed in ash, protein and crude fiber contents. Ash, fat, protein and crude fiber percentages were 2.4%, 0.29%, 6.3% and 1.35%, respectively in sam- ple RST. RY had the lowest ash, fat and crude fibre con- tent among all; 0.83%, 0.19% and 0.5%, respectively. Protein content was found to be equal in both RY and RS being 5.6%. By difference method, total carbohydrate content was found to be highest in RY with 83.04% and lowest in that of RST with 79.98%. Iwe et al. (2001) found that in extruded soy flour and sweet potato blends, fat content was 0.5%, ash 3% and carbohydrate around 79%. Aprianita et al. (2009) found that the total carbo- hydr a te c o n te nt of ya m f lo ur wa s hi g her t ha n t ha t o f sweet potato flour. Sensory profile The extrudates were subjected to sensory analysis for the attributes of appearance, color, taste, mouthfeel, tex- ture and overall acceptability by a panel of 10 semi trained panelis ts. T he se nsor y pro file of RS, RY and RST are graphic ally gi ven in F igu re 4. Among t he 3 sa mples, the graph suggests that the sample with the best sensory score in all the attributes i s RS, while the sample with the least favourable a ttr ibute is RY, for its colour. The attribute having the most prominent difference  E. B. Hazarika et al. / Agricultural Sciences 4 (2013) 12-22 Copyright © 2013 SciRes. OPEN ACCESS Table 13. Proximate composition of RS, RY and RST. Composition (w. b.) Fat % 0.22 ± 0.01 0.19 ± 0.08 0.26 ± 0.01 Total carbohydrate % (by difference) Figure 4. Graphical representation of the sensory profile of the extrud ates RS, RY and RST. among the samples is colour, followed by appearance. However, as it is evident, there are no significant differ- ences in the scores of the 3 samples in the other 4 attributes namely-taste, mouthfeel, texture and overall acceptability. RS had the b est ta ste a mong a ll. RST was the o ne getti ng the least score in taste, but had the highest score in ap- pearance. Antioxidant Profile The results of antioxidant properties of RS, RY and RST are given in Table 14. By carrying out the radical scavenging acti vity test, DP PH and the FRAP test for the presence of antioxidants, the antioxidant content in the extrudates were found to be very low. Both the tests showed a similar result for all the 3 extrudates where it was ob- served that the radical scavenging activity was highest in RST than the other two being 3.6%. RY had a higher radical scavenging activity at 3.22% than RS at 1.36%. Similarly the Ferric reducing antioxidant power was found to be higher in RST being 218 μM of Fe/100 g than the other two. RY and RS had a closer FRAP values being 148 and 118 μM of Fe/100 g. The higher antioxi- dant activity in RST is due to the presence of tomato pulp powder in its co mposition that naturally has a good amount of antioxida nts in it. The low antioxidant conte nt in the extrudates is due to the fact that the molecules acting as antioxidants that were present in the raw sam- ples are generally destroyed during the high temperature used in extrusion cooking. According t o Sh ih et al. (2009), temperatures greater than 6 0˚C is regar ded as unfa voura- ble, due to the possibility of inducing oxidative conden- sation or decomposition of thermolabile compounds, such as catechin. A similar decrease in reducing power has been Table 14. Antioxidant profile for RS, RY and RST. Sample DPPH (% radica l scavenging activity) FRAP (µM of Fe/100g sample) RS 1.36 ± 0.08 118 ± 0.12 RY 3. 22 ± 0. 16 14 8 ± 0.11 RST 3.60 ± 0. 1 5 21 8 ± 0.14 reported by other authors like Xu et al. (2008) upon ther- mal processing in different cereals. 4. CONCLUSION The studies have shown that both sweet potato (Ipo- moea batatas) and greater yam tubers (Dioscorea alata) can be utilized for development of ready to eat (RTE) products. Both the extruded products of rice incorporated with sweet potato powder and yam powder have shown to possess good functional properties and desirable nutri- tive value. RTE breakfast cereal products available in the market are generally expensive, so if such products are developed that are incorporated with locally available vegetables, not only those products can be made afforda- ble enough, but it will also help the local farmers and traders in improving their economy and vegetation. Le- vels of fat, carbohydrate, protein and kilocalories of ener- gy that these products were carrying, were found to be comparable with that of a popular RTE breakfast product available in the market. So it can be concluded fr om this study that nutritionally enhanced breakfast cereals can be made from rice-sweet potato extrudates and rice-yam ex- trudates with addition of mine rals and vitamins. REFERENCE S [1] Anderson, R.A., Conway, H.F., Pfeifer, V.F. and Griffin, E.L. (1969) Gelatinization of corn grits by roll and extru- sion cooking. Cereal Science Today, 14, 4-12. [2] Aprianita, A., Purwandari, U., Watson, B. and Vasiljevic, T. (2009) Physico-chemical properties of flours and starches from selected commercial tubers available in Australia. International Food Research Journal, 16, 507- 520. [3] Benzie, I.F.F. and Strain, J.J. (1999) Ferric reducing/an- tioxidant power assay: direct measure of total antioxidant activity of biological fluids and modified version for si- multaneous measurement of total antioxidant power and  E. B. Hazarika et al. / Agricultural Sciences 4 (2013) 12-22 Copyright © 2013 SciRes. OPEN A CCESS ascorb ic acid concent ration. Methods in Enzymology, 299, 15-27. http://dx.doi.org/10.1016/S0076-6879(99)99005-5 [4] Bhatnagar, S. and Hanna, M.A. (1995) Properties of ex- truded starch based plastic foams. Industrial Crops and Products, 4, 71-77. http://dx.doi.org/10.1016/0926-6690(95)00016-6 [5] Brand-Williams, W., Cuvelier, M.E. and Berset, C. (1995) Use of free radical metho d to evaluate an tio xidan t activit y. Leben sm i t t el Wissenschaftund Technologies, 28, 25-30. [6] Chinnaswamy, R. and Hanna, M.A. (1998) Relationship between amylose content and extrusion-expansion prop- erties o f co r n-starches. Cereal Chemistry, 65, 138-143. [7] Chiu, H.W., et al. (2013) Process optimization by re- sponse surface methodology and characteristics investi- gation of corn extrudate fortified with yam (Dioscorea alata L.). Foo d Bioprocess Technology, 6, 1494-1504. http://dx.doi.org/10.1007/s11947-012-0894-6 [8] Dansby, M.Y. and Benjamin, A.C.B. (2003) Physical properties and sixth graders’ acceptance of an extruded read y-to-eat sweet potato breakfast cereal. Journal of Food Science, 68, 2607-2612. http://dx.doi.org/10.1111/j.1365-2621.2003.tb07069.x [9] Di ng, Q., Ainsworth, P., Tucker, G. and Marso n, H. (20 05 ) The effect of extrusion conditions on the physicochemical properties and sensory characteristics of rice-based ex- panded snack. Journal of Food Engineering, 66, 283-289. http://dx.doi.org/10.1016/j.jfoodeng.2004.03.019 [10] El-Dash , A.A., Gonzales, R. and Ciol, M. (1984) Re- sponse surface methodology in the control of thermoplas- tic extrusion of starch. In: Jowitt, R., Ed., Extrusion Cooking Technology, Elsevier Applied Science, London, 51-74. [11] Guha, M., Ali, S.Z. and Bhattacharya, S. (19 98) Effect of barrel temperature and screw speed on rapid viscoana- lyser pasting behaviour of rice extrudate. International Journal of Food Science and Technology, 33, 259-266. http://dx.doi.org/10.1046/j.1365-2621.1998.00189.x [12] I we, M .O., Van Zuilichem, D. J. and Ngoddy, P.O . (200 1) Extrusion cooking of blends of blends of soy flour and sweet potato flour on specific mechanical energy (SME), extrudate temperature and torque. Journal of Food Proc- essing and Preservation, 25, 251-266. http://dx.doi.org/10.1111/j.1745-4549.2001.tb00459.x [13] Iwe, M.O., Wolters, I., Gort, G., S to l p , W. and Van Zui- lichem, D.J. (1998) Behaviour of gelatinisation and vis- cosity in soy-sweet potato mixtures by single screw ex- trusion: A res pon se surface analysis. Journal of Food En- gineering, 38, 369-379. http://dx.doi.org/10.1016/S0260-8774(98)00126-5 [14] Likimani, T.A., Sofos, J.N., Maga, J.A. and Harper, J.M. (1991) Extrusion cooking of corn/soybean mix in pres- ence of th ermostab le a-amylase. Journal of Fo od Scien ce, 56, 99-105. http://dx.doi.org/10.1111/j.1365-2621.1991.tb07985.x [15] Oke, M.O., Awonorin, S.O., Sanni, L.O., Asiedu R. and Aiyedun, P.O. (2012) Effect of extrusion vari ables on ex- trudates properties of water yam flour—A response sur- face analysis. Journal of Food Processing and Preserva- tion, Early View Online. [16] Shih, M., Kuo, C. and Chiang, W. (2009) Effects of dry- ing and extrusion on colour, chemical composition, anti- oxidant activities and mitogenic response of spleen lym- phocytes of sweet potatoes. Food Chemistry, 117, 11 4- 121. http://dx.doi.org/10.1111/j.1745-4549.2011.00661.x http://dx.doi.org/10.1016/j.foodchem.2009.03.084 [17] Singh, J., Anne Dartois, A. and Kaur, L. (2010) Starch digestibility in food matrix: A review. Trends in Food Scien ce & Technology, 21, 168-180. http://dx.doi.org/10.1016/j.tifs.2009.12.001 [18] Sowbahagya, C. M. and Bhattacharya, K.R. (1979) Sim- plified determination of amylose in milled rice. Starch/ Starke, 31, 159-163. http://dx.doi.org/10.1002/star.19790310506 [19] T h y mi, S., Krokida, M.K., Pappa, A. and Mar inos -Kouris, D. (2008) Melting temperatures of extruded products with texturized proteins. International Journal of Food Prop- erties, 11, 1-12. http://dx.doi.org/10.1080/10942910601118722 [20] Xu, B. and Chang, S.K.C. (2008) Characterization of phenolic substances and antioxidant properties of food soybeans grown in the North Dakota-Minnesota region. Journal of Agricultural Food Chemistry, 56, 9102-9113. http://dx.doi.org/10.1021/jf801451k [21] Yagci, S. and Gogus, G. (2008) Response surface metho- dology for evaluation of physical and functional proper- ties of extruded snack foods developed from food-by- products. Journa l of Food Engineering, 86, 12 2-132. http://dx.doi.org/10.1016/j.jfoodeng.2007.09.018
|