 Vol.4, No.9B, 5-11 (2013) Agricultural Sciences http://dx.doi.org/10.4236/as.2013.49B002 Copyright © 2013 SciRes. OPEN ACCESS Kinetics of medium-temperature α-amylase hydrolyzed Huai yam powder Juan Miao1, Yunchang Fan1, Jingjing Li1, Dexue Fu2* 1Department of Physics and Chemistry, Henan Polytechnic University, Jiaozuo 454000, China 2Jiaozuo University, Jiaozuo 454000, China; *Corresponding Author: dexuefu@163.com Received June 2013 AB STRACT In order to learn the enzymatic char acteristics of Huai yam powder with medium-temperature α- amylase, effects of substrate concentration, en- zyme concentration, pH and temperature were investigated. T h e Michealis-M enten equation was used to fit the kineti cs o f the hy d rolysis reaction. Experimental results indicate that maximum rate (Vm) is 3.1588 mg/mL·min under the condition of 70˚C, pH 7.0 and 0.0200 mg/mL of enzyme con- centra tion. The Michealis consta nt (Km) is 6.6641 mg/mL. The kinetic model, including the factors such as substrate concentration, enzyme con- centration and temp erature, was established for the hydrolysis reaction under the temperature range from 40˚C - 70˚C. Keywords: Huai Yam; Medium-Temperature α-Amylase; Hydrolysis; Kinetics 1. INTRODUCTION Yam is the tuber of dioscoreaceae plant widel y planted in China, and is very rich in resources. Jiaozuo city, He- nan pr o vinc e, i s t he tr ad it ional ge nuine pro d ucing area of yam, commonly called Huai yam, and Huai Yam is also one of four famous Huai drugs. Content of amylum in fresh yam is up to 20% - 30% [1-3] and more than 70% in dried yam [4,5]. At present, studies on amylum are mainly focused on corn and wheat [6,7], and few research pares are involved in the yam, especially Huai yam. Me- dium temperature α-amylase can hydrolyze amylum with high efficiency. Hydrolysis products include dextrin, oli- gosaccharide, maltose and glucose with the advantages of mild reaction conditions, cost-effective and just simple equipment involved [8-10]. In this work, parameters af- fecting the reaction rate of medium-temperature α-amy- lase were systematically investigated. The hydrolysis ki- netic model of medium-temperature α-amylase was de- duced, which provides theoretical reference for the hy- drolysis and application of Huai yam. 2. MAT ERIALS AND INSTRUMENTAL 2.1. Materials Huai yam (Yuecun Countryside, Wen County, Jiaozuo City, China), medium-temperature α-amylase (2000 U/g, Fuyuan Biology Technology Co.,Ltd., Zhengzhou, China), glucose (Sinop harm. Chemical Reagent Co.,Ltd, Shanghai, China) were used as received. Other chemicals are all analytical grade. Deionized water was used throughout experiments. 2.2. Instrumental pH values were measured by a pH meter (Leici In- strument Co., Ltd., Shanghai, China). The UV-Vis spec- tra were performed on a UV-1900 spectrophotometer (P urkinje General Instrument Co., Ltd., China ). 2.3. Hydrolysis An appropriate amount of Huai yam powder was weighed and to prepare 200 mL slurry. After adjusting pH, medium-temperature α-amylase was added to hy- drolyze Huai yam. 2.4. Sample Preparation An amount of Huai yam were dried and ground to 100 mesh. After hydrolysis for a certain time, the medium- temperature α-amylase was inactive. After centrifuging, the supertant was diluted to 250 mL. Content of gross sugar was measured by phenol-sulfuric acid method [11]. 3. RESULTS AND DISCUSSION 3.1. Effect of Substrate Concentration on the Reaction Rate In order to investigate the effect of substrate concen- tration on the reaction rate, a series of 200 mL of sub- strate aqueous solutions (2.5, 5, 7.5, 10, 12.5, 15, 20 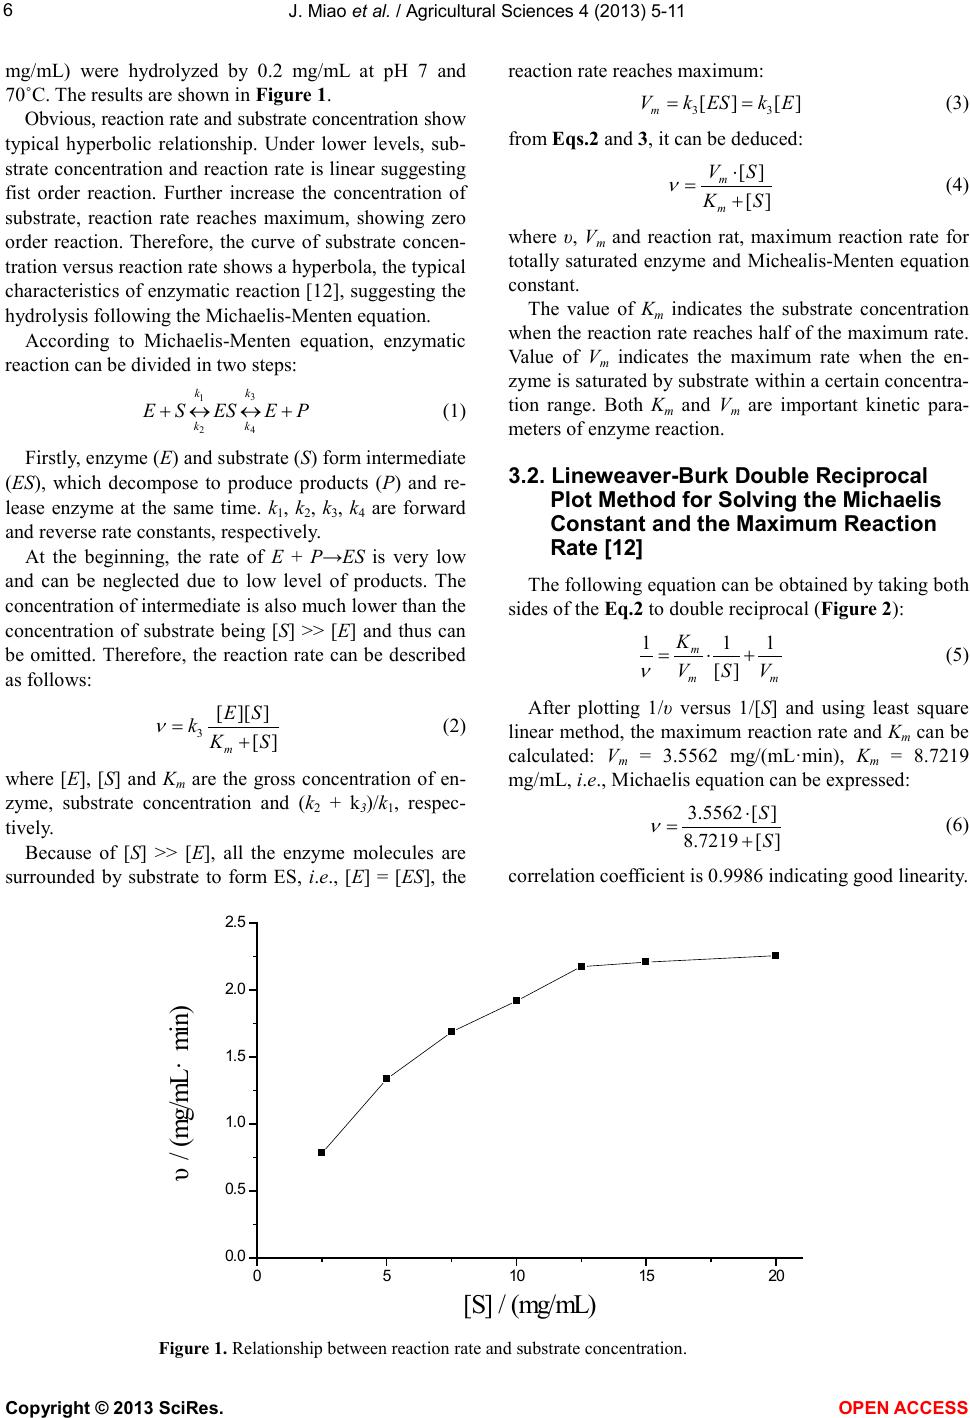 J. Miao et al. / Agricultural Sciences 4 (2013) 5-11 Copyright © 2013 SciRes. OPEN ACCESS mg/mL) were hydrolyzed by 0.2 mg/mL at pH 7 and 70˚C. The results are shown in Figure 1. Obvious, reaction rate and sub strate conce ntration show typical hyperbolic relationship. Under lower levels, sub- strate concentration and reaction rate is linear suggesting fist order reaction. Further increase the concentration of substrate, reaction rate reaches maximum, showing zero order reaction. Therefore, the curve of substrate concen- tration versus reaction rate shows a hyperbola, the typical characteristics of enzymatic reaction [12], suggesting the hydrolysis following the Mic haelis-Menten e quatio n. According to Michaelis-Menten equation, enzymatic reaction can be divided in two steps: 3 1 24 k k kk +↔ ↔+ (1) First ly, enzyme (E) and substrate (S) form intermediate (ES), which decompose to produce products (P) and re- lease enzyme at the same time. k1, k2, k3, k4 are forward and reverse rate constants, respectively. At the beginning, the rate of E + P→ES is very low and can be neglected due to low level of products. The concentratio n of inter mediate is also much lo wer than the concentration of substrate being [S] >> [E] and thus can be omitted. Therefore, the reaction rate can be described as follows: (2) where [E], [S] and Km are the gross concentration of en- zyme, substrate concentration and (k2 + k3)/k1, respec- tively. Because of [S] >> [E], all the enzyme molecules are surrounded by substrate to form ES, i.e., [E] = [ES], the reaction rate reaches maximum: (3) from Eqs.2 and 3, it can be deduced: (4) where υ, Vm and reaction rat, maximum reaction rate for totally saturated enzyme and Michealis-Menten equation const ant. The value of Km indicates the substrate concentration when the reaction rate reaches half of the maximum rate. Value of Vm indicates the maximum rate when the en- zyme is saturated by substrate within a certain concentra- tion range. Both Km and Vm are important kinetic para- meters of enzyme reaction. 3.2. Lineweaver-Burk Double Reciprocal Plot Method for Solving the Michaelis Constant and the Maximum Reaction Rate [12] The following equation can be obtained by taking both sides of the Eq.2 to double reciprocal (Figure 2): (5) After plotting 1/υ versus 1/[S] and using least square linear method, the maximum reaction rate and Km can be calculated: Vm = 3.5562 mg/(mL·min), Km = 8.7219 mg/mL, i.e., Michaelis equation can be expressed: (6) correla tion coefficient is 0.9986 ind ic a ting good linearity. Figure 1. Relations hip between reaction rate and substrate concentration . 05 10 15 20 0. 0 0. 5 1. 0 1. 5 2. 0 2. 5 υ/ (mg/mL·min) [S] / (mg/mL)  J. Miao et al. / Agricultural Sciences 4 (2013) 5-11 Copyright © 2013 SciRes. OPEN ACCESS 3.3. Wilkinson Statist ical Method for So lving the Michaelis Constant and the Maximum Reaction Rate [13] Wilkinson statistica l method include s two steps: o ne is estimation of resolutions with nonlinear square method; another is to obtain exact resolutions with Taylor expansion. a) Estimatio n: from Table 1, it can be obtained: = 4.3131 = 3.1724 (mg/mL·min); = 6.6641 (mg/mL) where and are the estimation value of maxi- mum reaction rate and Michaelis constant, respectively. b) Precision resolution: from Table 2, it can be de- duced: = 2.3216 × 10⁵; Figure 2. Lineweaver-Burk plot of medium-temperature α-amylase hydrolyzing Huai yam. Table 1. Estimated resolutions by Wilki ns on m e thod. No. [S](mg/mL) υ (mg/mL·min) X = υ2 Y = υ2/[S] υX X2 υY XY Y2 1 2.5 0.7825 0.6123 0.2449 0.4791 0.3749 0.1916 0.1500 0.0600 2 5 1.3363 1.7857 0.3571 2.3862 3.1887 0.4772 0.6377 0.1275 3 7.5 1.6884 2.8507 0.3801 4.8131 8.1265 0.6418 1.0836 0.1445 4 10 1.9195 3.6845 0.3685 7.0724 13.5755 0.7073 1.3577 0.1358 5 12.5 2.1762 4.7358 0.3 789 10.3060 22.4278 0.8246 1.7944 0.1 436 6 15 2.2093 4.8810 0.3254 10.7836 23.8242 0.7189 1.5883 0.1059 7 20 2.2569 5.0936 0.2547 11.4957 25.9448 0.5748 1.2973 0 .0649 Σ 47.3361 97.4624 4.1362 7.9090 0.7822 Symbol α β γ δ ε Table 2. A ccurate resolutions by Wilkins on m e thod. No. [S] + [S] f f' f2 f'2 ff' υf υf' 1 9.1641 7.931 0.8654 −0.0944 0.7489 6 2.9008 −0.0817 0.6772 −0.0739 2 11.6641 15.862 1.3599 −0.1166 1.8493 251.603 −0.1586 1.8172 −0.1558 3 14. 1641 23.793 1.6798 −0.1186 2.8217 566.10 68 −0.1992 2.8362 −0.2002 4 16. 6641 31.724 1.9037 −0.1142 3.6241 1006.4 122 −0.2174 3.6542 −0.2192 5 19. 1641 39.655 2.0692 −0.108 4.2816 1572.5 19 −0.2235 4.503 −0.235 6 21. 6641 47.586 2.1965 −0.10 14 4.8246 2264.4274 −0.2227 4.8527 −0.224 7 26. 6641 63.448 2.3795 −0.08 92 5.662 4025.6487 −0.21 22 5.3703 −0.2013 Σ 23.8122 9749 .6179 −1.3153 23.7108 −1.3094 Symbol α' β' γ' δ' ε' Note: f = [S]/([S] + 0 m K); f' = 0 m V− [S]/([S] + 0 m K)2. 0.0 0.1 0.2 0.3 0.4 0.5 0. 0 0. 4 0. 8 1. 2 1. 6 y =2.4526x + 0.2812 R2=0.9972 1/υ/(mL·ming/mg) 1 /[S ] / (mL/mg )  J. Miao et al. / Agricultural Sciences 4 (2013) 5-11 Copyright © 2013 SciRes. OPEN ACCESS = 0.9957; = 3.0671 × 10−8 = 3.1588 (mg/mL∙min); = 6.6641 (mg/mL) where b1and b2 are the rectified constants of Vm and Km, respectively, during the calculation process, Vm is the precision resolution of maximum reaction rate, Km is the precision resolution of Michaelis constant. 3.4. Comparison of L ineweaver-Burk Double Reciprocal Plot and Wilkinson Statistical Methods There exists differences in the values of Vm and Km between Lineweaver-Burk double reciprocal plot and Wi l- kinson statistical methods (Ta b le 3). For the former, the experimental data excessively focus under the left of the line. Data of lower substrate concentration have larger errors after reciprocal and thus resulting in larger error. Although Wilkinson statistical method is closer to the actual results, but complex calculation, tedious process, limit its applica tion [14-16]. According to results from experiments, Wilkinson me- thod is adopted to calculate Vm and Km (Vm = 3.1588 mg/mL∙min, Km = 6.6641 mg/mL). 3.5. Effect of Enzyme Concentration on Reaction Rate A series of enzyme solutions (0.050, 0.100, 0.150, 0.200, 0.250 mg/mL) were used to hydrolyze abundant substrate at pH 7 and 70˚C. The results are shown in Figure 3. Obviously, the concentration of enzyme is li- near to the reaction rate. In enzyme reaction, enzyme interacts with substrate to form intermediate complex, which converts to products and releases enzyme. Under a certain s yste m, if the sub strat e i s fully e xce ssi ve, enz yme totally binds with substra te. The more enzyme molec ules, the more resulting products, the more the reaction rate is faster. Whe n [S] is more tha n [E], Eq.3 can be expressed as [17]: (7) Therefore, when the substrate concentration is exces- sive, reaction rate is linear to the concentration of en- zyme, which is consistent with the expe rimental results. 3.6. Effect of pH on the Efficiency of Hydrolysis The effect of pH was investigated with 10 mg/mL of substrate and 0.200 mg/mL of enzyme under 70˚C with pH values ranged from 5 to 9. The results are shown in Figure 4. As shown in Figure 4, the reaction rate reaches max- imum due to extreme acid or base conditions disrupt the conformation of enzyme, which would result in the loss of enzyme, even totally inactivate the enzyme and thus decreases the reaction rate. If pH values do not vary sig- nificantly, the dissociative state of substrate is affected by the pH values; enzyme can not bind with substrate or Table 3 . Comparison of Lineweaver-Burk and Wilkinson me- thods. Method Vm/mg/(mL·min) Km/(mg/mL) Line weaver-Burk 3.5562 8.7219 Wilkinson 3.1588 6.6641 Figure 3. Rel a tionship bet wee n α-amylase concen tration and reaction rate. 0.00 0.05 0.10 0.150.20 0.25 0.30 0. 5 1. 0 1. 5 2. 0 2. 5 3. 0 3. 5 ν/ (mg/mL·min) E nzy me co ncen tra tio n/(m g /mL )  J. Miao et al. / Agricultural Sciences 4 (2013) 5-11 Copyright © 2013 SciRes. OPEN ACCESS Figure 4. Effects of pH on the hydrolysis of Huai yam. on products were produced after binding and thus affect- ing the reaction rate [12]. Reaction rates under different pH values can be fitted with Eq.8: (8) where ν', Vm and Km indicate reaction rate under different pH values, maximum reaction rate and Michaelis con- stant, respectively. 3.7. Effect of Temperature on Reaction Rate The effect of temperature was investigated by fixing pH value, substrate and enzyme concentrations. When the temperatures were selected as 40˚C, 50˚C, 60˚C, 70˚C and 80˚C, the reaction rates are shown in Fi g ure 5 . It can be seen that the reaction rate increases with in- creasing temperat ure in the range of 40˚C to 70˚C. Above this level, the reaction rate decreases due to higher tem- perature results in the inactivation of enzyme and thus decreases the reaction rate. Figure 6 shows the relations hip between lnν and 1/T × 103. Obviously, there is a good linearity between and 1/T × 103 when the values of 1/T × 103 range from 2.9 to 3.2, indicating that the hydrolysis rate and temper- ature follow t he Arrhenius equation: (9) where A, R and Ea are pre-exponential factor, gas con- stant (J/mol∙K) and activation energy (kJ/mol), respec- tively. Values of Ea and A are obtained by linear regression equation. It is found that Ea is 14.774 kJ/mol, A is 454 mg/mL∙min and the correlation coefficient is 0.9907, suggesting that the experimental data is good agreement with Arrhenius equation. If temperature does not vary significantly, the equili- brium constants and temperature (T) follow Van’t Hoff equation: (10) where Ks, ΔH, C and R ar e e quilibrium constant, enthalpy, frequency factor and gas constant, respectively. In enzy- matic reaction, k2 >> k−1, Ks ≈ Km, a linear curve (Figure 7) can be obtained by fitting lnKm versus 1/T × 103. Fro m line ar regre ssion eq uati on, it is found that ΔH is 14.641 kJ/mol, C is 1046 and correlation coefficient, r, is 0.9856. Therefore, the kinetic equation of medium-tem- perature α-amylase hydrolyzing Huai yam can be ex- pressed as: 3[][]exp(/)[][ ] [ ]exp(/)[ ] 454exp(14774 /)[][ ] 1046exp( 14641/)[] a m k E SAERT KSCH RTS RT ES RT S ν ⋅− = = +⋅ −∆+ ⋅− =−+ This equation is suitable in the temperature range of 313.15 to 343.15 K (40˚C to 70˚C). 4. CONCLUSIONS Because starch includes amylose and amylopectin with different molecular weight sizes, and the hydrolysis products by the medium-temperature α-amylase include dextrin, oligosaccharides, glucose and maltose [12 ]. This work adopts phenol-sulfuric acid method for the deter- mination of total sugars after hydrolysis and investigates the parameters affecting reaction rate. It is found that Km is 6.66 41 mg/mL and maximum reaction rate, Vm, is 3.1588 mg/mL∙min. The kinetic model of enzymatic hydrolysis 5678910 0. 5 1. 0 1. 5 2. 0 2. 5 3. 0 ν/ (mg/mL·min) pH 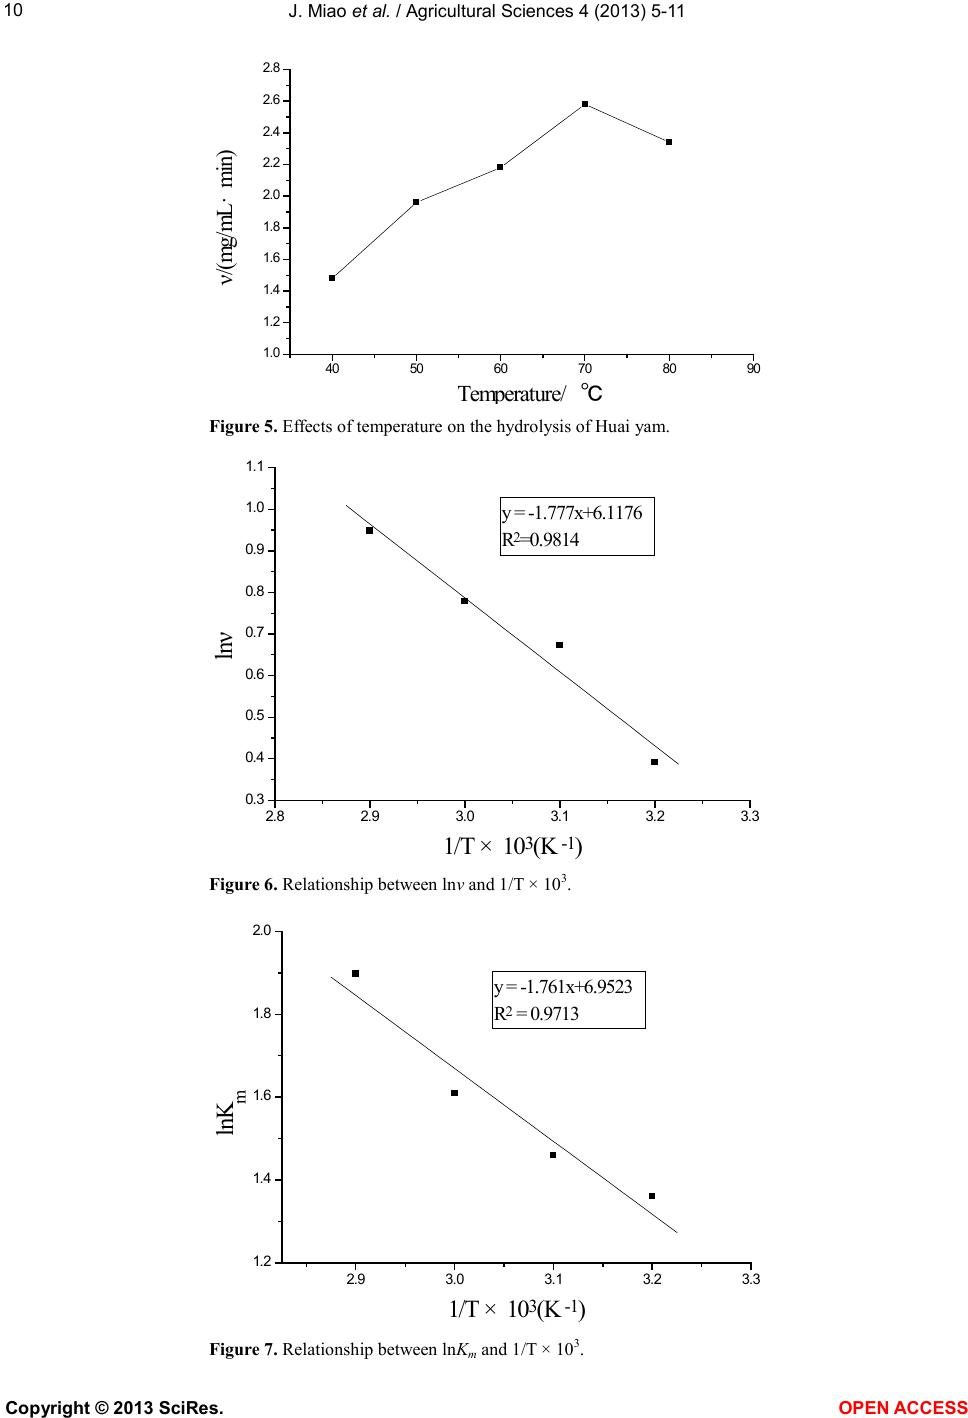 J. Miao et al. / Agricultural Sciences 4 (2013) 5-11 Copyright © 2013 SciRes. OPEN ACCESS Figure 5. Effects of temperature on the hydrolysis of Huai yam. Figure 6. Rel a tionship bet wee n lnν and 1/T × 103. Figure 7. Rel a tionship bet wee n lnKm and 1/T × 103. 40 50 60 70 80 90 1. 0 1. 2 1. 4 1. 6 1. 8 2. 0 2. 2 2. 4 2. 6 2. 8 ν/(mg/mL· min) Temperature/ ℃ 2.8 2.93.0 3.1 3.2 3.3 0. 3 0. 4 0. 5 0. 6 0. 7 0. 8 0. 9 1. 0 1. 1 y = -1.777x+6.1176 R2=0.9814 lnν 1/T ×10 3(K -1) 2.9 3.0 3.1 3.2 3.3 1. 2 1. 4 1. 6 1. 8 2. 0 y = -1.761x+6.9523 R 2 = 0.9713 l nK m 1/T ×10 3 (K -1 ) 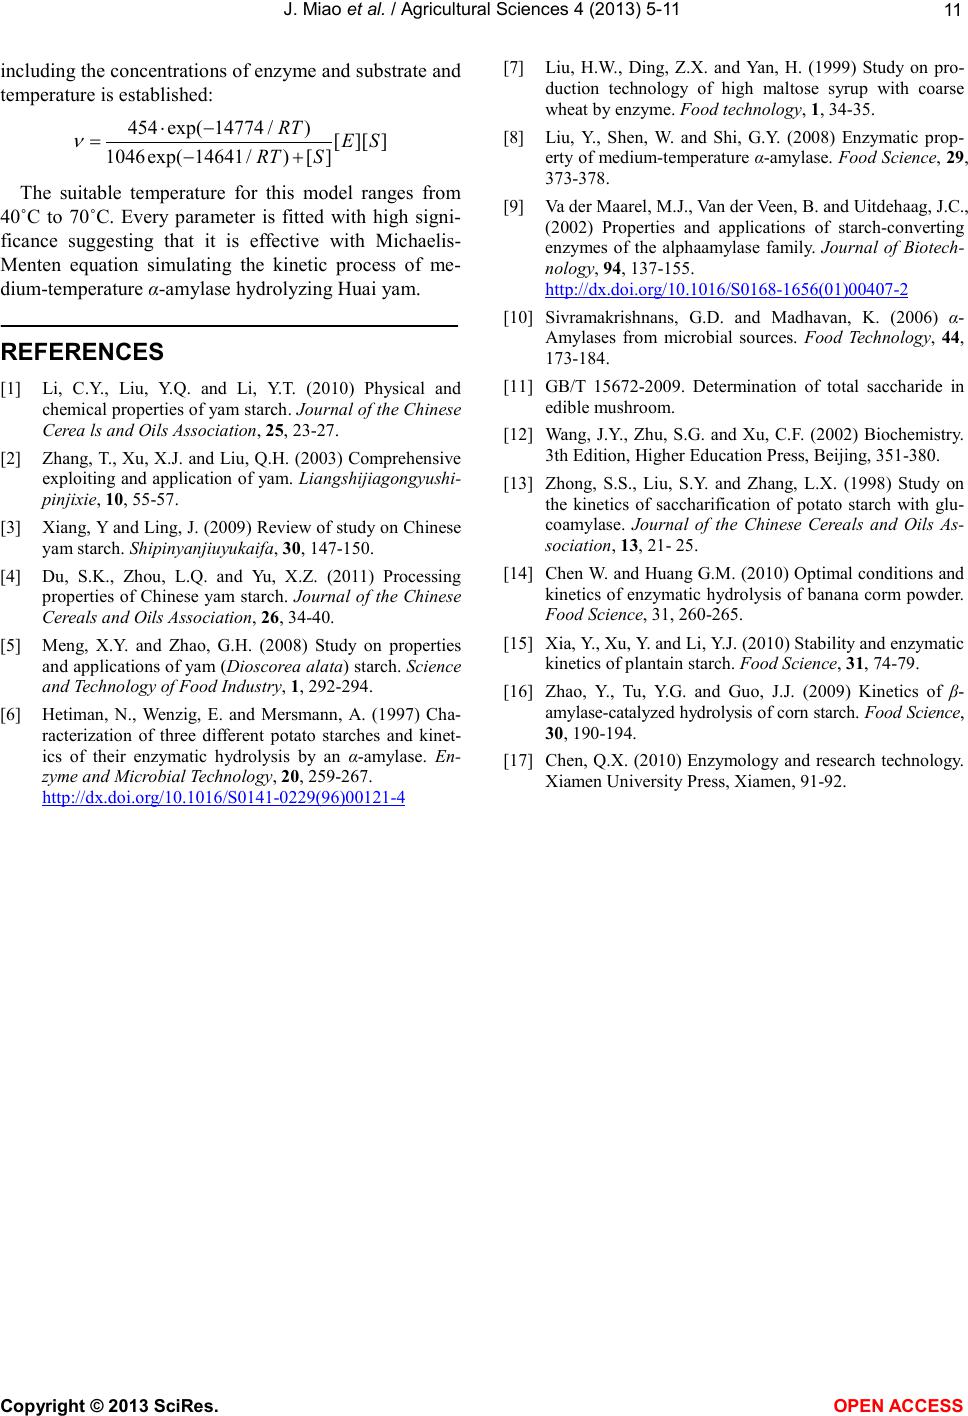 J. Miao et al. / Agricultural Sciences 4 (2013) 5-11 Copyright © 2013 SciRes. OPEN ACCESS including the concentrations of enzyme and substrate and temperature is established: 454exp(14774 /)[][ ] 1046exp( 14641/)[] RT ES RT S ν ⋅− =−+ The suitable temperature for this model ranges from 40˚C to 70˚C. Every parameter is fitted with high signi- ficance suggesting that it is effective with Michaelis- Menten equation simulating the kinetic process of me- dium-temperature α-amylase hydrolyzing Huai yam. REFERENCE S [1] Li , C.Y., Liu, Y.Q. and Li, Y.T. (2010) Physical and chemical p ro per ties o f yam st arch . Journal of the Chinese Cerea ls and Oils Association, 25, 23-27. [2] Zhang, T., Xu, X.J. and Liu, Q.H. (2003) Comprehensive exploiting and application of yam. Liangshijiagongyushi- pinjixie, 10, 55-57. [3] X i ang, Y and Ling, J. (2009) Review of study on Chinese yam starch. Shipinyanjiuyukaifa, 30, 147-150. [4] Du, S.K., Zhou, L.Q. and Yu, X.Z. (2011) Processing properties of Chinese yam starch. Journal of the Chinese Cereals and Oils Association, 26, 34 -4 0. [5] Meng, X.Y. and Zhao, G.H. (2008) Study on properties and applications of yam (Dioscorea alata) starch. Science and Technology of Food Industry, 1, 292-294. [6] Heti man, N., Wenzig, E. and Mersmann, A. (1997) Cha- racterization of three different potato starches and kinet- ics of their enzymatic hydrolysis by an α-amylase. En- zyme and Microbial Technology, 20, 259-267. http://dx.doi.org/10.1016/S0141-0229(96)00121-4 [7] Li u, H.W., Ding, Z.X. and Yan, H. (1999) Study on pro- duction technology of high maltose syrup with coarse wheat b y enzyme. Food technology, 1, 34-35. [8] Li u, Y., Shen, W. and Shi, G.Y. (2008) Enzymatic prop- erty of medium-temperat ure α-amylase. Food Science, 29, 373-378. [9] Va der Maarel, M.J., Van der Veen, B. and Uitdehaag, J.C., (2002) Properties and applications of starch-converting enzymes of the alphaamylase family. Journal of Biotech- nology, 94, 137-155. http://dx.doi.org/10.1016/S0168-1656(01)00407-2 [10] Sivramakrishnans, G.D. and Madhavan, K. (2006) α- Amylases from microbial sources. Food Technology, 44, 173-184. [11] GB/T 15672-2009. Determination of total saccharide in edible mushroom. [12] Wang, J.Y., Zhu, S.G. and Xu, C.F. (2002) Biochemistry. 3th Edition, Higher Education Press, Beijing, 351-380. [13] Zhong, S.S., Liu, S.Y. and Zhang, L.X. (1998) Study on the kinetics of saccharification of potato starch with glu- coamylas e. Journal of the Chinese Cereals and Oils As- sociation, 13, 21- 25. [14] Chen W. and Huang G.M. (2010) Optimal conditions and kinetics of enzymatic hydrolysis of banana corm powder. Food Science, 31, 260-265. [15] Xia, Y., Xu, Y. and Li, Y.J. (2 010) Stability and enzymatic kinetics of plantain starch. Food Science, 31, 74-79. [16] Zhao, Y., Tu, Y.G. and Guo, J.J. (2009) Kinetics of β- amylase-catalyzed hydrolysis of corn starch. Food Sci ence, 30, 190-194. [17] C hen, Q.X. (2010) Enzymology and research technology. Xiamen University Press, Xiamen, 91-92.
|