 Applied Mathematics, 2013, 4, 1568-1582 Published Online November 2013 (http://www.scirp.org/journal/am) http://dx.doi.org/10.4236/am.2013.411212 Open Access AM Fracture Response of Reinforced Concrete Deep Beams Finite Element Investigation of Strength and Beam Size Guillermo A. Riveros1, Vellore Gopalaratnam2 1Information Technology Laboratory, US Army Engineer Research and Development Center, Vicksburg, MS, USA 2Department of Civil and Environmental Engineering, University of Missouri-Columbia, Columbia, MO, USA Email: Guillermo.A.Riveros@us.army.mil Received January 8, 2013; revised February 8, 2013; accepted February 15, 2013 Copyright © 2013 Guillermo A. Riveros, Vellore Gopalaratnam. This is an open access article distributed under the Creative Com- mons Attribution License, which permits unrestricted use, distribution, and reproduction in any medium, provided the original work is properly cited. ABSTRACT This article presents a finite element analysis of reinforced concrete deep beams using nonlinear fracture mechanics. The article describes the development of a numerical model that includes several nonlinear processes such as compres- sion and tension softening of concrete, bond slip between concrete and reinforcement, and the yielding of the longitu- dinal steel reinforcement. The development also incorporates the Delaunay refinement algorithm to create a triangular topology that is then transformed into a quadrilateral mesh by the quad-morphing algorithm. These two techniques al- low automatic remeshing using the discrete crack approach. Nonlinear fracture mechanics is incorporated using the fic- titious crack model and the principal tensile strength for crack initiation and propagation. The model has been success- ful in reproducing the load deflections, cracking patterns and size effects observed in experiments of normal and high-strength concrete deep beams with and without stirrup reinforcement. Keywords: Automatic Remeshing; Bond Slip; Concrete; Discrete Crack; Finite Element; Fracture Mechanics; Size Effects; Tensile Softening 1. Introduction Reinforced concrete (RC) deep beams have useful appli- cations in tall buildings, offshore structures, foundations, and military structures. A significant number of failures in RC structures initiate in tension regions caused by areas of high-stress concentrations or preexisting cracks. Stable growth of these tensile cracks, until peak loads, is associated with the development of large zones of frac- ture (fracture process zone (FPZ)). The growth of the FPZ, until peak load is reached, introduces the effect of structural size on the failure loads. Hence, if one was to design structures based on equations that were developed based on strength analysis, as in current American Con- crete Institute (ACI) code [1], the margin of safety pro- vided would depend upon the size of the structure. The margin of safety will be higher for smaller structures than for larger ones. It is also conceivable that this approach would lead to unconservative designs for some very large structures, e.g., deep slabs for underground storage tanks. Early attempts [2] to analyze failure in concrete struc- tures caused by crack growth were not successful, even though it was obvious that a fracture mechanics approach would be realistic to model brittle crack propagation type failures. The lack of success in the early attempts to ana- lyze crack propagation failures was due to the use of lin- ear elastic fracture mechanics (LEFM). LEFM assumes that the fracture process is small and can be replaced, and that the rest of the member volume remains elastic; however, research in the last four decades has resulted in modifications to LEFM to account for the distributed nature of pre-peak micro-cracking and the presence of a large FPZ in concrete [3-6]. These modifications have produced better results in the application of fracture me- chanics concepts to brittle failure in reinforced concrete. Theories that allow tensile softening and FPZ of rela- tively large sizes are classified as nonlinear fracture me- chanics models. A considerable effort has been committed to develop numerical models to simulate the fracture behavior of materials exhibiting tensile softening and FPZ, such as mortar, concrete, rock, or bricks used in civil engineering structures [4,7]. Two numerical methods to simulate frac- ture are available; the smeared crack approach and dis-  G. A. RIVEROS, V. GOPALARATNAM 1569 crete crack approach. In the smeared crack approach, in- troduced by [8], the crack is replaced by a continuous medium with altered mechanical properties. Because the crack is established through stress computations at inte- gration points, a significant number of cracks with small openings are imagined to be continually distributed over the finite element. The constitutive laws, defined by stress- strain relations, are nonlinear and may exhibit strain sof- tening. Strain localization instabilities and spurious mesh sensitivity of finite element calculations are likely, when strain softening is modeled numerically. These difficul- ties can be overcome by adopting appropriate mathe- matical techniques [6]. In the discrete crack approach, the crack is formulated as a geometrical change that requires remeshing each time a crack is initiated or propagated. The computa- tional demand, as a result, has been one of the biggest drawbacks of the method; however, this article shows the development of multicrack initiation and propagation pro- cedures that enhance the method and make it less cum- bersome. The cohesive crack model, developed by [2] and discussed in [9], has been shown to be effective for modeling the nonlinear fracture behavior of RC (fracture process of quasi-brittle materials). Several numerical models have been developed to study the behavior of brittle failure (shear) of reinforced con- crete beams [10-13]. Because these models differ in ma- terial models, element formulations, and solution proce- dures, a specific approach will be more suited for spe- cific structures and/or loading situations and less suited to others [13]; however, nonlinear fracture mechanics models are capable of analyzing the complete behavior of reinforced concrete beams of any size and loading geometry. This article presents a nonlinear fracture mechanics finite element code that incorporates nonlinear fracture mechanics analysis on reinforced concrete beams. The system uses the discrete crack approach with the ficti- tious crack model (FCM) [2,9,14,15] to represent the tensile softening of concrete; the Shah-Fafitis-Arnold model [16] to characterize compression softening; a nonlinear bond-slip constitutive model to account for bond-slip degradation observed when cracks cross the tensile rein- forcement [12,17] and an elastic, perfectly plastic con- stitutive model to represent the yielding of the tensile reinforcement. A multicrack initiation and propagation routine incor- porating the Delaunay refinement algorithm [18] to cre- ate a triangular topology necessary to obtain a high- quality mesh when multiple cracks are generated in RC beams that are transformed into a quadrilateral mesh by the quad-morphing algorithm [19] has also been devel- oped. The primary motivation for this investigation is to study brittle shear failures in reinforced concrete beams from a nonlinear fracture mechanics and finite element point of view and to study the implications for shear de- sign practices. A secondary motivation is to study brit- tleness in a more general context that includes structural (size and loading geometry) and material contributions to brittleness. The model has been successful in reproduc- ing the load deflections, cracking patterns and size ef- fects observed in experiments of normal and high-strength concrete deep beams with and without stirrup reinforce- ment [20] with shear-span-to-depth ratios a/d of 1.5 and 2.5. 2. Experimental Evaluation [21] conducted systematic experiments to characterize the structural and material response of over 150 rein- forced concrete deep beams with and without shear rein- forcement. Four beam sizes and three different concrete mixes were used. The effective depths d used were 50, 100, 200, and 800 mm (2, 4, 8, and 32 in.). Shear-span- to-depth ratios a/d of 1.5 and 2.5 were also used to char- acterize different failure modes. Results from the two larger beams with and without shear reinforcement were used in this numerical study for comparisons (Figure 1 and Tables 1 and 2). Compressive response of concrete was obtained using specimens cored (75-mm (3 in.) diameter, 150-mm (6 in.) length) and tested under specimen displacement controlled conditions to obtain the complete (including post-peak softening) stress strain response [22]. Mode I fracture parameters were obtained testing notched beams on a (a) (b) Figure 1. Details of beam geometry and loading configura- tion for beam (a) without stirrup reinforcement and (b) with stirrup reinforcement. Open Access AM  G. A. RIVEROS, V. GOPALARATNAM 1570 Table 1. Dimensional details of the reinforced concrete beams (dimensions are in mm (inches)). Size A Size B L 5486.4 (216.0) 1422.4 (56.0) S 4876.8 (192.0) 1219.2 (48.0) H 914.4 (36.0) 241.3 (9.5) b 152.4 (6.0) 152.4 (6.0) d 812.8 (32.0) 203.2 (8.0) 1219.2 [1.5] (48.0) 304.8 [1.5] (12.0) a [a/d] 2032.0 [2.5] (80.0) 508.0 [2.5] (20.0) Table 2. Material properties from tests. Mix NSC HSC Property 28 Days Test 28 Days Test c , MPa (psi) 32.2 (4668) 43.0 (6238) - 72.9 (10,570) E, MPa (psi) 19,289 (2,797,650) 29,320 (4,252,520) - 31,354 (4,547,560) ft, MPa (psi) 4.3 (618) 4.6 (664) Gf, N/mm (lb/in.) 0.10028 (0.57267) 0.09100 (0.51967) three-point loading configuration. Material properties and fracture energy for normal-strength concrete (NSC) and high-strength concrete (HSC) are presented in Table 2. For beam sizes A and B, [20] used two ram displace- ments controlled by a dual ramp command function. For size A beams he used an initial load ratio of 25 mm (1 in.)/hour for the first half hour and a ratio of 76 mm (3.0 in.)/hour thereafter. For size B beams he used an initial load ratio of 7.1 mm (0.28 in.)/hour and a ratio of 25.0 mm (1.0 in.)/hour until failure. Load displacement be- haviors obtained in the experiments were then used in the numerical model to determine the force boundary condi- tions needed to predict a similar response. 3. Fracture Mechanics Analysis of Reinforced Concrete Beams (FMARCB) A finite element system, Fracture Mechanics Analysis of Reinforced Concrete Beams (FMARCB) [23], has been developed to perform nonlinear fracture mechanics analy- sis on reinforced concrete beams. The system consists of a graphic input interface, analysis routines using finite element techniques, and graphic output interface. FMA- RCB is a two-dimensional finite element program with triangular (3 and 6 nodes), isoparametric (4 and 8 nodes), bar (truss), and interface elements (bond-link). The sys- tem uses the discrete crack approach with the FCM [2,9,14,15] to represent the tensile concrete softening; the Shah-Fafitis-Arnold model [16] to characterize the com- pression softening; a nonlinear bond-slip constitutive model for the bond-slip phenomenon, which is degraded when cracks cross the tensile reinforcement [12,17] and an elastic perfectly plastic constitutive model to represent the yielding of the tensile reinforcement. The analysis begins with the definition of the finite element model of the continuum in the elastic state. Once the elastic analysis of the system is completed for the first load step and the principal stresses are extrapolated at the nodes, cracking criteria based on the principal tensile stresses are verified. If the principal tensile stress exceeds the tensile strength, a fictitious crack is incorpo- rated at the location and automatic remeshing is under- taken. Once the system has cracked, the nonlinear solver is activated. If new cracks and extensions are required after the nonlinear problem satisfies equilibrium for an unbalanced tolerance, the system is remeshed with new cracks and the existing crack extensions. It is then cali- brated again for the same load step until no new cracks or extensions are required. This iterative process is repeated for each load step. FMARCB incorporates the Delaunay refinement algo- rithm [8] to create a triangular topology that then is transformed into a quadrilateral mesh by the quad-morph- ing algorithm [19]. The Delaunay refinement mesh gen- eration algorithm constructs meshes of triangular ele- ments. The algorithm operates by imposing a Delaunay or constrained Delaunay triangulation that is refined by inserting additional vertices until the mesh meets con- straints on element quality and size. These algorithms simultaneously offer theoretical bounds on element qual- ity, edge lengths, and spatial grading of element sizes. They also possess the ability to triangulate general straight-line domains. Quad-morphing [19] is a technique used for generating quadrilaterals from an existing triangle mesh. Beginning with an initial triangulation, triangles are systematically transformed and combined. Quad-morphing can be cate- gorized as an unstructured, indirect method that utilizes an advancing front algorithm to form an all-quad mesh. As an indirect method it is able to take advantage of local topology information from the initial triangulation. Unlike other indirect methods it is able to generate boundary- Open Access AM  G. A. RIVEROS, V. GOPALARATNAM 1571 sensitive rows of elements, with few irregular nodes. 4. Nonlinear Fracture Mechanics Using the Fictitious Crack Model The FCM assumes that there is an inelastic zone (FPZ) ahead of the crack tip [2,14]. Along the FPZ, the stress carrying capacity decreases as a function of the crack opening displacement (COD). The FPZ is characterized by a normal stress versus COD response (Figure 2), which is considered a material property. This model adopts the tensile strength criterion for crack initiation and subsequent growth. It also assumes that a stress-free crack occurs when the COD is larger than the critical COD wc. 5. Material Properties Characterization Tension softening curve. FMARCB has the capability to use either a linear or bilinear softening curve (Figure 2). The fictitious crack model is incorporated into the finite element analysis by employing interface elements. For a linear softening curve, the critical COD value wc is 2 c t G w (1) where, Gf is the fracture energy, ft is the tensile strength, and wc is the COD, when the tensile capacity is reduced to zero. Figure 2 also shows the bilinear softening curve pro- posed by [24], where wc is 3.6 c t G w (2) and w1 is 10.8 t G w (3) where w1 is the COD at the kink of the bilinear curve, wc is the COD when the tensile carrying capacity is com- pletely lost, and the stress at the kink is 1/3 ft. In the FCM the interface element is a nonlinear function of the (a) (b) Figure 2. FMARCB tension softening models: (a) Linear; (b) Nonlinear. COD as shown in Figure 2. When interface elements are used to model the FPZ, care must be taken to avoid di- vergent numerical behavior. Figure 2 shows that when the COD is small, the stiffness of the interface element is large, which requires a small load step for convergence [25]. A finite initial stiffness has to be used as shown in Figure 2. An initial stiffness corresponding to wc/20 to wc/30 has been used by [25] with success. Compression softening. The compression softening model used in this work is the one proposed by [16]. The model describes well, the stress-strain relation for con- fined and unconfined concrete. The ascending part of the model is described by 0 0 11 A ff (4) and the descending part as 1.15 0 expff k 0 (5) where f is the stress corresponding to the predefined strain ε, and the peak stress f0 and peak strain ε0 for later- ally confined concrete are defined as 0 2100 KP 0 .15 a1 c c ff f f r (6a) 0 3048 si1.15 c c ff f f r (6b) 8 00.0291.60.00195 KPa491 r c c f Ef f (7a) 7 00.021960.00195 ps.0 i27 r c c f Ef f (7b) where c f is the compressive strength for unconfined concrete and fr is the confinement pressure. The confinement pressure fr is then defined as 2vy r c f f d (8) where Av is the area of the lateral reinforcement, fy is the yield strength of the stirrups, s is the spacing between stirrups, and dc is the diameter of the concrete core. Parameters A and k are constants that were statistically evaluated from experimental data of unconfined and con- fined concrete subjected to monotonically increasing load- ing [16] and are defined as 0 0 c E Af (9) 0.025 exp0.00145KPa cr kf f (10a) Open Access AM 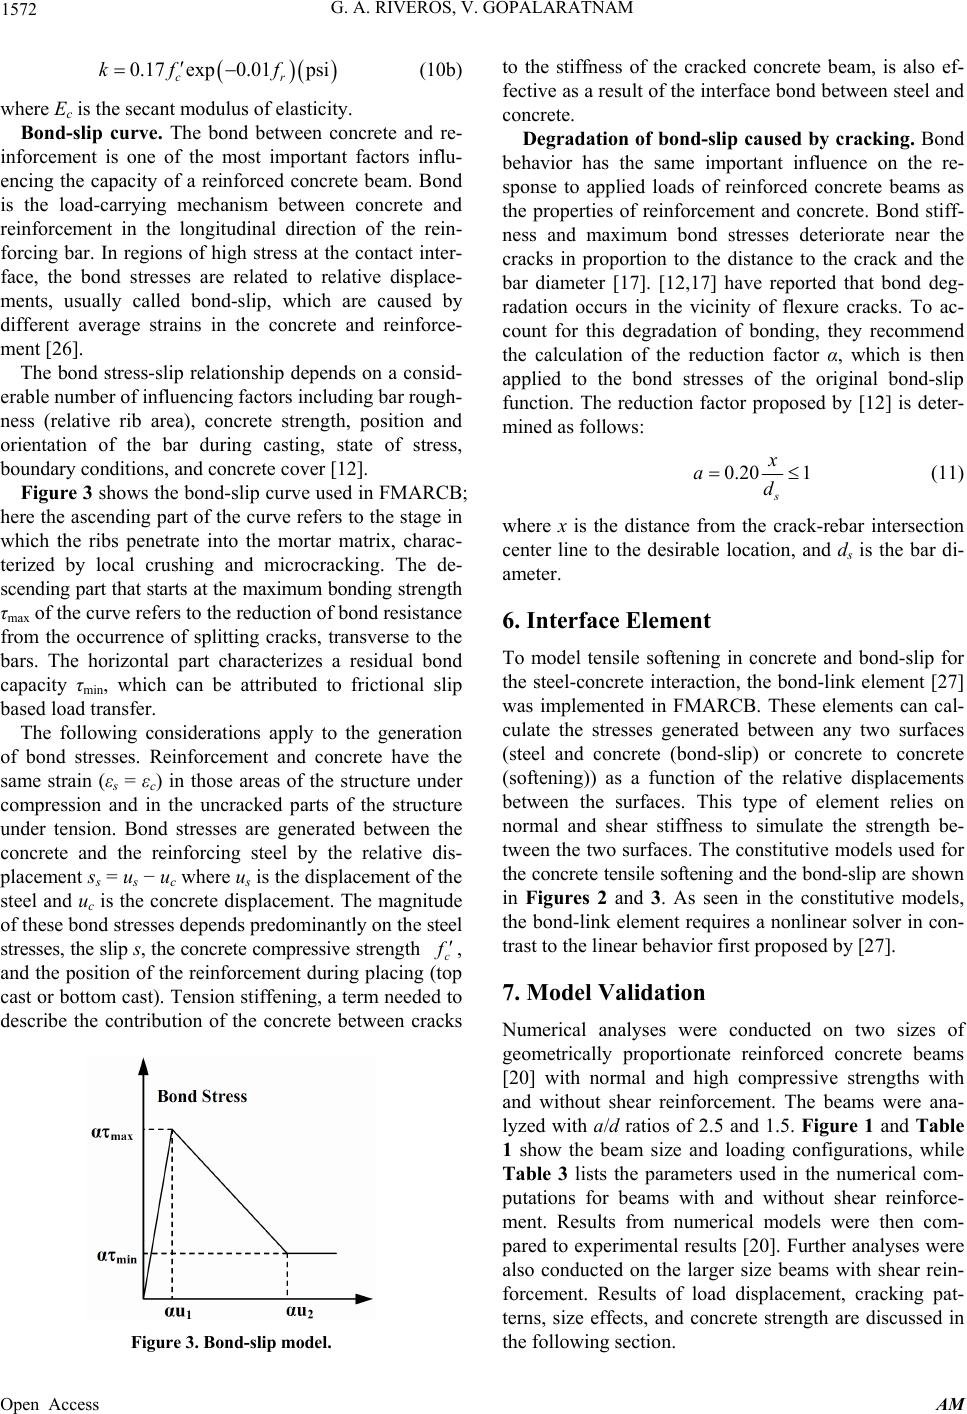 G. A. RIVEROS, V. GOPALARATNAM 1572 0.17 exp0.01psi cr kf f (10b) where Ec is the secant modulus of elasticity. Bond-slip curve. The bond between concrete and re- inforcement is one of the most important factors influ- encing the capacity of a reinforced concrete beam. Bond is the load-carrying mechanism between concrete and reinforcement in the longitudinal direction of the rein- forcing bar. In regions of high stress at the contact inter- face, the bond stresses are related to relative displace- ments, usually called bond-slip, which are caused by different average strains in the concrete and reinforce- ment [26]. The bond stress-slip relationship depends on a consid- erable number of influencing factors including bar rough- ness (relative rib area), concrete strength, position and orientation of the bar during casting, state of stress, boundary conditions, and concrete cover [12]. Figure 3 shows the bond-slip curve used in FMARCB; here the ascending part of the curve refers to the stage in which the ribs penetrate into the mortar matrix, charac- terized by local crushing and microcracking. The de- scending part that starts at the maximum bonding strength τmax of the curve refers to the reduction of bond resistance from the occurrence of splitting cracks, transverse to the bars. The horizontal part characterizes a residual bond capacity τmin, which can be attributed to frictional slip based load transfer. The following considerations apply to the generation of bond stresses. Reinforcement and concrete have the same strain (εs = εc) in those areas of the structure under compression and in the uncracked parts of the structure under tension. Bond stresses are generated between the concrete and the reinforcing steel by the relative dis- placement ss = us − uc where us is the displacement of the steel and uc is the concrete displacement. The magnitude of these bond stresses depends predominantly on the steel stresses, the slip s, the concrete compressive strength c f , and the position of the reinforcement during placing (top cast or bottom cast). Tension stiffening, a term needed to describe the contribution of the concrete between cracks Figure 3. Bond-slip model. to the stiffness of the cracked concrete beam, is also ef- fective as a result of the interface bond between steel and concrete. Degradation of bond-slip caused by cracking. Bond behavior has the same important influence on the re- sponse to applied loads of reinforced concrete beams as the properties of reinforcement and concrete. Bond stiff- ness and maximum bond stresses deteriorate near the cracks in proportion to the distance to the crack and the bar diameter [17]. [12,17] have reported that bond deg- radation occurs in the vicinity of flexure cracks. To ac- count for this degradation of bonding, they recommend the calculation of the reduction factor α, which is then applied to the bond stresses of the original bond-slip function. The reduction factor proposed by [12] is deter- mined as follows: 0.20 1 s x ad (11) where x is the distance from the crack-rebar intersection center line to the desirable location, and ds is the bar di- ameter. 6. Interface Element To model tensile softening in concrete and bond-slip for the steel-concrete interaction, the bond-link element [27] was implemented in FMARCB. These elements can cal- culate the stresses generated between any two surfaces (steel and concrete (bond-slip) or concrete to concrete (softening)) as a function of the relative displacements between the surfaces. This type of element relies on normal and shear stiffness to simulate the strength be- tween the two surfaces. The constitutive models used for the concrete tensile softening and the bond-slip are shown in Figures 2 and 3. As seen in the constitutive models, the bond-link element requires a nonlinear solver in con- trast to the linear behavior first proposed by [27]. 7. Model Validation Numerical analyses were conducted on two sizes of geometrically proportionate reinforced concrete beams [20] with normal and high compressive strengths with and without shear reinforcement. The beams were ana- lyzed with a/d ratios of 2.5 and 1.5. Figure 1 and Table 1 show the beam size and loading configurations, while Table 3 lists the parameters used in the numerical com- putations for beams with and without shear reinforce- ment. Results from numerical models were then com- pared to experimental results [20]. Further analyses were also conducted on the larger size beams with shear rein- forcement. Results of load displacement, cracking pat- terns, size effects, and concrete strength are discussed in the following section. Open Access AM 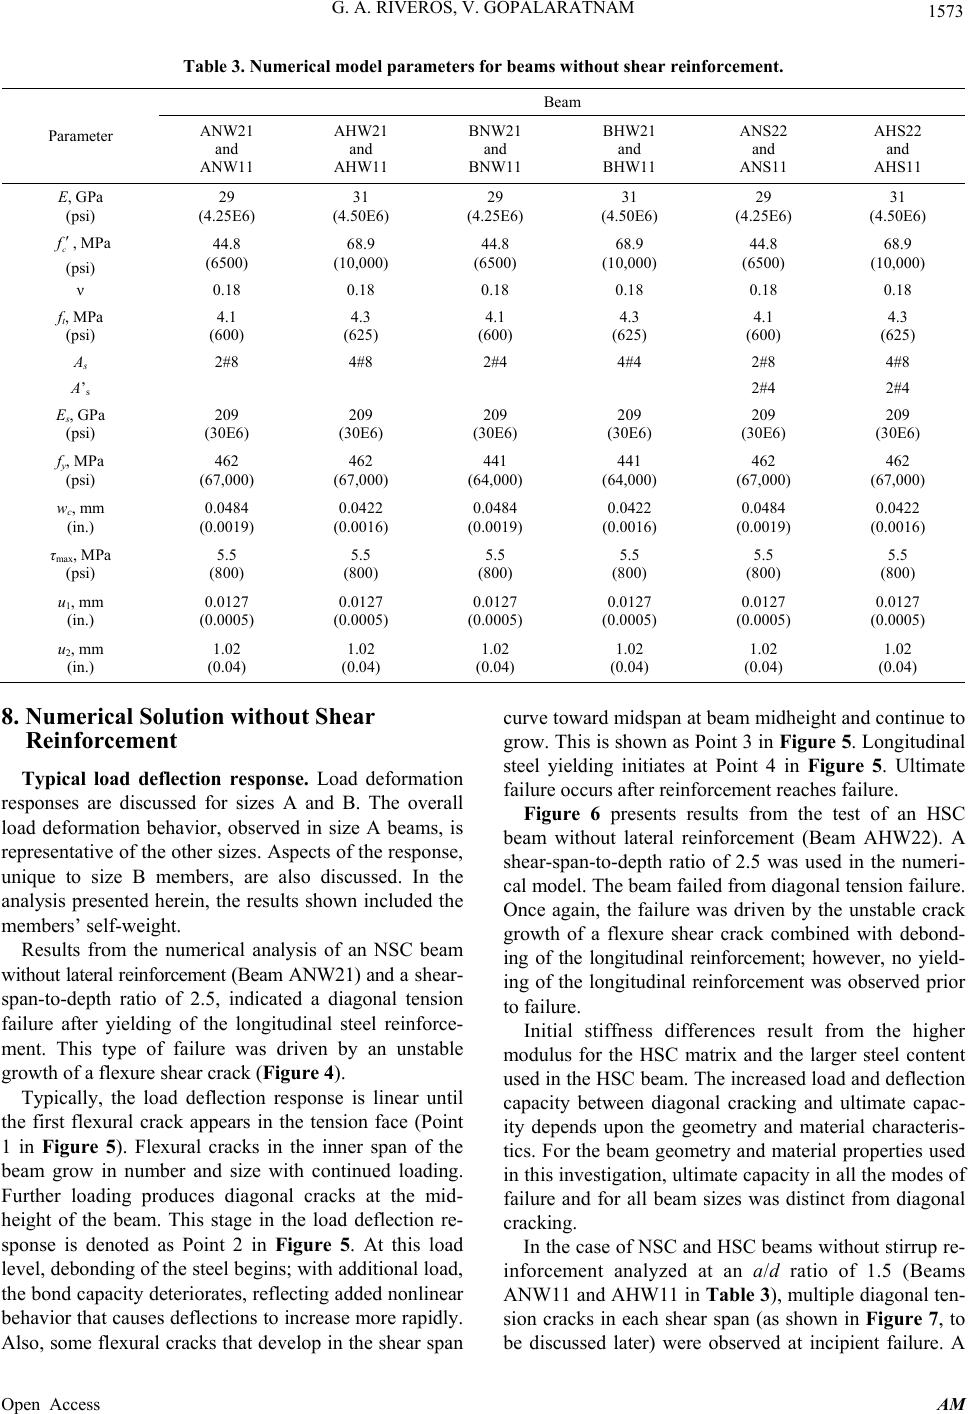 G. A. RIVEROS, V. GOPALARATNAM Open Access AM 1573 Table 3. Numerical model parameters for beams without shear reinforcement. Beam Parameter ANW21 and ANW11 AHW21 and AHW11 BNW21 and BNW11 BHW21 and BHW11 ANS22 and ANS11 AHS22 and AHS11 E, GPa (psi) 29 (4.25E6) 31 (4.50E6) 29 (4.25E6) 31 (4.50E6) 29 (4.25E6) 31 (4.50E6) c , MPa (psi) 44.8 (6500) 68.9 (10,000) 44.8 (6500) 68.9 (10,000) 44.8 (6500) 68.9 (10,000) ν 0.18 0.18 0.18 0.18 0.18 0.18 ft, MPa (psi) 4.1 (600) 4.3 (625) 4.1 (600) 4.3 (625) 4.1 (600) 4.3 (625) As 2#8 4#8 2#4 4#4 2#8 4#8 A’s 2#4 2#4 Es, GPa (psi) 209 (30E6) 209 (30E6) 209 (30E6) 209 (30E6) 209 (30E6) 209 (30E6) fy, MPa (psi) 462 (67,000) 462 (67,000) 441 (64,000) 441 (64,000) 462 (67,000) 462 (67,000) wc, mm (in.) 0.0484 (0.0019) 0.0422 (0.0016) 0.0484 (0.0019) 0.0422 (0.0016) 0.0484 (0.0019) 0.0422 (0.0016) τmax, MPa (psi) 5.5 (800) 5.5 (800) 5.5 (800) 5.5 (800) 5.5 (800) 5.5 (800) u1, mm (in.) 0.0127 (0.0005) 0.0127 (0.0005) 0.0127 (0.0005) 0.0127 (0.0005) 0.0127 (0.0005) 0.0127 (0.0005) u2, mm (in.) 1.02 (0.04) 1.02 (0.04) 1.02 (0.04) 1.02 (0.04) 1.02 (0.04) 1.02 (0.04) 8. Numerical Solution without Shear Reinforcement curve toward midspan at beam midheight and continue to grow. This is shown as Point 3 in Figure 5. Longitudinal steel yielding initiates at Point 4 in Figure 5. Ultimate failure occurs after reinforcement reaches failure. Typical load deflection response. Load deformation responses are discussed for sizes A and B. The overall load deformation behavior, observed in size A beams, is representative of the other sizes. Aspects of the response, unique to size B members, are also discussed. In the analysis presented herein, the results shown included the members’ self-weight. Figure 6 presents results from the test of an HSC beam without lateral reinforcement (Beam AHW22). A shear-span-to-depth ratio of 2.5 was used in the numeri- cal model. The beam failed from diagonal tension failure. Once again, the failure was driven by the unstable crack growth of a flexure shear crack combined with debond- ing of the longitudinal reinforcement; however, no yield- ing of the longitudinal reinforcement was observed prior to failure. Results from the numerical analysis of an NSC beam without lateral reinforcement (Beam ANW21) and a shear- span-to-depth ratio of 2.5, indicated a diagonal tension failure after yielding of the longitudinal steel reinforce- ment. This type of failure was driven by an unstable growth of a flexure shear crack (Figure 4). Initial stiffness differences result from the higher modulus for the HSC matrix and the larger steel content used in the HSC beam. The increased load and deflection capacity between diagonal cracking and ultimate capac- ity depends upon the geometry and material characteris- tics. For the beam geometry and material properties used in this investigation, ultimate capacity in all the modes of failure and for all beam sizes was distinct from diagonal cracking. Typically, the load deflection response is linear until the first flexural crack appears in the tension face (Point 1 in Figure 5). Flexural cracks in the inner span of the beam grow in number and size with continued loading. Further loading produces diagonal cracks at the mid- height of the beam. This stage in the load deflection re- sponse is denoted as Point 2 in Figure 5. At this load level, debonding of the steel begins; with additional load, the bond capacity deteriorates, reflecting added nonlinear behavior that causes deflections to increase more rapidly. Also, some flexural cracks that develop in the shear span In the case of NSC and HSC beams without stirrup re- inforcement analyzed at an a/d ratio of 1.5 (Beams ANW11 and AHW11 in Table 3 ), multiple diagonal ten- sion cracks in each shear span (as shown in Figure 7, to be discussed later) were observed at incipient failure. A 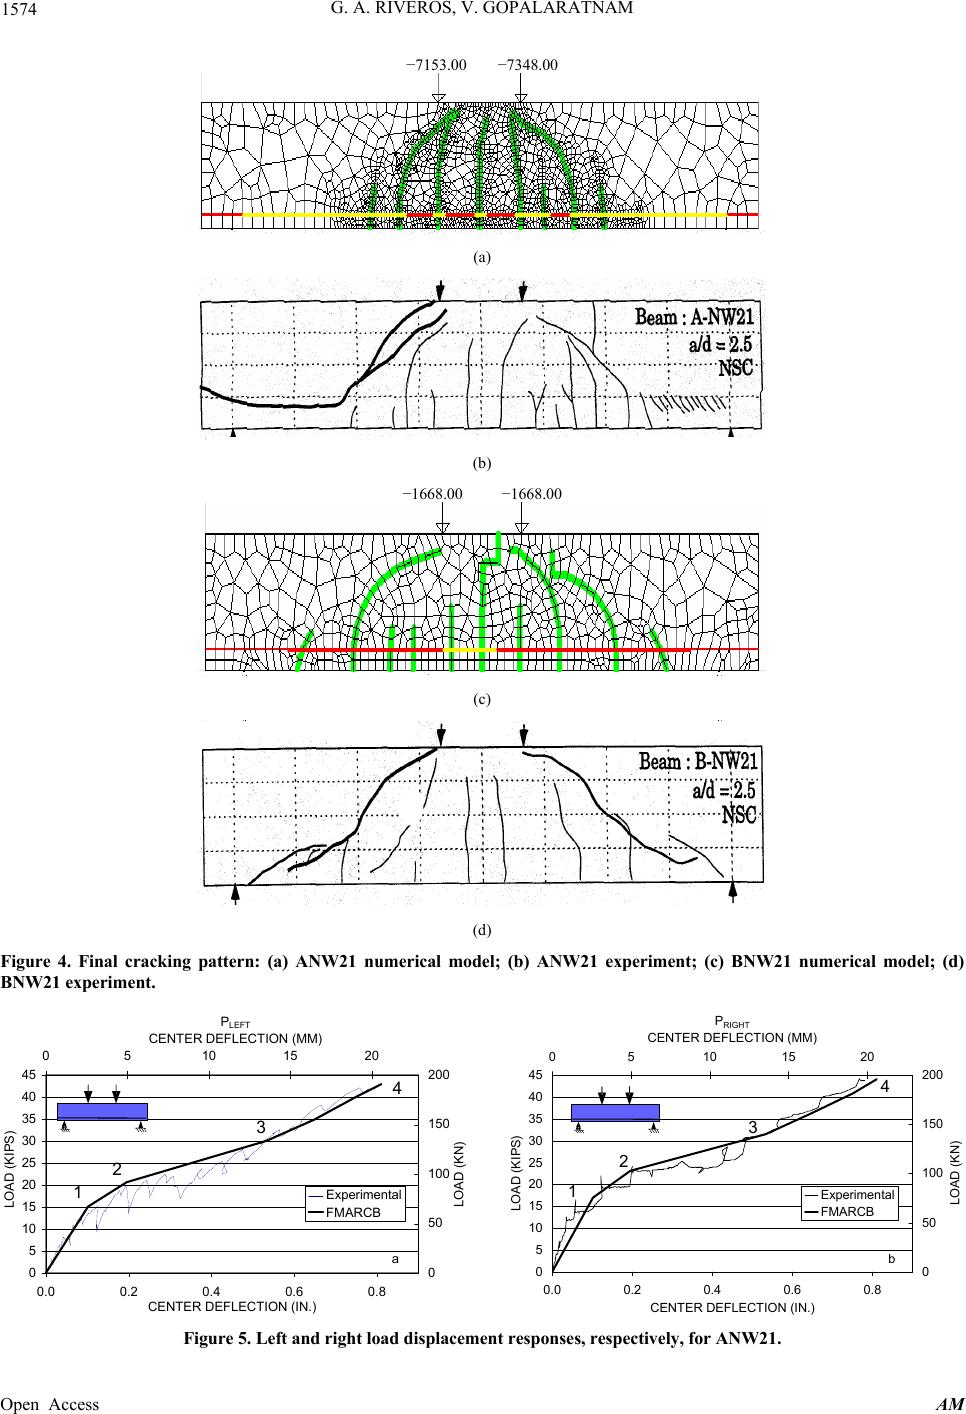 G. A. RIVEROS, V. GOPALARATNAM 1574 −7153.00 −7348.00 (a) (b) −1668.00 −1668.00 (c) (d) Figure 4. Final cracking pattern: (a) ANW21 numerical model; (b) ANW21 experiment; (c) BNW21 numerical model; (d) BNW21 experiment. 0 5 10 15 20 25 30 35 40 45 0.0 0.2 0.4 0.6 0.8 CENTER DEFLECTION (IN.) LOAD (KIPS) 0 50 100 150 200 0510 15 20 P LEFT CENTER DEFLECTION (MM) LOAD (KN) Experimental FMARCB 12 3 4 a 0 5 10 15 20 25 30 35 40 45 0.00.20.40.60.8 CENTER DEFLECTION (IN.) LOAD (KIPS) 0 50 100 150 200 05101520 P RIGHT CENTER DEFLECTION (MM) LOAD (KN) Experimental FMARCB 1 2 3 4 b Figure 5. Left and right load displacement responses, respectively, for ANW21. Open Access AM 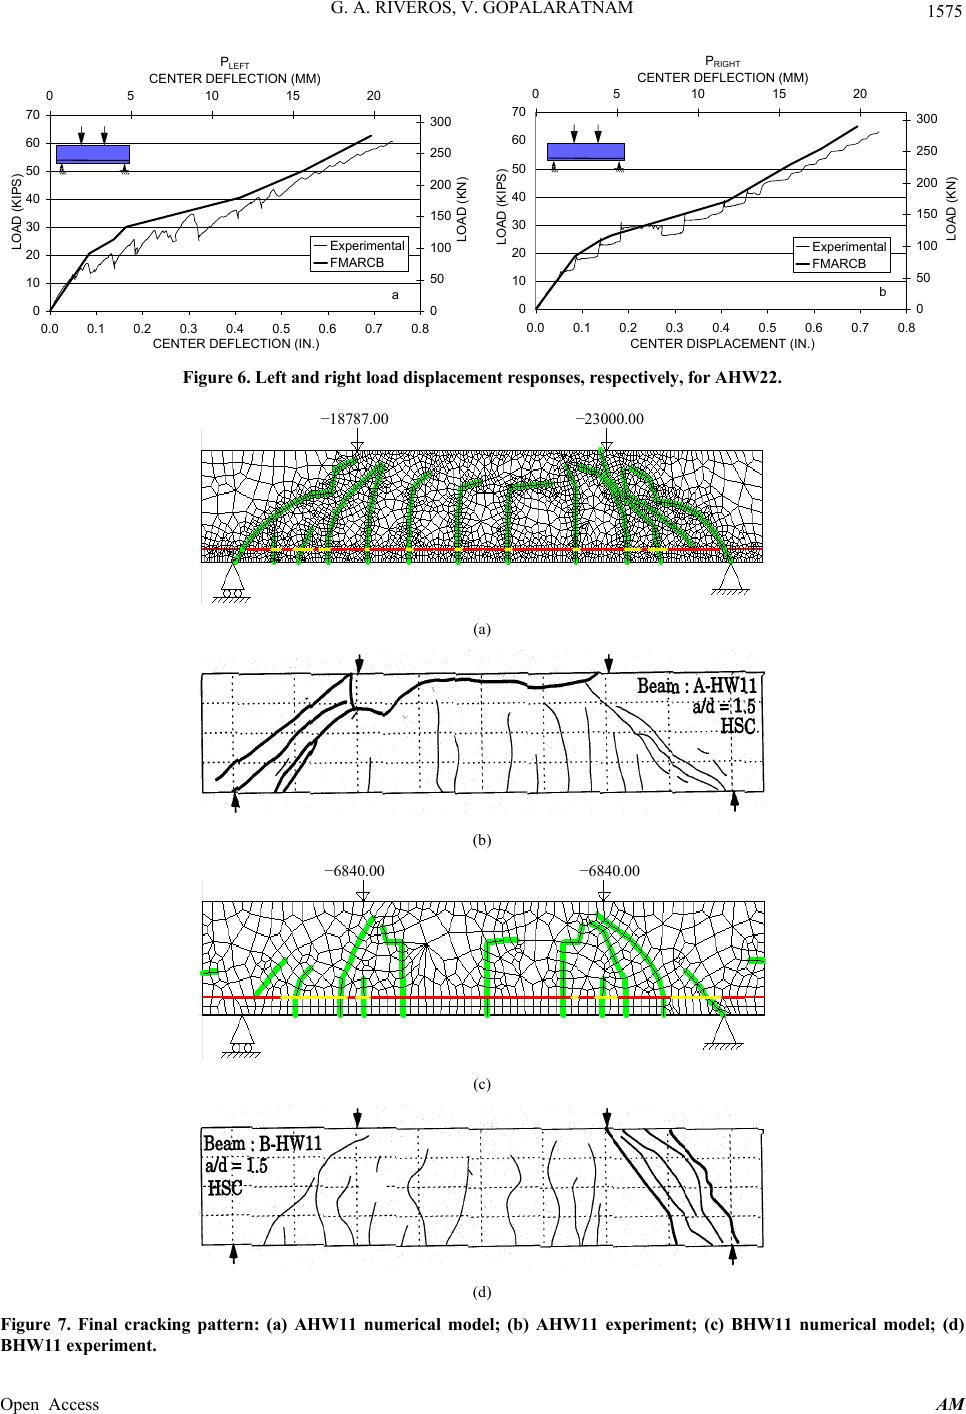 G. A. RIVEROS, V. GOPALARATNAM 1575 0 10 20 30 40 50 60 70 0.0 0.1 0.2 0.3 0.4 0.5 0.6 0.7 0.8 CENTER DEFLECTION (IN.) LOAD (KIPS ) 0 50 100 150 200 250 300 0510 15 20 P LEFT CENTER DEFLE CTION (MM) LOAD (KN) Experimental FMARCB a 0 10 20 30 40 50 60 70 0.0 0.1 0.2 0.30.4 0.5 0.6 0.7 0.8 CENTER DISPLACEMENT (IN.) LOAD (KIPS) 0 50 100 150 200 250 300 0510 15 20 P RIGHT CENTER DEFLECTION (MM) LOAD (KN) Experimental FMARCB b Figure 6. Left and right load displacement responses, respectively, for AHW22. −18787.00 −23000.00 (a) (b) −6840.00 −6840.00 (c) (d) Figure 7. Final cracking pattern: (a) AHW11 numerical model; (b) AHW11 experiment; (c) BHW11 numerical model; (d) BHW11 experiment. Open Access AM 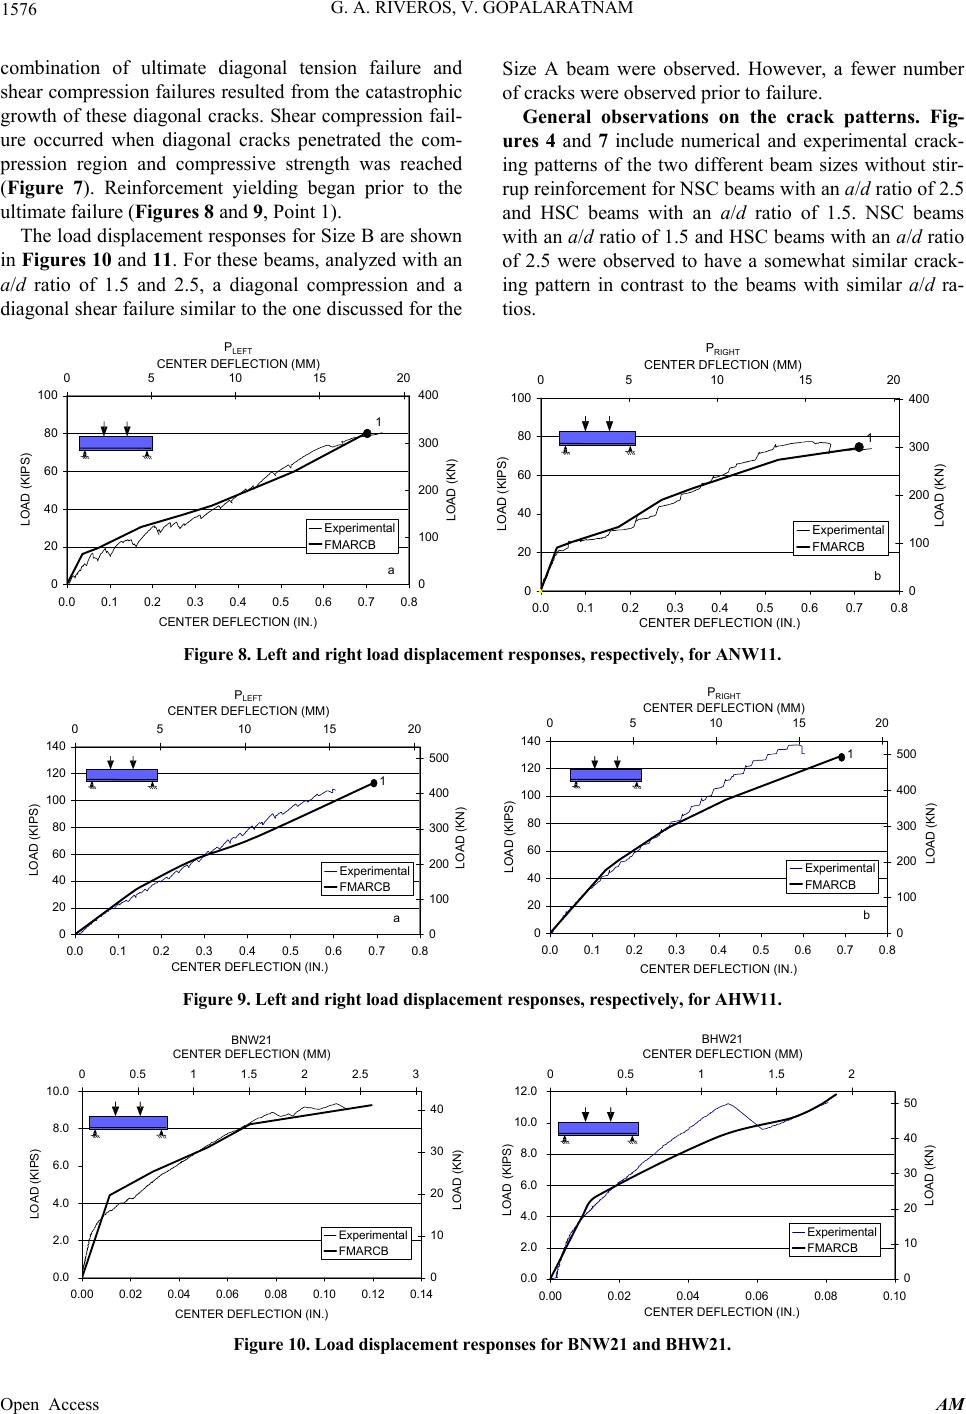 G. A. RIVEROS, V. GOPALARATNAM Open Access AM 1576 combination of ultimate diagonal tension failure and shear compression failures resulted from the catastrophic growth of these diagonal cracks. Shear compression fail- ure occurred when diagonal cracks penetrated the com- pression region and compressive strength was reached (Figure 7). Reinforcement yielding began prior to the ultimate failure (Figures 8 and 9, Point 1). The load displacement responses for Size B are shown in Figures 10 and 11. For these beams, analyzed with an a/d ratio of 1.5 and 2.5, a diagonal compression and a diagonal shear failure similar to the one discussed for the Size A beam were observed. However, a fewer number of cracks were observed prior to failure. General observations on the crack patterns. Fig- ures 4 and 7 include numerical and experimental crack- ing patterns of the two different beam sizes without stir- rup reinforcement for NSC beams with an a/d ratio of 2.5 and HSC beams with an a/d ratio of 1.5. NSC beams with an a/d ratio of 1.5 and HSC beams with an a/d ratio of 2.5 were observed to have a somewhat similar crack- ing pattern in contrast to the beams with similar a/d ra- tios. 0 20 40 60 80 100 0.0 0.1 0.2 0.3 0.4 0.50.6 0.7 0.8 CENTER DEFLECTION (IN.) LOAD (KIPS) 0 100 200 300 400 0510 15 20 P LEFT CENTER DEFLECTION (MM) LOAD (KN) Experimental FMARCB a 1 0 20 40 60 80 100 0.0 0.1 0.2 0.3 0.4 0.5 0.6 0.7 0.8 CENTER DEFLECTION (IN.) LOAD (KIPS) 0 100 200 300 400 0510 15 20 P RIGHT CENTER DFLECTION (MM) LOAD (KN) Experimental FMARCB b 1 Figure 8. Left and right load displacement responses, respectively, for ANW11. 0 20 40 60 80 100 120 140 0.0 0.1 0.2 0.3 0.4 0.5 0.6 0.7 0.8 CENTER DEFLECTION (IN.) LOAD (KIPS) 0 100 200 300 400 500 0510 15 20 P LEFT CENTER DEFLECTION (MM) LOAD (KN) Experimental FMARCB a 1 0 20 40 60 80 100 120 140 0.0 0.1 0.2 0.3 0.4 0.5 0.6 0.7 0.8 CENTER DEFLECTION (IN.) LOAD (KIPS) 0 100 200 300 400 500 0510 15 20 P RIGHT CENTER DEFLECTION (MM) LOAD (KN) Experimental FMARCB b 1 Figure 9. Left and right load displacement responses, respectively, for AHW11. 0.0 2.0 4.0 6.0 8.0 10.0 0.00 0.02 0.04 0.06 0.08 0.10 0.12 0.14 CENTER DEFLECTION (IN.) LOAD (KIPS) 0 10 20 30 40 00.511.522.53 BNW21 CENTER DEFLECTION (MM) LOAD (KN) Experimental FMARCB 0.0 2.0 4.0 6.0 8.0 10.0 12.0 0.00 0.02 0.04 0.06 0.08 0.10 CENTER DEFLECTION (IN.) LOAD (KIPS) 0 10 20 30 40 50 00.511.52 BHW21 CENTER DEFLECTION (MM) LOAD (KN) Experimental FMARCB Figure 10. Load displacement responses for BNW21 and BHW21. 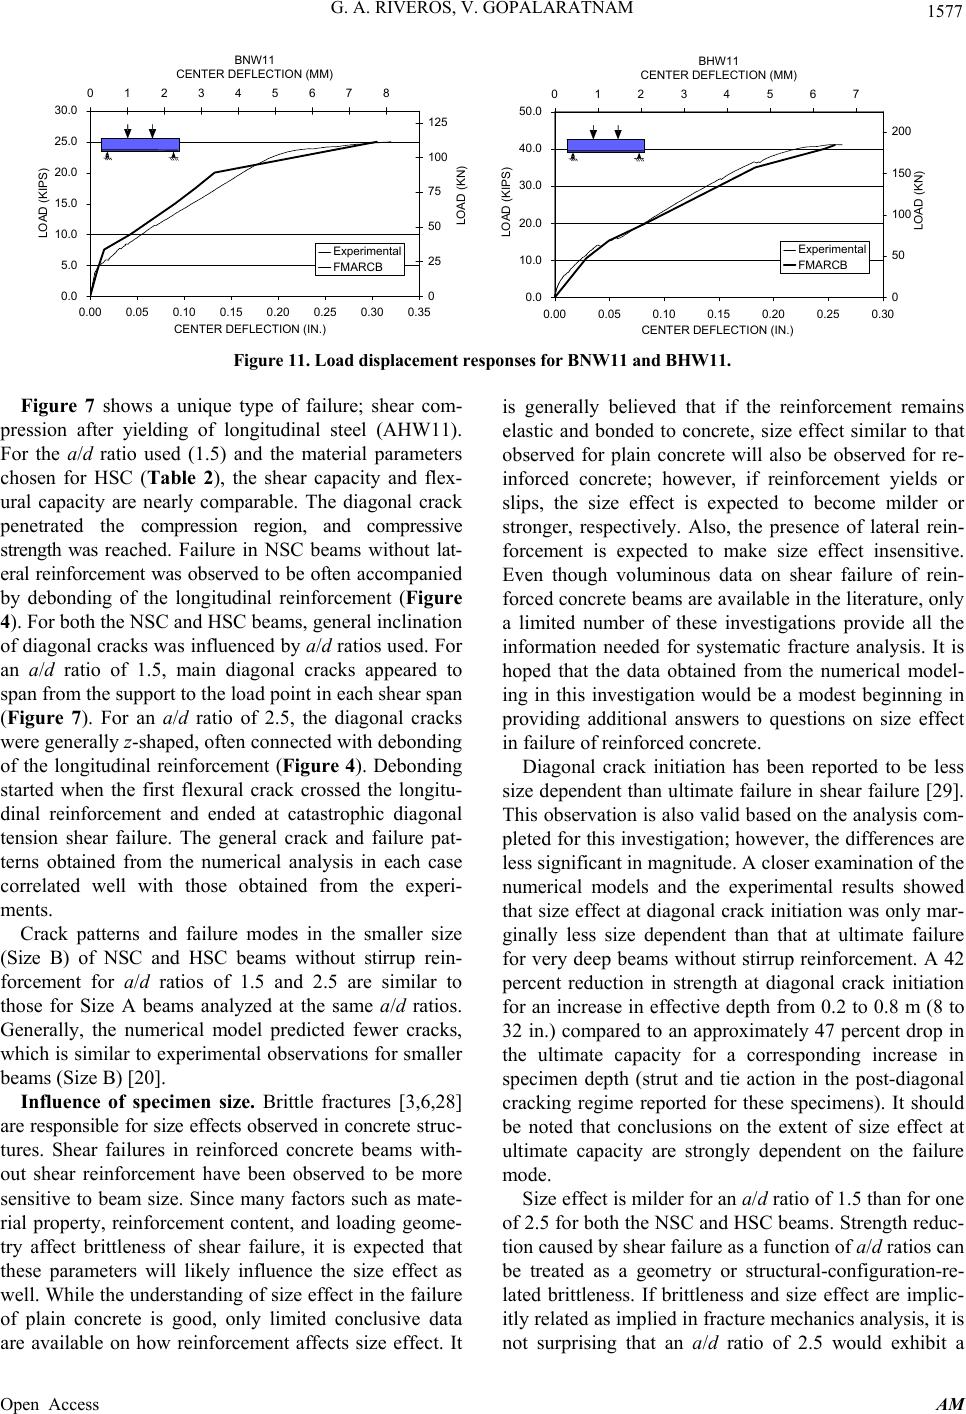 G. A. RIVEROS, V. GOPALARATNAM 1577 0.0 5.0 10.0 15.0 20.0 25.0 30.0 0.00 0.05 0.10 0.15 0.20 0.25 0.30 0.35 CENTER DEFLECTION (IN.) LOAD (KIPS) 0 25 50 75 100 125 012345678 BNW11 CENTER DEFLECTION (MM) LOAD (KN) Experimental FMARCB 0.0 10.0 20.0 30.0 40.0 50.0 0.00 0.05 0.10 0.15 0.20 0.25 0.30 CENTER DEFLECTION (IN.) LOAD (KIPS) 0 50 100 150 200 01234567 BHW11 CENTER DEFLECTION (MM) LOAD (KN) Experimental FMARCB Figure 11. Load displacement responses for BNW11 and BHW11. Figure 7 shows a unique type of failure; shear com- pression after yielding of longitudinal steel (AHW11). For the a/d ratio used (1.5) and the material parameters chosen for HSC (Table 2), the shear capacity and flex- ural capacity are nearly comparable. The diagonal crack penetrated the compression region, and compressive strength was reached. Failure in NSC beams without lat- eral reinforcement was observed to be often accompanied by debonding of the longitudinal reinforcement (Figure 4). For both the NSC and HSC beams, general inclination of diagonal cracks was influenced by a/d ratios used. For an a/d ratio of 1.5, main diagonal cracks appeared to span from the support to the load point in each shear span (Figure 7). For an a/d ratio of 2.5, the diagonal cracks were generally z-shaped, often connected with debonding of the longitudinal reinforcement (Figure 4). Debonding started when the first flexural crack crossed the longitu- dinal reinforcement and ended at catastrophic diagonal tension shear failure. The general crack and failure pat- terns obtained from the numerical analysis in each case correlated well with those obtained from the experi- ments. Crack patterns and failure modes in the smaller size (Size B) of NSC and HSC beams without stirrup rein- forcement for a/d ratios of 1.5 and 2.5 are similar to those for Size A beams analyzed at the same a/d ratios. Generally, the numerical model predicted fewer cracks, which is similar to experimental observations for smaller beams (Size B) [20]. Influence of specimen size. Brittle fractures [3,6,28] are responsible for size effects observed in concrete struc- tures. Shear failures in reinforced concrete beams with- out shear reinforcement have been observed to be more sensitive to beam size. Since many factors such as mate- rial property, reinforcement content, and loading geome- try affect brittleness of shear failure, it is expected that these parameters will likely influence the size effect as well. While the understanding of size effect in the failure of plain concrete is good, only limited conclusive data are available on how reinforcement affects size effect. It is generally believed that if the reinforcement remains elastic and bonded to concrete, size effect similar to that observed for plain concrete will also be observed for re- inforced concrete; however, if reinforcement yields or slips, the size effect is expected to become milder or stronger, respectively. Also, the presence of lateral rein- forcement is expected to make size effect insensitive. Even though voluminous data on shear failure of rein- forced concrete beams are available in the literature, only a limited number of these investigations provide all the information needed for systematic fracture analysis. It is hoped that the data obtained from the numerical model- ing in this investigation would be a modest beginning in providing additional answers to questions on size effect in failure of reinforced concrete. Diagonal crack initiation has been reported to be less size dependent than ultimate failure in shear failure [29]. This observation is also valid based on the analysis com- pleted for this investigation; however, the differences are less significant in magnitude. A closer examination of the numerical models and the experimental results showed that size effect at diagonal crack initiation was only mar- ginally less size dependent than that at ultimate failure for very deep beams without stirrup reinforcement. A 42 percent reduction in strength at diagonal crack initiation for an increase in effective depth from 0.2 to 0.8 m (8 to 32 in.) compared to an approximately 47 percent drop in the ultimate capacity for a corresponding increase in specimen depth (strut and tie action in the post-diagonal cracking regime reported for these specimens). It should be noted that conclusions on the extent of size effect at ultimate capacity are strongly dependent on the failure mode. Size effect is milder for an a/d ratio of 1.5 than for one of 2.5 for both the NSC and HSC beams. Strength reduc- tion caused by shear failure as a function of a/d ratios can be treated as a geometry or structural-configuration-re- lated brittleness. If brittleness and size effect are implic- itly related as implied in fracture mechanics analysis, it is not surprising that an a/d ratio of 2.5 would exhibit a Open Access AM 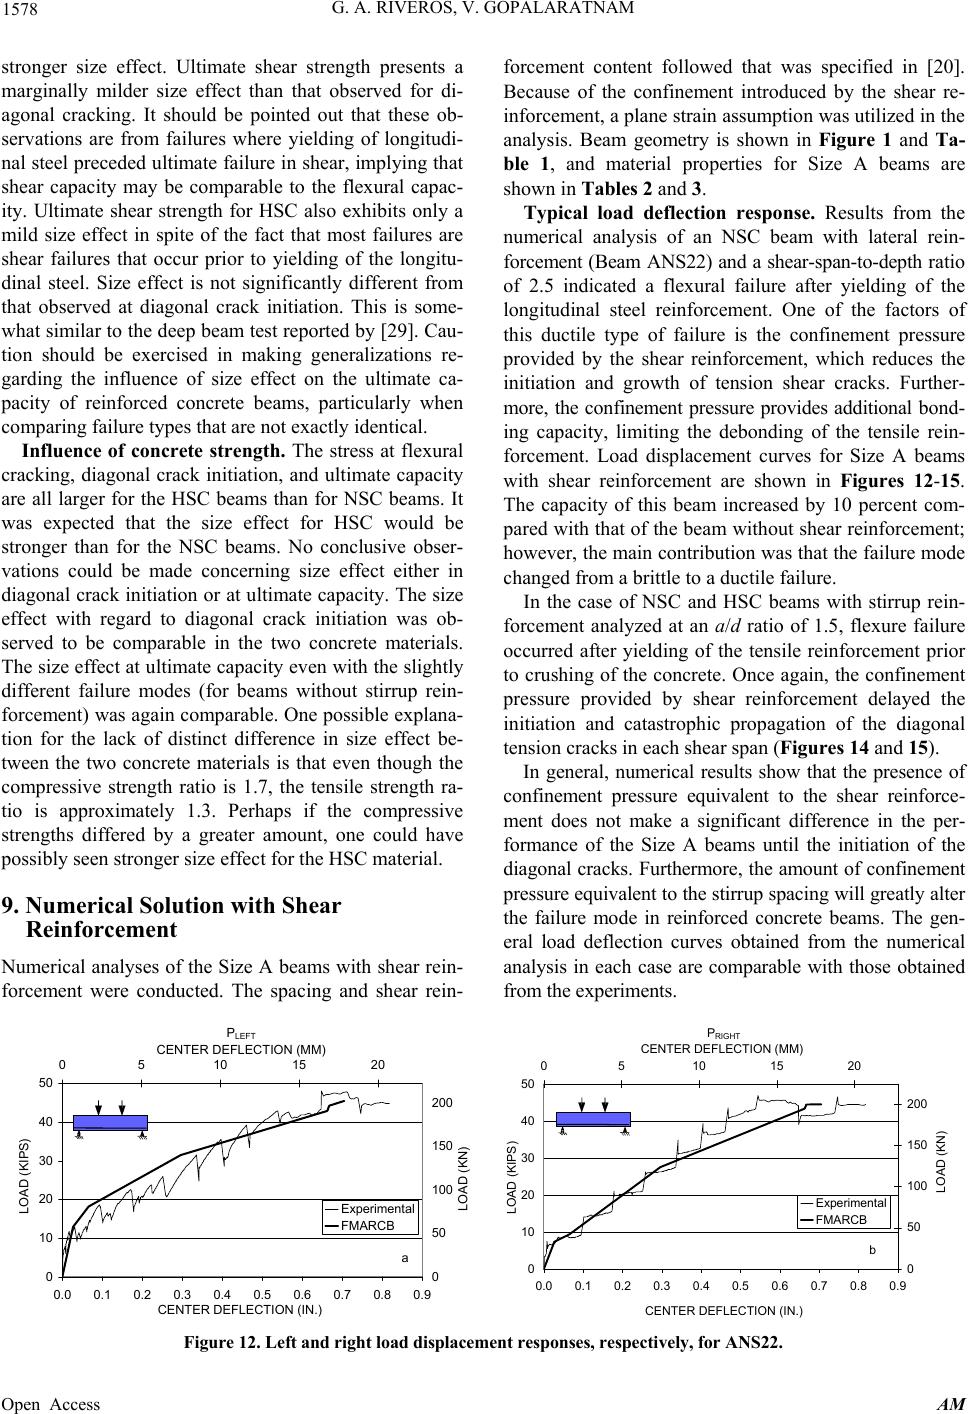 G. A. RIVEROS, V. GOPALARATNAM 1578 stronger size effect. Ultimate shear strength presents a marginally milder size effect than that observed for di- agonal cracking. It should be pointed out that these ob- servations are from failures where yielding of longitudi- nal steel preceded ultimate failure in shear, implying that shear capacity may be comparable to the flexural capac- ity. Ultimate shear strength for HSC also exhibits only a mild size effect in spite of the fact that most failures are shear failures that occur prior to yielding of the longitu- dinal steel. Size effect is not significantly different from that observed at diagonal crack initiation. This is some- what similar to the deep beam test reported by [29]. Cau- tion should be exercised in making generalizations re- garding the influence of size effect on the ultimate ca- pacity of reinforced concrete beams, particularly when comparing failure types that are not exactly identical. Influence of concrete strength. The stress at flexural cracking, diagonal crack initiation, and ultimate capacity are all larger for the HSC beams than for NSC beams. It was expected that the size effect for HSC would be stronger than for the NSC beams. No conclusive obser- vations could be made concerning size effect either in diagonal crack initiation or at ultimate capacity. The size effect with regard to diagonal crack initiation was ob- served to be comparable in the two concrete materials. The size effect at ultimate capacity even with the slightly different failure modes (for beams without stirrup rein- forcement) was again comparable. One possible explana- tion for the lack of distinct difference in size effect be- tween the two concrete materials is that even though the compressive strength ratio is 1.7, the tensile strength ra- tio is approximately 1.3. Perhaps if the compressive strengths differed by a greater amount, one could have possibly seen stronger size effect for the HSC material. 9. Numerical Solution with Shear Reinforcement Numerical analyses of the Size A beams with shear rein- forcement were conducted. The spacing and shear rein- forcement content followed that was specified in [20]. Because of the confinement introduced by the shear re- inforcement, a plane strain assumption was utilized in the analysis. Beam geometry is shown in Figure 1 and Ta- ble 1, and material properties for Size A beams are shown in Tables 2 and 3. Typical load deflection response. Results from the numerical analysis of an NSC beam with lateral rein- forcement (Beam ANS22) and a shear-span-to-depth ratio of 2.5 indicated a flexural failure after yielding of the longitudinal steel reinforcement. One of the factors of this ductile type of failure is the confinement pressure provided by the shear reinforcement, which reduces the initiation and growth of tension shear cracks. Further- more, the confinement pressure provides additional bond- ing capacity, limiting the debonding of the tensile rein- forcement. Load displacement curves for Size A beams with shear reinforcement are shown in Figures 12-15. The capacity of this beam increased by 10 percent com- pared with that of the beam without shear reinforcement; however, the main contribution was that the failure mode changed from a brittle to a ductile failure. In the case of NSC and HSC beams with stirrup rein- forcement analyzed at an a/d ratio of 1.5, flexure failure occurred after yielding of the tensile reinforcement prior to crushing of the concrete. Once again, the confinement pressure provided by shear reinforcement delayed the initiation and catastrophic propagation of the diagonal tension cracks in each shear span (Figures 14 and 15). In general, numerical results show that the presence of confinement pressure equivalent to the shear reinforce- ment does not make a significant difference in the per- formance of the Size A beams until the initiation of the diagonal cracks. Furthermore, the amount of confinement pressure equivalent to the stirrup spacing will greatly alter the failure mode in reinforced concrete beams. The gen- eral load deflection curves obtained from the numerical analysis in each case are comparable with those obtained from the experiments. 0 10 20 30 40 50 0.0 0.1 0.2 0.3 0.4 0.5 0.6 0.7 0.8 0.9 CENTER DEFLECTION (IN.) LOAD (KIPS) 0 50 100 150 200 0510 15 20 P LEFT CENTER DEFLECTION (MM) LOAD (KN) Experime ntal FMARCB a 0 10 20 30 40 50 0.0 0.1 0.2 0.3 0.4 0.50.6 0.7 0.8 0.9 CENTER DEFLEC TI ON (I N.) LOAD (KIPS) 0 50 100 150 200 0510 15 20 P RIGHT CENTER DEFLECTION (MM) LOAD (KN) Experimental FMARCB b Figure 12. Left and right load displacement respons es, respectively, for ANS22. Open Access AM 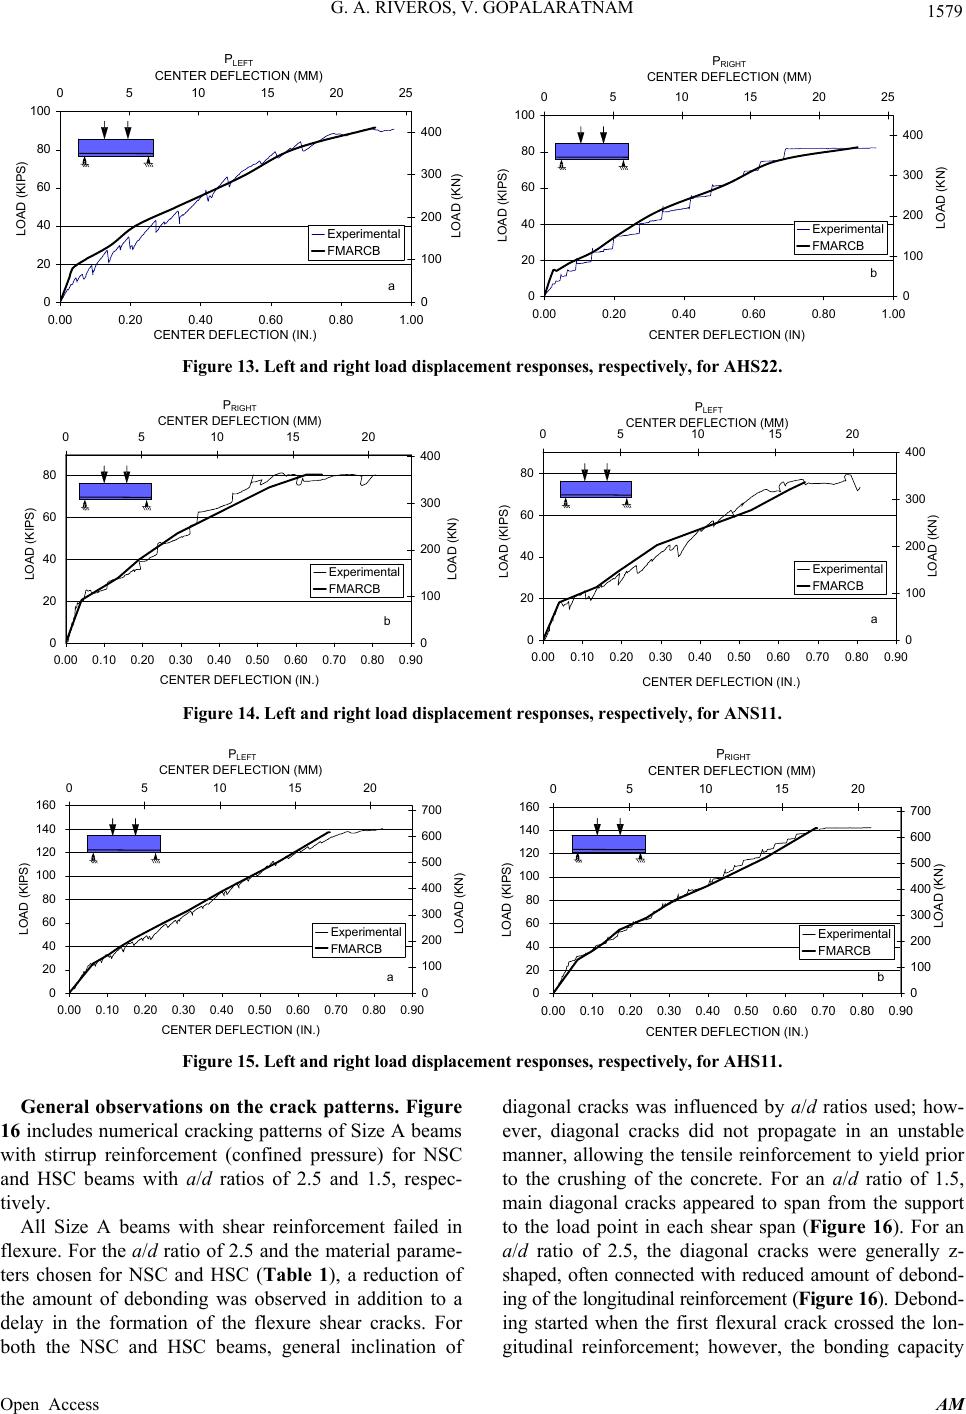 G. A. RIVEROS, V. GOPALARATNAM 1579 0 20 40 60 80 100 0.00 0.20 0.400.60 0.80 1.00 CENTER DEFLECTION (IN.) LOAD (KIPS) 0 100 200 300 400 0510 15 20 25 LEFT CENTER DEFLECTION (MM) LOAD (KN) Experimental FMARCB a 0 20 40 60 80 100 0.00 0.20 0.40 0.60 0.80 1.00 CENTER DEFLECTION (IN) LOAD (KIPS) 0 100 200 300 400 0510 15 20 25 P RIGHT CENTER DEFLECTION (MM) LOAD (KN) Experimental FMARCB b Figure 13. Left and right load displacement respons es, respectively, for AHS22. 0 20 40 60 80 0.00 0.10 0.20 0.30 0.40 0.50 0.60 0.70 0.80 0.90 CENTER DEFLECTION (I N.) LOAD (KIPS) 0 100 200 300 400 0510 15 20 PRIGHT CENTER DEFLECTION (MM) LOAD (KN) Experimental FMARCB b 0 20 40 60 80 0.00 0.10 0.20 0.30 0.40 0.50 0.60 0.70 0.80 0.90 CENTER DEFLECTION (IN.) LOAD (KIPS) 0 100 200 300 400 051015 20 P LEFT CENTER DEFLECTION (MM) LOAD (KN) Experimental FMARCB a Figure 14. Left and right load displacement respons es, respectively, for ANS11. 0 20 40 60 80 100 120 140 160 0.00 0.10 0.20 0.30 0.40 0.50 0.60 0.70 0.80 0.90 CENTER DEFLECTION (IN.) LOAD (KIPS) 0 100 200 300 400 500 600 700 0510 15 20 P LEFT CENTER DEFLECTION (MM) LOAD (KN) Experimental FMARCB a 0 20 40 60 80 100 120 140 160 0.00 0.100.20 0.30 0.400.500.60 0.700.80 0.90 CENTER DEFLECTION (IN.) LOAD (KIPS) 0 100 200 300 400 500 600 700 051015 20 P RIGHT CENTER DEFLECTION (MM) LOAD (KN) Experimental FMARCB b Figure 15. Left and right load displacement respons es, respectively, for AHS11. General observations on the crack patterns. Figure 16 includes numerical cracking patterns of Size A beams with stirrup reinforcement (confined pressure) for NSC and HSC beams with a/d ratios of 2.5 and 1.5, respec- tively. All Size A beams with shear reinforcement failed in flexure. For the a/d ratio of 2.5 and the material parame- ters chosen for NSC and HSC (Table 1), a reduction of the amount of debonding was observed in addition to a delay in the formation of the flexure shear cracks. For both the NSC and HSC beams, general inclination of diagonal cracks was influenced by a/d ratios used; how- ever, diagonal cracks did not propagate in an unstable manner, allowing the tensile reinforcement to yield prior to the crushing of the concrete. For an a/d ratio of 1.5, main diagonal cracks appeared to span from the support to the load point in each shear span (Figure 16). For an a/d ratio of 2.5, the diagonal cracks were generally z- shaped, often connected with reduced amount of debond- ing of the longitudinal reinforcement (Figure 16). Debond- ing started when the first flexural crack crossed the lon- gitudinal reinforcement; however, the bonding capacity Open Access AM 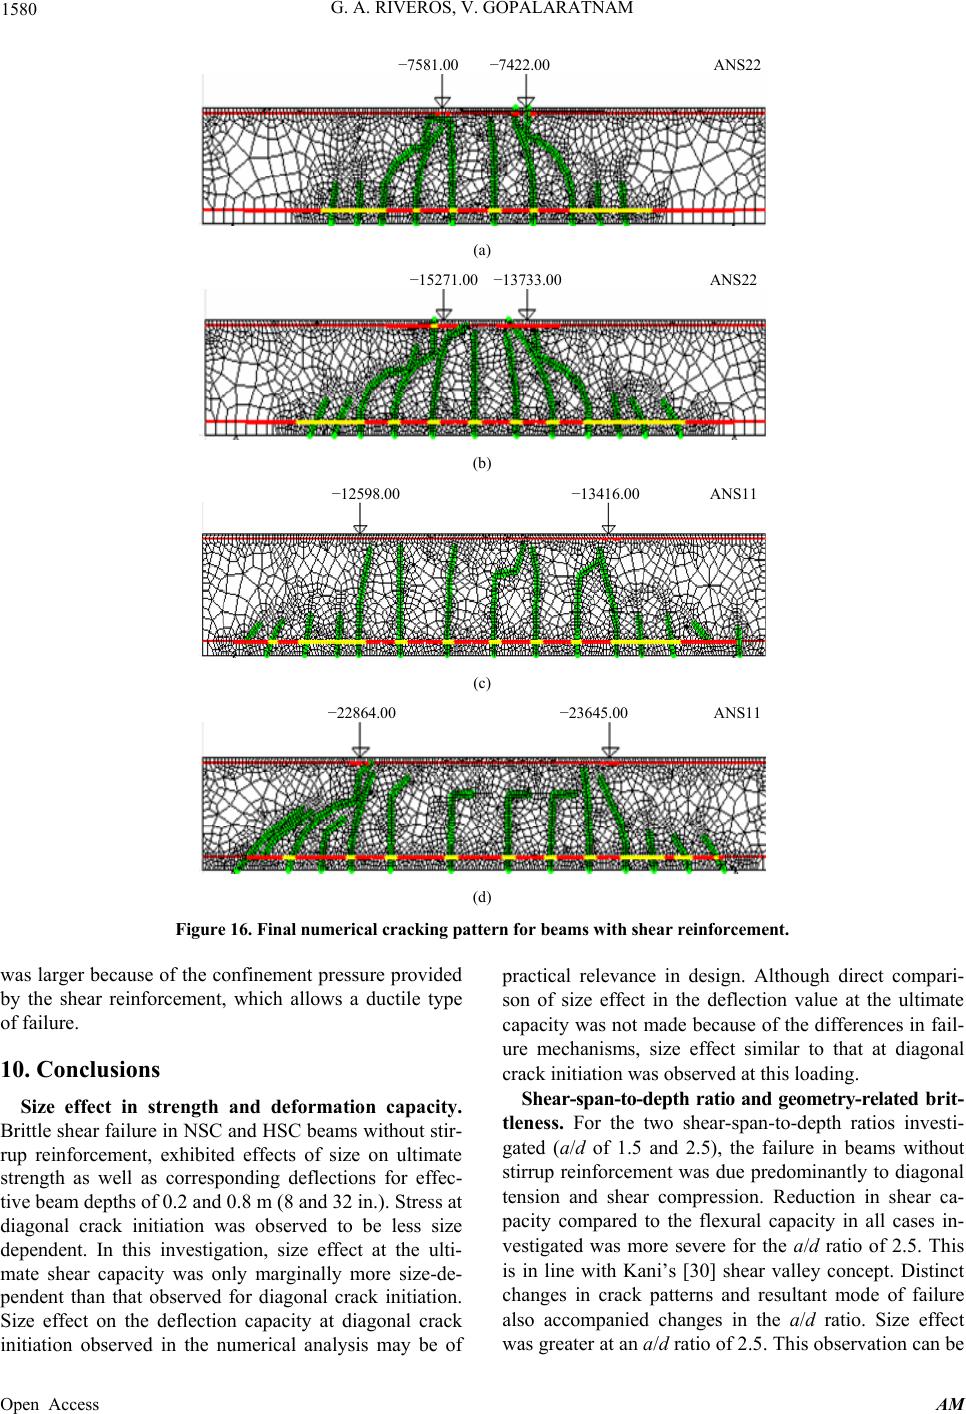 G. A. RIVEROS, V. GOPALARATNAM 1580 −7581.00 −7422.00 ANS22 (a) −15271.00 −13733.00 ANS22 (b) −12598.00 −13416.00 ANS11 (c) −22864.00 −23645.00 ANS11 (d) Figure 16. Final nu merical cracking pattern for beams with shear rein forcement. was larger because of the confinement pressure provided by the shear reinforcement, which allows a ductile type of failure. 10. Conclusions Size effect in strength and deformation capacity. Brittle shear failure in NSC and HSC beams without stir- rup reinforcement, exhibited effects of size on ultimate strength as well as corresponding deflections for effec- tive beam depths of 0.2 and 0.8 m (8 and 32 in.). Stress at diagonal crack initiation was observed to be less size dependent. In this investigation, size effect at the ulti- mate shear capacity was only marginally more size-de- pendent than that observed for diagonal crack initiation. Size effect on the deflection capacity at diagonal crack initiation observed in the numerical analysis may be of practical relevance in design. Although direct compari- son of size effect in the deflection value at the ultimate capacity was not made because of the differences in fail- ure mechanisms, size effect similar to that at diagonal crack initiation was observed at this loading. Shear-span-to-depth ratio and geometry-related bri t- tleness. For the two shear-span-to-depth ratios investi- gated (a/d of 1.5 and 2.5), the failure in beams without stirrup reinforcement was due predominantly to diagonal tension and shear compression. Reduction in shear ca- pacity compared to the flexural capacity in all cases in- vestigated was more severe for the a/d ratio of 2.5. This is in line with Kani’s [30] shear valley concept. Distinct changes in crack patterns and resultant mode of failure also accompanied changes in the a/d ratio. Size effect was greater at an a/d ratio of 2.5. This observation can be Open Access AM  G. A. RIVEROS, V. GOPALARATNAM 1581 treated as geometry-related brittleness in analytical mod- els. Concrete compressive strength. The shear strength of HSC beams (compressive strength of 70 MPa (10,000 psi)) was markedly higher than that of NSC beams (com- pressive strength 43 MPa (6250 psi)) at diagonal crack initiation and at the ultimate capacity. Even while the HSC was more brittle than the NSC, no noticeable dif- ferences in the size effect on failure loads were observed. Nonlinear fracture mechanics-based model. The nonlinear fracture mechanics-based numerical model described herein has unique features including automated crack initiation and propagation, automated remeshing, and solution of several nonlinear phenomena (concrete softening in tension and compression, bond slip, and yielding of reinforcement). The numerical model developed to study the shear be- havior of reinforced concrete deep beams has been vali- dated with eight beams of two different sizes with dif- ferent material properties and loading geometries. The model successfully predicted the ultimate capacity of the beams described herein. The model shows good correla- tion between the predicted cracking pattern and the ex- perimental cracking pattern. It also predicted the load displacement response successfully. Bond-slip character- istics exert significant influence on load deflection char- acteristics of the reinforced concrete deep beams and should be implicitly incorporated into any numerical fracture model for the flexural behavior of reinforced concrete beams. The model also shows no need to use the shear capacity for the tension softening. 11. Acknowledgements The development of the numerical model was funded by the Computer-Aided Structural Engineering (CASE) Pro- ject of the US Army Corps of Engineers and the Infor- mation Technology Laboratory (ITL) of the US Army Engineer Research and Development Center (ERDC). Mr. Amos Chase, Scientific Applications International Cor- poration, and Mr. Barry White, ITL, made significant contributions to writing the computer code. Permission was granted by the Chief of Engineers to publish this information. REFERENCES [1] ACI Committee 318, “Building Code Requirements for Structural Concrete and Commentary (ACI 318-95 and 318R-95),” American Concrete Institute, Detroit, 2008. [2] A. Hillerborg, M. Modeer and P. E. Peterson, “Analysis of Crack Formation and Crack Growth in Concrete by Means of Fracture Mechanics and Finite Element,” Ce- ment and Concrete Research, Vol. 6, No. 6, 1976, pp. 773-782. http://dx.doi.org/10.1016/0008-8846(76)90007-7 [3] ACI Committee 446, “Fracture Mechanics of Concrete: Concepts, Models and Determination of Material Proper- ties,” ACI 446.1R-91, Reported by ACI Committee 446, Detroit, 1991. [4] American Concrete Institute (ACI), “Finite Element Ana- lysis of Fracture in Concrete Structures: State-of-the- Art,” ACI 446.3R-97, Reported by ACI Committee 446, Detroit, 1997. [5] T. L. Anderson, “Fracture Mechanics, Fundamentals and Applications,” 2nd Edition, CRC Press, Washington DC, 1994. [6] Z. P. Bažant and J. Planas, “Fracture and Size Effects in Concrete and Other Quasibrittle Materials,” CRC Press, Washington DC, 1997. [7] ACI Committee 446, “Fracture Mechanics Applications to Concrete Structures and Implications with Regard to the Code,” American Concrete Institute, Detroit, 1992. [8] Y. R. Rashid. “Analysis of Pre-Stressed Concrete Pres- sure Vessels,” Nuclear Engineering and Design, Vol. 7, No. 4, 1968, pp. 334-355. http://dx.doi.org/10.1016/0029-5493(68)90066-6 [9] Z. P. Bažant, “Comment on Hillerborg’s Comparison of Size Effect Law with Fictitious Crack Model,” Dei Poli Anniversary Volume, Politecnico di Milano, 1985, pp. 335-338. [10] ASCE Committee 447, “State of the Art Report on Finite Element Analysis of Reinforced Concrete,” American Society of Civil Engineers, New York, 1982, p. 545. [11] ASCE Committee 447, “State of the Art Report on Finite Element Analysis of Reinforced Concrete,” American Society of Civil Engineers, New York, 1994, p. 545. [12] Comite Euro-International du Beton (CEB) and the Fe- deration Internationale de la Precontrainte (FIP), “CEB- FIP Model Code 1990,” CEB Bulletin D’Information No. 213/214, Lausanne, 1993. [13] D. Coronelli and G. Mulas, “Modeling of Shear Behavior in Reinforced Concrete Beams,” ACI Structural Journal, Vol. 103, No. 3, 2006, pp. 372-382. [14] A. Hillerborg, “Analysis of One Single Crack,” In: F. H. Wittmann, Ed., Fracture Mechanics on Concrete, Devel- opment in Civil Engineering, Elsevier Science Publishers, Amsterdam, 1983, pp. 223-249. [15] Z. P. Bažant and V. S. Gopalaratnam, “Fracture Mechan- ics of Concrete: An Apercu of Basic Concepts and Mod- els,” Proceedings of the First International Conference on Fracture Mechanics of Concrete Structures, Brecken- ridge, Colorado, 1-5 June 1992, pp. 145-154. [16] S. P. Shah, A. Fafitis and R. Arnold, “Cyclic Loading of Spirally Reinforced Concrete.” Journal of the Structural Division, Vol. 109, No. ST7, 1983, pp. 1695-1710. http://dx.doi.org/10.1061/(ASCE)0733-9445(1983)109:7( 1695) [17] S. Hayashi and S. Kokusho, “Bond Behavior in the Neighborhood of the Crack,” Finite Element Analysis of Reinforced Concrete Structures; Proceedings of the Semi- nar Sponsored by the Japan Society for the Promotion of Science and the US National Science Foundation, Tokyo, 21-24 May 1985, pp. 364-373. Open Access AM  G. A. RIVEROS, V. GOPALARATNAM Open Access AM 1582 [18] J. Ruppert, “A Delaunay Refinement Algorithm for Qual- ity 2-Dimensional Mesh Generation,” Journal of Algo- rithms, Vol. 18, No. 3, 1995, pp. 548-585. http://dx.doi.org/10.1006/jagm.1995.1021 [19] S. J. Owen, M. L. Staten, S. A. Canann and S. Saigal. “Q- Morph: An Indirect Approach to Advancing Front Quad Meshing,” International Journal for Numerical Methods in Engineering, Vol. 9, No. 44, 1999, pp. 1317-1340. http://dx.doi.org/10.1002/(SICI)1097-0207(19990330)44: 9<1317::AID-NME532>3.0.CO;2-N [20] M. G. Khorasgany, “Size Effect in Shear Failure of Nor- mal and High Strength RC Beams,” Ph.D. Dissertation, University of Missouri, Columbia, 1994. [21] M. G. Khorasgany and V. S. Gopalaratnam, “Shear Strength of Concrete—Size and Other Influences,” Size Effect in Concrete Structures: Proceedings of the Japan Concrete Institute International Workshop, Sendai, 31 October-2 November 1993, pp. 67-78. [22] V. S. Gopalaratman and S. P. Shah, “Softening Response of Plain Concrete in Direct Tension,” ACI Journal, Vol. 82, No. 3, 1985, pp. 310-323. [23] G. A. Riveros, V. S. Gopalaratnam and A. Chase, “User’s Guide: Fracture Mechanics Analysis of Reinforced Con- crete Beams (FMARCB),” ERDC/ITL TR-08-1, US Army, Engineer Research and Development Center, Vicksburg, 2008. [24] P. E. Petterson, “Crack Growth and Development of Fracture Zone in Plane Concrete and Similar Materials,” Report No. TVBM-1006, Division of Building Materials, Lund Institute of Technology, Lund, 1981. [25] W. H. Gestle and M. Xie, “FEM Modeling of Fictitious Crack Propagation in Concrete,” Journal of Engineering Mechanics, Vol. 118, No. 2, 1992, pp. 416-434. http://dx.doi.org/10.1061/(ASCE)0733-9399(1992)118:2( 416) [26] M. Keuser and G. Mehlborn, “Finite Element Models for Bond Problems,” Journal of Structural Engineering, Vol. 113, No. 10, 1987, pp. 2160-2173. http://dx.doi.org/10.1061/(ASCE)0733-9445(1987)113:10 (2160) [27] A. C. Scordelis and D. Ngo, “Finite Element Analysis of Reinforced Concrete Beams,” ACI Journal, Vol. 64, No. 3, 1967, pp. 152-163. [28] A. Carpinteri, “Size Effect in Fracture Toughness Testing: A Dimensional Analysis Approach,” Proceedings of an International Conference on Analytical and Experimental Fracture Mechanics, Rome, 23-27 June 1980, pp. 785- 797. [29] J. C. Walreven. “Scale Effects in Beams without Rein- forced Webs, Loaded in Shear,” Progress in Concrete Research, Annual Report, Vol. 1, No. 99, 1990, pp. 101- 112. [30] G. N. J. Kani, “How Safe Are Our Large Reinforced Con- crete Beams?” Proceedings of ACI Structural Journal, Vol. 64, No. 3, 1967, pp. 128-141. Notation Gf = fracture energy H = beam height The following symbols are used in this paper: k = constant that was statistically evaluated from ex- perimental data of unconfined and confined concrete subjected to monotonically increasing loading A = constant that was statistically evaluated from ex- perimental data of unconfined and confined concrete subjected to monotonically increasing loading L = beam length As = tension steel reinforcement area S = distance between beam supports = compression steel reinforcement area s = spacing between stirrups on beam geometry defini- tion Av = area of the lateral (shear) reinforcement a/d = shear-span-to-depth ratio = slip on bond-slip curve definition b = width of beam t = thickness d = effective depth uc, us = displacement of concrete and steel, respec- tively dc = concrete core diameter ds = bar diameter wc = critical crack opening displacement value E = modulus of elasticity x = distance from the crack-rebar intersection center line to the desirable location Ec = secant modulus of elasticity Es = module of elasticity of the reinforcement = reduction factor f = concrete stress at a predefined strain ε = predefined concrete strain c fr = confinement pressure f = compressive strength ε0 = peak strain ν = Poisson’s ratio ft = tensile strength τmax, τmi n = maximum and minimum bonding strengths, respectively fy = yield strength of the reinforcement f 0 = peak stress
|