Circuits and Systems
Vol.07 No.11(2016), Article ID:71075,17 pages
10.4236/cs.2016.711330
Experimental Processus for Acquisition Automatic Features of I-V Properties and Temperature of the Solar Panel by Changing the Operating Point
Babou Dione1, Ousmane Sow2, Mamadou Wade3, L. Y. Ibrahima3, Senghane Mbodji4, Gregoire Sissoko1
1Laboratory of Semiconductors and Solar Energy, Physics Department, Faculty of Science and Technology, University Cheikh Anta Diop, Dakar, Senegal
2University Institute of Technology, University of Thiès, Thiès, Sénégal
3Polytechnic School of Thiès, Thiès, Sénégal
4Université Alioune DIOP de Bambey, Bambey, Sénégal

Copyright © 2016 by authors and Scientific Research Publishing Inc.
This work is licensed under the Creative Commons Attribution International License (CC BY 4.0).
http://creativecommons.org/licenses/by/4.0/


Received: April 17, 2016; Accepted: May 15, 2016; Published: September 30, 2016
ABSTRACT
A development of an acquisition of the characteristic of a solar panel by automatic load variation system is put into play and coupled to an instrumentation chain for taking account of temperature. A programmed digital microprocessor control enables this automation. Design and implementation of a device for automation of variations of the resistive load are powered by solar panel. It is provided by a PIC 16F877A running a computer program that we have developed on the basis of an algorithm according to the operation that we have set. By varying automatically the resistive load, we were able to automatically acquire the characteristic I-V and temperature of the solar panel. With automatic combinations of the 10 resistors, we have obtained 1024 measures of the characteristic curve of the solar cell which has a good accuracy. The change in load and temperature measurement allows us to have the characteristic curves parameterized by temperature.
Keywords:
Microcontroller, Solar Panel, Temperature, I-V, PIC 16F877A

1. Introduction
The use of solar panels as an energy producer has revealed a real need to study it in order to optimize and therefore develop the exploitation of this source of clean renouvenable energy [1] . The research has shown that the functioning of the solar panels is strongly dependent on several parameters: some are external i.e. sunshine and temperature and other internal such as the development of device technology [2] .
Therefore, the experiment should lead to results similar to the theory [3] .
Thus, to cope the demand and competition from other energy sources, it is necessary to have a good knowledge on the conversion process of sunlight which will allow designing powerful solar cells and low cost [4] [5] .
Our study focuses on the characteristic I-V and the temperature of a solar cell using an experimental device automatic of the resistive load with a microcontroller [6] [7] that is running a C language program code [8] [9] .
With the automation of the change in operating point, based on a mathematical control law, we can impose a particular operation for the study of a phenomenon with given parameters.
Also we can move from static study to dynamic study with the same experimental device. This work helps to characterize the solar cell to optimize its use.
2. Automatic Change of the Resistive Load of a Solar Panel
The basic circuit for the characterization of the solar generator is shown in Figure 1.
We designed a device who gets this characterization so the microcontroller will execute two programs: a program for the static mode and one for the dynamic mode.
2.1. Automatic Processus of the Variation of a Resistive Load of a Solar Panel
We have set up a device consisting of a together of resistor in parallel. Electronic Digital will allow us to remotely control the value of an equivalent electrical resistance [10] [11] , which is shown in the following Figure 2.
The n resistors into play participate of the association the parallel of resistance following the binary state attributed to them.
Ti is a binary number that takes two values: logic zero (0) if the corresponding Ri is not part in the association or logical (1) if the corresponding R is part of the association. So we have an equivalent resistance that is given by:

Figure 1. Schematic representation for the characterization of the solar panel.
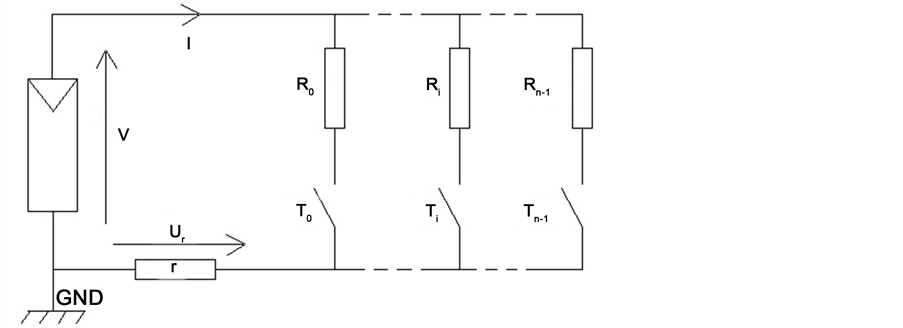
Figure 2. Schematic representation for a solar panel automatic characterization.
 (1)
(1)
Notice that this equivalent resistance is a numerical function given in terms of Ti [12] .
This digital function has a countable number N of defined values. The following relationship expresses N in terms of n [9] and is given by  [13] .
We chose as switches of the transistors and this Figure 3 is a schematic of principle characterization [14] .
So with our transistors that operate in switching mode, we have  operating points. Corresponding to
  to our example and thus of 1024 current-voltage couples.
The equivalent resistance is obtained by the binary signals produced by the sequence and that is applied to the transistors.
2.2. The Digital Control Resistance Control Law
The law of digital control operates using binary signals. So for our example
 (2)
(2)
The theory of numbering systems allows us to write [15]
 (3)
(3)
This will make that D is a whole integer with value 2n defined: 0 à which will make 1024 value [4] .
As D is a function of T and Réq also, so we can express Réq with D.
This will allow us to write by asking [8] :
 (4)
(4)
We are getting
 (5)
(5)
The choice of the value of resistance is arbitrary but we have also taken into account

Figure 3. Schematic of principle for the solar panel automatic characterization.
standardized commercial values of resistors and the recurrence relation will help us to calculate the others remaining resistance [8] . The recurrence relation is given by this formula:
 (6)
(6)
where we have
 (7)
(7)
With N = 10, we arbitrarily assigned to the lowest resistance of value 10 and from equation 7 we obtain the following Table 1.
The rule is as follows:
 (8)
(8)
3. Acquisition of Temperature
The choice of the temperature sensor is made on a sensor that does not require external calibrations to give an accuracy of ±0.5˚C over a temperature ranging between −40˚C and 85˚C. This sensor is characterized by the equation:
 (9)
(9)
The sensor is placed directly on the solar panel. Indeed, according to the technical data we consulted, manufacturers offer solar panels operating in a temperature range between −40˚C and 85˚C. So that with a solar panel whose maximum operating temperature Tmax = 85˚C, we will have a voltage.
 (10)
(10)
This voltage is low compared to the voltage which the microcontroller used for conversion which is between 0 - 5 V. In addition to this, the temperature is an analog quantity. The goal is to use all the microcontroller conversion range for better accuracy; we will have to use an amplifier. The characteristic amplifier is adapted to solar panels having operating temperatures between −40˚C and 85˚C. We can look Figure 4.

Table 1. Values for resistances regularized.

Figure 4. Diagram of the amplifier.
This amplifier will enable us to achieve a tension close to the microcontroller voltage conversion using its characteristic equation:
 (11)
(11)
is the gain of an amplifier
 (12)
(12)
So with a solar panel with a maximum operating temperature Tmax = 85˚C, we have:

This leads with a voltage of 5 V we will gain: 5 V = 0.85 ´ G where G = 5.88.
As the temperature an analog quantity and the peak processes digital data it will have to use a digital to analog converter to pass the signal peak.
3.1. Analog/Digital Conversion by the PIC 16F877A
The analog-digital converter has a resolution of 10 bits. It has eight (8) analog inputs on two (2) ports (PORTA and PORTE). The conversion happens in 2 phases:
The first time the signal to be converted is applied to the input to convert this signal must be present at least during the time Tacq (acquisition time of about 20 μS to 5 V).
The converter is shown schematically in Figure 5.
-2nd time: the conversion.
The minimum conversion time is 12 TAD (TAD is the conversion time depending on the internal clock, typically 1.6 μS).

Figure 5. Wiring of the analog to digital converter.
A conversion always begins by making 1 GO/DONE bit of ADCON0 register. When the conversion is complete this bit back to 0.
So to read the result in the ADRESL and ADRESH records and just wait that bit GO/DONE changes to 0 [10] .
The resulting value of the N conversion ADRESH: ADRESL is equal to:
 (13)
(13)
If  and
and  then
then
 (14)
(14)
But before making a conversion must define the configuration of the converter:
-The number of analog inputs.
-The number of digital inputs.
-The reference of voltage type:
-Internal  and
and .
.
-External or  and
and 
Knowing the gain G we can express the temperature according to N noting that VIN = VS of the amplifier. So we have expression15:
 (15)
(15)
Which
 (16)
(16)
Replacing G by its value we find
 (17)
(17)
3.2. Programmable Sequencer of the CNC Resistance
With a fairly complete calculator, its timers, its reversible digital ports, and its digital to analog converters, our choice was focused on the 16F877 Pic.
Two output ports to each 8-bit of the microprocessor are cabled of the base resistances of the transistors.
An input PORT to 8-bit.
An input PORT at 6-bits for the analog conversion.
A PORT 8-bit output is wired to the decoders for 7 segment display.
3.3. Algorithm for Controlling the Microcontroller PIC 16F877A
This part is developed a basic algorithm for the study is the static regime is transient dynamic conditions. The choice of plan to study is through a manual switch K. The device is switched on by a push button S. The shutdown of the device is via a pushbutton R that is wired to the microprocessor initialization input. Thus, the system shutdown is not supported by the program resulting from the algorithm. The delay time between two consecutive states is via a button V. The base resistance RB is used to fix the current for controlling the switching of the transistors. We schematize our control program in Figure 6.

Figure 6. Programmable ordering of processus experimental automatic of solar panel.
Our program is shown in Figure 7.
4. Experimental Realization of Device
This work was performed in the laboratory of the Semiconductor and Solar Energy (LASES) of the Faculty of Science and Technology in Dakar. Here is our diagram of the automatic experimental processus for the solar panel which is shown in Figure 8.

Figure 7. Algorithmic representation of ordering of resistance to digital control.
Our PCB (printed circuit board) is shown in Figure 9.
5. Presenting Results
The results are obtained with an analog oscilloscope. The microprocessor PIC 16F877A issued for the controlling part of the automatic experimental. Throughout the manipulation, we calibrated our oscilloscope to 1 V/div for voltage and 0.2 V/div for current and used a temperature sensor to measure the ambient temperature. The following are results taken for different values of the ambient temperature. Figures 10-17 represent the characteristic I-V at different temperature:
The I-V characteristic in the static mode under illumination polychromatic at 35˚C under an ambient temperature of 33.1˚C.
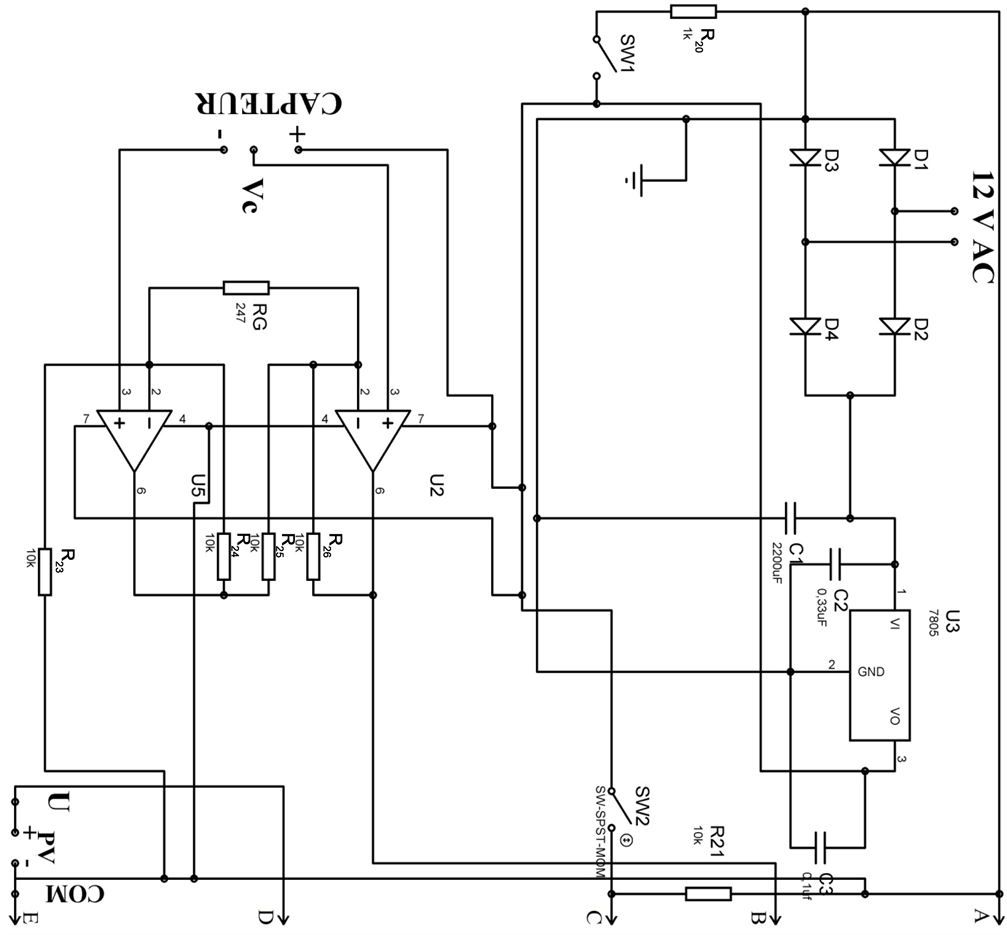

Figure 8. Diagram of the automatic experimental processes for the solar panel.

Figure 9. PCB (printed circuit board) artwork of the experimental device.
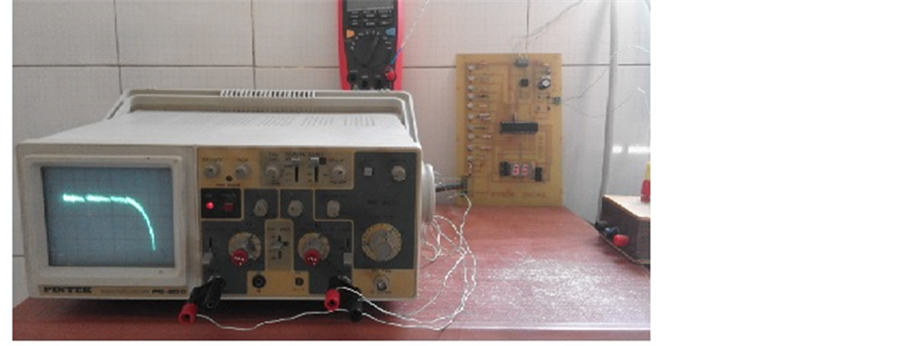
Figure 10. Curves I-V characteristic in the static mode under illumination polychromatic at 35˚C under an ambient temperature of 33.1˚C.

Figure 11. Curves I-V characteristic in the static mode under illumination polychromatic at 36˚C under an ambient temperature of 33.3˚C.

Figure 12. Curves I-V characteristic in the static mode under illumination polychromatic at 37˚C under an ambient temperature of 32.3˚C.

Figure 13. Curves I-V characteristic in the static mode under illumination polychromatic at 38˚C under an ambient temperature of 33.1˚C.
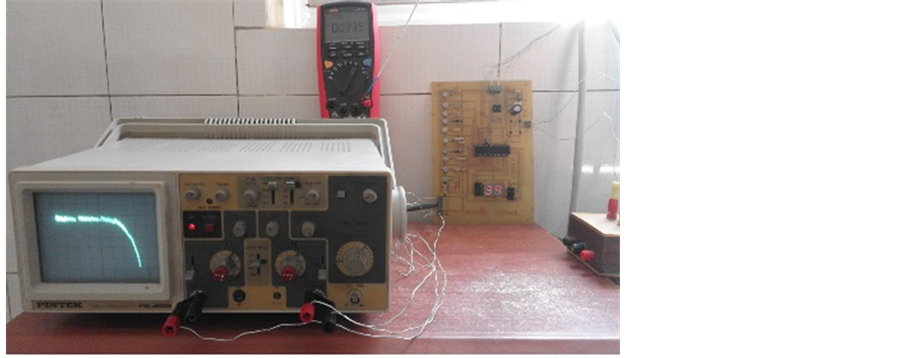
Figure 14. Curves I-V characteristic in the static mode under illumination polychromatic at 39˚C under an ambient temperature of 33.5˚C.

Figure 15. Curves I-V characteristic in the static mode under illumination polychromatic at 40˚C under an ambient temperature of 33.1˚C.

Figure 16. Curves I-V characteristic in the static mode under illumination polychromatic at 42˚C under an ambient temperature of 34.8˚C.
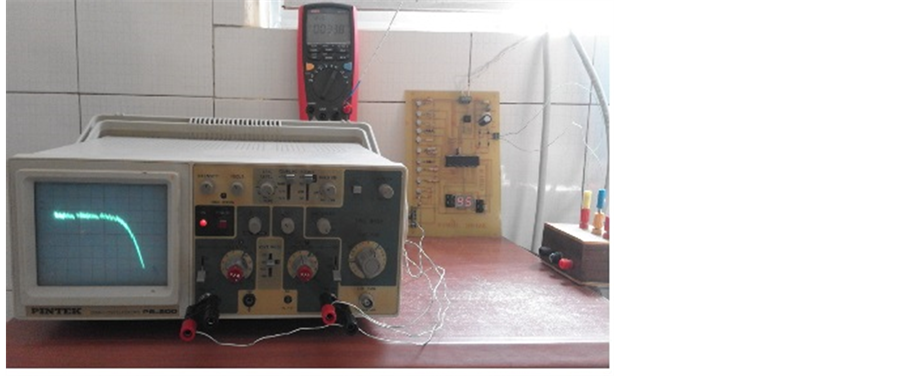
Figure 17. Curves I-V characteristic in the static mode under illumination polychromatic at 45˚C under an ambient temperature of 33.8˚C.
The I-V characteristic in the static mode under illumination polychromatic at 36˚C under an ambient temperature of 33.3˚C.
The I-V characteristic in the static mode under illumination polychromatic at 37˚C under an ambient temperature of 32.3˚C.
The I-V characteristic in the static mode under illumination polychromatic at 38˚C under an ambient temperature of 33.1˚C.
The I-V characteristic in the static mode under illumination polychromatic at 39˚C under an ambient temperature of 33.5˚C.
The I-V characteristic in the static mode under illumination polychromatic at 40˚C under an ambient temperature of 33.1˚C.
The I-V characteristic in the static mode under illumination polychromatic at 42˚C under an ambient temperature of 34.8˚C.
The I-V characteristic in the static mode under illumination polychromatic at 45˚C under an ambient temperature of 33.8˚C.
Here is an example below to calculate current and voltage. Throughout our handling we took 1 V/div for voltage and 0.1 V/div for current see following Figure 18.
6. Conclusions
This work was performed in the laboratory of the Semiconductor and Solar Energy (LASES) of the Faculty of Sciences and Techniques of Dakar.
It allowed us to design and implement an automatic experimental device for the acquisition of the characteristic I-V and temperature for solar panel silicon.
The concept of resistance equivalent to several cable resistors in parallel to obtain a digitally controlled variable resistor has been highlighted.
The electronic binary signals have helped us through static switches considered here as transistors, for changing the wiring resistance of the parallel combination.
For this we used a microcontroller that executed a C language program.
The results allowed us to conclude that the change in temperature affects the characteristic I-V. The increase in temperature leads to an increase of the current Icc short
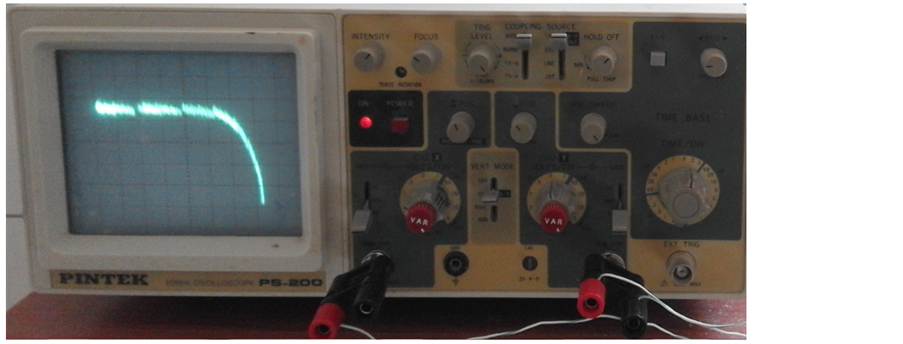
Figure 18. Curves I-V of the solar panel for polychromatic illumination.
circuit and a decrease in the open circuit voltage Voc. Thus it means that the temperature rise causes a slight increase in the creation of electron-hole pairs. Finally the work has allowed us to become familiar with some components such as the microprocessor.
7. Annex
In this section, we present our execution program of our simulation.
The program:
void main() {
unsigned short int T;
unsignedint N;
unsignedint Compteur;
TRISD=0;
TRISB=0;
TRISC.RC0=0;
TRISC.RC1=0;
TRISC.RC2=1;
TRISC.RC3=1;
TRISA=1;
ADCON1=0;
ADCON1.F7=1;
ADCON0.F6=0;
ADCON0.F7=1;
ADCON0.F0=1;
while (1)
{
while (PORTC.RC2==0);
if (PORTC.RC3==0)
{ PORTD=0; PORTC=0x01;
Delay(t3);
PORTC=0x02;
Delay(t3); }
else
{
ADCON0.F3=0;
ADCON0.F4=0;
ADCON0.F5=0;
Delay_us(20);
ADCON0.F2=1;
while (ADCON0.F2==1);
N=ADRESL+512*ADRESH.B1+256*ADRESH.B0;
T=0.084268716081*N;
if (T<10) PORTB=T;
else if (T>=10&&T<20) {PORTB=T-10; PORTB.RB4=1;}
else if (T>=20&&T<30) {PORTB=T-20; PORTB.RB5=1;}
else if (T>=30&&T<40) {PORTB=T-30; PORTB.RB4=1; PORTB.RB5=1;}
else if (T>=40&&T<50) {PORTB=T-40; PORTB.RB6=1;}
else if (T>=50&&T<60) {PORTB=T-50; PORTB.RB4=1; PORTB.RB6=1;}
else if (T>=60&&T<70) {PORTB=T-60; PORTB.RB5=1; PORTB.RB6=1;}
else if (T>=70&&T<80) {PORTB=T-70; PORTB.RB5=1; PORTB.RB6=1; PORTB.RB4=1;}
else if (T>=80&&T<90) {PORTB=T-80; PORTB.RB7=1;}
else {PORTB=T-90; PORTB.RB4=1; PORTB.RB7=1;}
PORTD=0;
PORTC=0;
Compteur=0;
while (Compteur<1024)
{
if (PORTC.RC4==1)
Delay(t1);
else Delay(t2);
PORTD++;
if (PORTD==0) PORTC++;
Compteur++;
} } } }
Acknowledgements
The authors gratefully acknowledge the managements of laboratory of the Semiconductor and Solar Energy (LASES) of the Faculty of Sciences and Techniques of Dakar, Polytechnic School of Thiès, Sénégal Université Alioune DIOP de Bambey, Sénégal and the University Institute of Technology, University of Thiès, Sénégal.
Cite this paper
Dione, B., Sow, O., Wade, M., Ibrahima, L.Y., Mbodji, S. and Sissoko, G. (2016) Experimental Processus for Acquisition Automatic Features of I-V Properties and Temperature of the Solar Panel by Changing the Operating Point. Circuits and Systems, 7, 3984-4000. http://dx.doi.org/10.4236/cs.2016.711330
References
- 1. Sdeepika, P. and Gayad Khan, G.Md. (2014) Analysis of Mathematical Model of PV Cell Module in Matlab/Simulink Environment. International Journal of Advanced Research in Electrical, Electronics and Instrumentation Engineering, 3, 7823-7829.
- 2. Hamrouni, N., Jraidi, M. and Chérif, A. (2008) Solar Radiation and Ambient Temperature Effects on the Performances of a PV Pumping System. Revue des Energies Renouvelables, 11, 95-106.
- 3. Barro, F.I., Seidou Maiga, A., Wereme, A. and Sissoko, G. (2010) Determination of Recombination Parameters in the Base of a Bifacial Silicon Solar Cell under Constant Multispectral Light. Physical and Chemical News, 56, 76-84.
- 4. Mbodji, S., Ly, I., Diallo, H.L., Dione, M.M., Diasse, O. and Sissoko, G. (2012) Modeling Study of N+/P Solar Cell Resistances from Single I-V Characteristic Curve Considering the Junction Recombination Velocity (Sf). Research Journal of Applied Sciences, Engineering and Technology, 4, 1-7.
- 5. Surya Kumari, J. and SaiBabu, Ch. (2012) Mathematical Modeling and Simulation of Photovoltaic Cell Using Matlab-Simulink Environment. International Journal of Electrical and Computer Engineering (IJECE), 2, 26-34.
- 6. Djerroud, S. and BoudgheneStambouli, A. (2010) Mise au point d’un dispositif automatique de caractérisation du module solaire à base d’un microcontr?leur PIC16F877 Application au module solaire hybride en a-Si:H. Revue des Energies Renouvelables, 13, 613-623.
- 7. Bendib, T., Barkat, B., Djeffal, F., Hamia, N. and Nidhal, A. (2008) Commande automatique d’un système de poursuite solaire à deux axes à base d’un microcontroleur PIC16F84A. Revue des Energies Renouvelables, 11, 523-532.
- 8. Ousmane Sow, M., Diarisso, D., Saliou Diallo, M. and Mbodji, A. (2013) Experimental Device for Acquisition of Properties I-V and V (T) of the Solar By Automatic Change Operating Point. International Journal of Innovative Technology and Exploring Engineering (IJITEE), 2, 330-334.
- 9. Diarisso, D., Diallo, M.S., Diao, A., Sow, O., Gaye, I., Barro, F.I. and Sissoko, G. (2013) Development of Battery Charge/Discharge Regulator for Photovoltaic Systems. International Journal of Innovative Technology and Exploring Engineering (IJITEE), 2, 231-234.
- 10. Microchip Datasheet (1999) PIC 16F87x: 28/40 pin CMOS Flash Microcontrollers. MicrochipTechnology Inc., DS30292B.
- 11. Bigonoff (2003) La Programmation des PIC par Bigonoff. Seconde Partie (PIC16F876- 16F877), 7ème Révision.
- 12. Mayeux, P. (2002) Apprendre la Programmation des PIC par l’Expérimentation et la Simulation. plus un CD-ROOM, ETSF 2ème édition.
- 13. Fabert, J.-Y. (2005) Sciences industrielles: Automatismes et automatique. Edition Ellipses, Paris.
- 14. Neffati, T. (2003) Electricité générale: Analyse et synthèse des circuits. Edition DUNOD, Paris.
- 15. Merat, R., Moreau, R., Allay, L., Dubos, J.-P., Lafargue, J. and Legoff, R. (2001) Electronique numérique. Edition Nathan/VUEF, Paris.