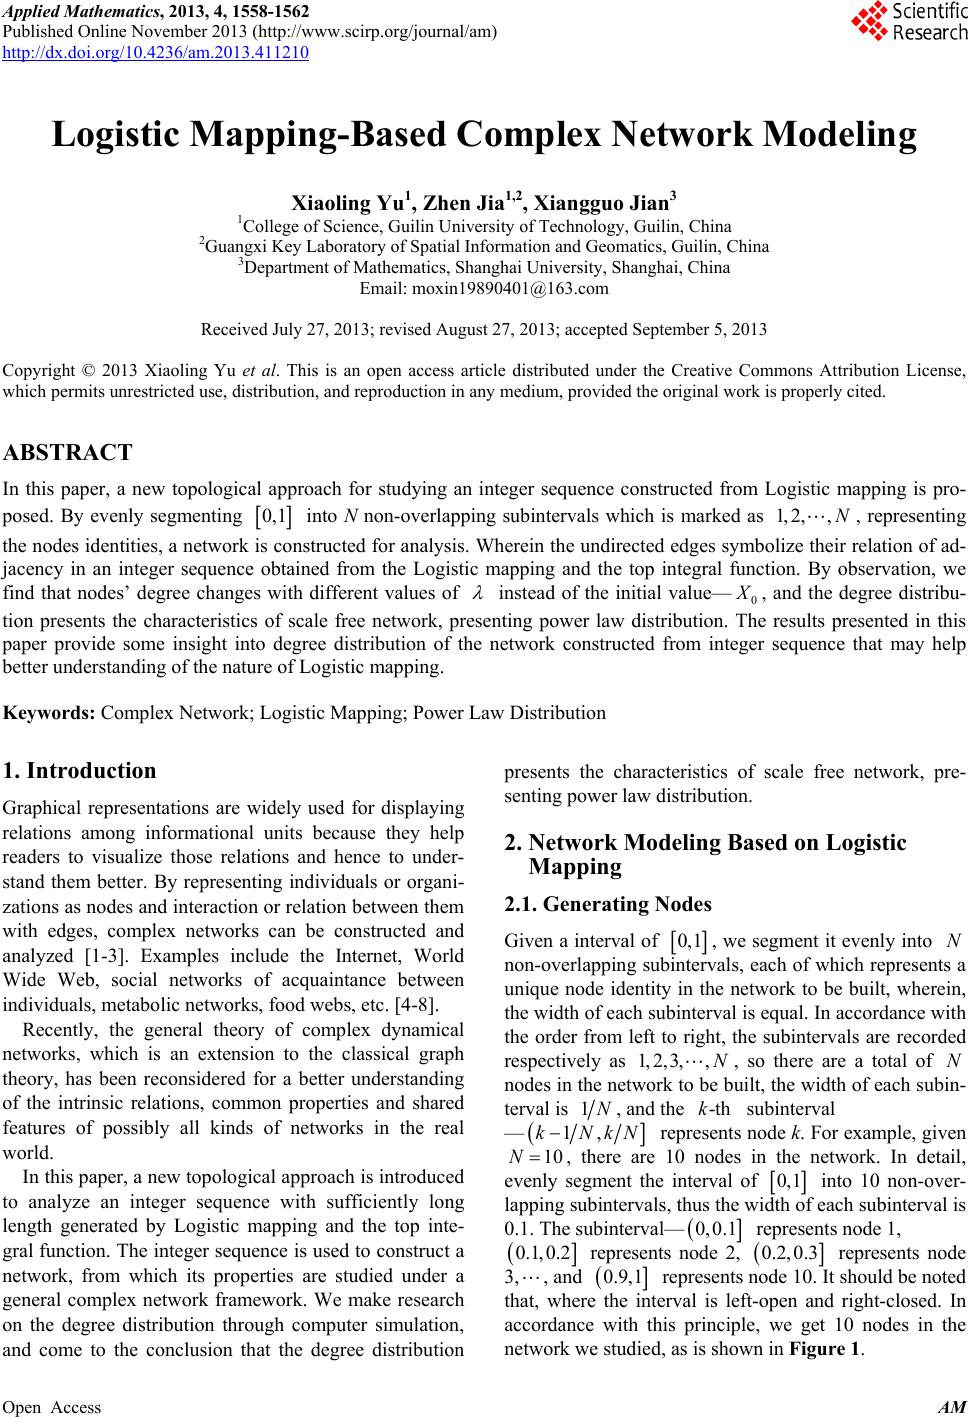
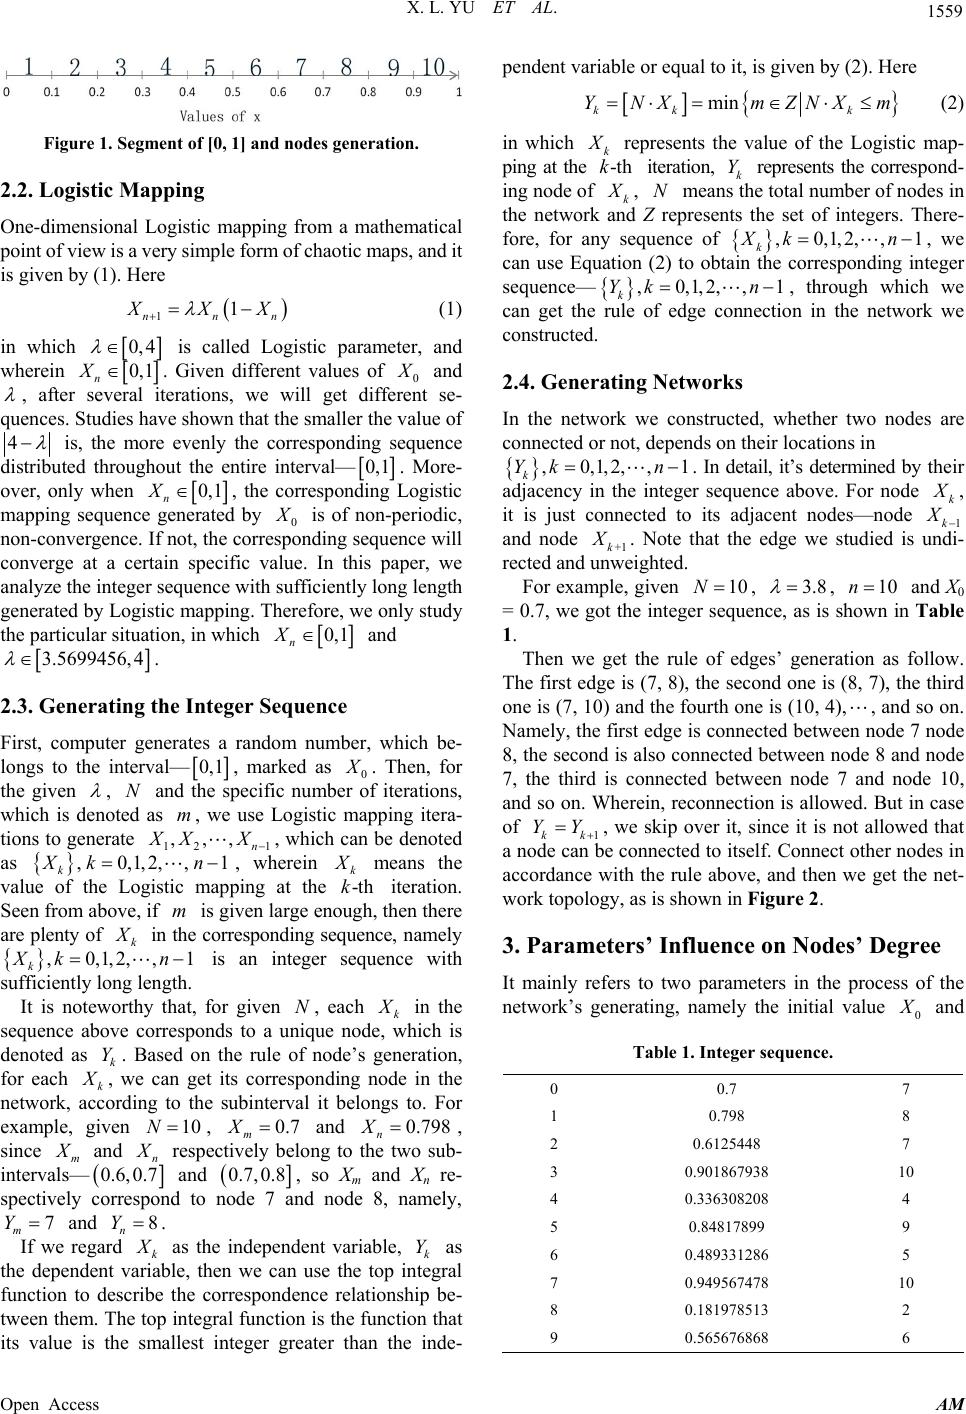
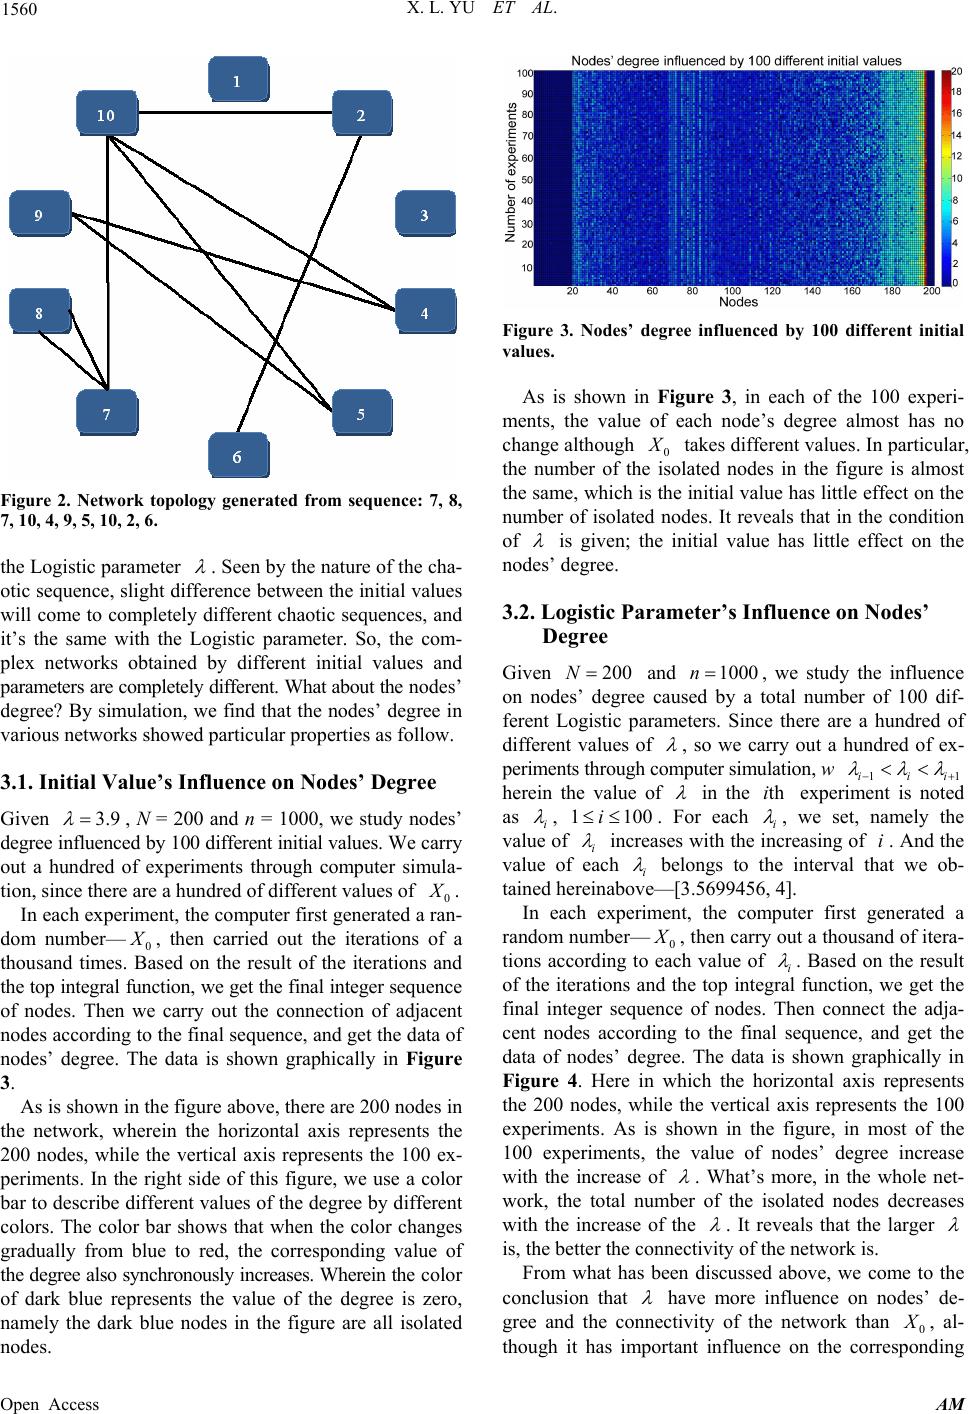
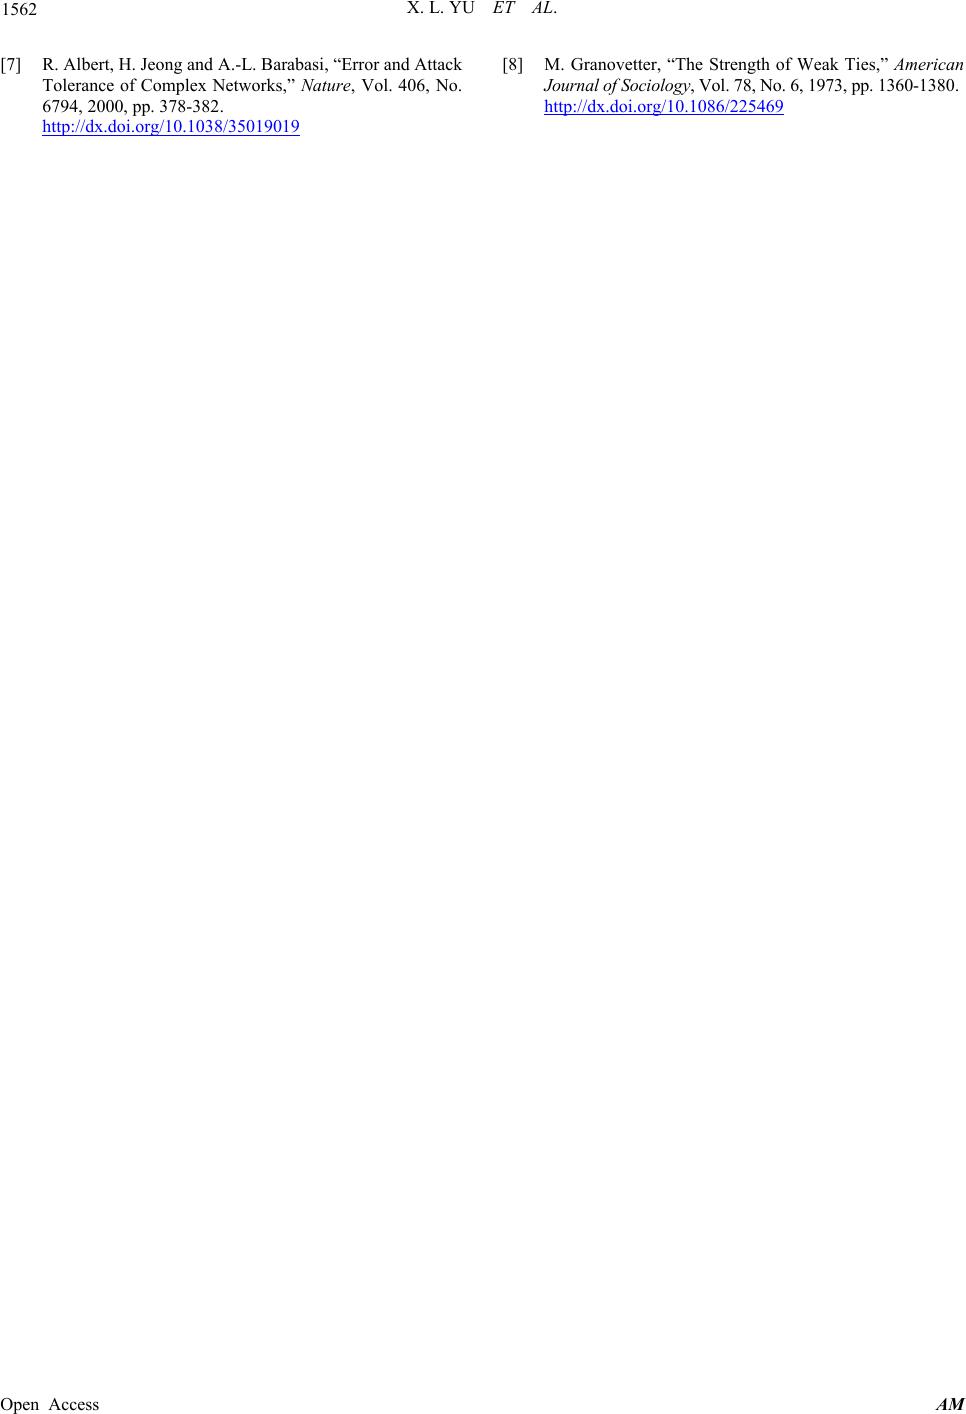
 Applied Mathematics, 2013, 4, 1558-1562 Published Online November 2013 (http://www.scirp.org/journal/am) http://dx.doi.org/10.4236/am.2013.411210 Open Access AM Logistic Mapping-Based Complex Network Modeling Xiaoling Yu1, Zhen Jia1,2, Xiangguo Jian3 1College of Science, Guilin University of Technology, Guilin, China 2Guangxi Key Laboratory of Spatial Information and Geomatics, Guilin, China 3Department of Mathematics, Shanghai University, Shanghai, China Email: moxin19890401@163.com Received July 27, 2013; revised August 27, 2013; accepted September 5, 2013 Copyright © 2013 Xiaoling Yu et al. This is an open access article distributed under the Creative Commons Attribution License, which permits unrestricted use, distribution, and reproduction in any medium, provided the original work is properly cited. ABSTRACT In this paper, a new topological approach for studying an integer sequence constructed from Logistic mapping is pro- posed. By evenly segmenting 0,1 into N non-overlapping subintervals which is marked as , representing the nodes iden tities, a network is constructed for an alysis. Wherein the undirected edges symbolize their relation of ad- jacency in an integer sequence obtained from the Logistic mapping and the top integral function. By observation, we find that nodes’ degree changes with different values of 1, 2,,N instead of the initial value—0 , and the degree distribu- tion presents the characteristics of scale free network, presenting power law distribution. The results presented in this paper provide some insight into degree distribution of the network constructed from integer sequence that may help better understanding of the nature of Logistic mapping. Keywords: Complex Network; Logistic Mapping; Power Law Distribution 1. Introduction Graphical representations are widely used for displaying relations among informational units because they help readers to visualize those relations and hence to under- stand them better. By representing individuals or organi- zations as nodes and interaction or relation between them with edges, complex networks can be constructed and analyzed [1-3]. Examples include the Internet, World Wide Web, social networks of acquaintance between individuals, metabolic networks, food webs, etc. [4-8]. Recently, the general theory of complex dynamical networks, which is an extension to the classical graph theory, has been reconsidered for a better understanding of the intrinsic relations, common properties and shared features of possibly all kinds of networks in the real world. In this paper, a new topological approach is introduced to analyze an integer sequence with sufficiently long length generated by Logistic mapping and the top inte- gral function. The integer sequence is used to construct a network, from which its properties are studied under a general complex network framework. We make research on the degree distribution through computer simulation, and come to the conclusion that the degree distribution presents the characteristics of scale free network, pre- senting po wer law distributi o n. 2. Network Modeling Based on Logistic Mapping 2.1. Generating Nodes Given a interval of 0,1 , 3,, , we segment it evenly into non-overlapping subintervals, each of which represents a unique node identity in the network to be built, wherein, the width of each subinterval is equal. In accordance with the order from left to right, the subintervals are recorded respectively as , so there are a total of nodes in the network to be built, th e width of each subin- terval is N N 1, 2N 1N, and the subinterval —-tkh 1,kNkN represents node k. For example, given 10N , there are 10 nodes in the network. In detail, evenly segment the interval of 0,1 into 10 non-over- lapping subintervals, thus the width of each subinterval is 0.1. The subinterval— 0,0.1 re p res ents no de 1, 0.1,0.2 represents node 2, 0.2,0.3 represents node 3,, and 0.9,1 represents node 10. It should be noted that, where the interval is left-open and right-closed. In accordance with this principle, we get 10 nodes in the network we studied, as is shown in Figure 1.  X. L. YU ET AL. 1559 Figure 1. Segment of [0, 1] and nodes generation. 2.2. Logistic Mapping One-dimensional Logistic mapping from a mathematical point of view is a very simple form of cha otic maps, a nd it is given by (1). Here 11 nn n XX (1) in which 0,4 is called Logistic parameter, and wherein 0,1 n X. Given different values of 0 and , after several iterations, we will get different se- quences. Studies have shown that the smaller the value of 4 is, the more evenly the corresponding sequence distributed throughout the entire interval— 0,1 . More- over, only when 0,1 n X, the corresponding Logistic mapping sequence generated by 0 is of non-periodic, non-converge nce. If not, th e corresp onding seq uence will converge at a certain specific value. In this paper, we analyze the integer sequence with sufficiently long length generated by Logistic mapping. Therefore, we only study the particular situation, in which 0,1 n X and 3.5 699456,4 . 2.3. Generating the Integer Sequence First, computer generates a random number, which be- longs to the interval— 0,1 , marked as 0 . Then, for the given , and the specific number of iterations, which is denoted as , we use Logistic mapping itera- tions to generate 1 Nm 12 ,,, n X ,X 1,1 , which can be denoted as k ,0,2, kn, wherein k means the value of the Logistic mapping at the iteration. Seen from above, if is given large enough, then there are plenty of -thk m k in the corresponding sequence, namely k ,,01,2,,1 kn is an integer sequence with sufficiently long length. It is noteworthy that, for given , each k N in the sequence above corresponds to a unique node, which is denoted as k. Based on the rule of node’s generation, for each k Y , we can get its corresponding node in the network, according to the subinterval it belongs to. For example, given , m and 10N0.X70.798Xn , since m and n respectively belong to the two sub- intervals— 0.6,0.7 and 0.7,0.8 , so Xm and Xn re- spectively correspond to node 7 and node 8, namely, and Y. 7 m Y8 n If we regard k as the independent variable, k as the dependent variable, then we can use the top integral function to describe the correspondence relationship be- tween them. The top integral function is the function that its value is the smallest integer greater than the inde- pendent variable or equal to it, is given by (2). Here Y min kk k YNX mZNXm (2) in which k represents the value of the Logistic map- ping at the iteration, k Y represents the correspond- ing node of k -tkh , means the total number of nodes in the network and Z represents the set of integers. There- fore, for any sequence of N ,0,1,2,, k1 kn, we can use Equation (2) to obtain the corresponding integer sequence— Yk,0,1,2,,1n k , through which we can get the rule of edge connection in the network we constructed. 2.4. Generating Networks In the network we constructed, whether two nodes are connected or not, depends on their locations in ,0,1,2,, k Yk n1 . In detail, it’s determined by their adjacency in the integer sequence above. For node k , it is just connected to its adjacent nodes—node 1k and node +1k . Note that the edge we studied is undi- rected and unweighted. For example, given 10N , 3.8 , and X0 = 0.7, we got the integer sequence, as is shown in Table 1. 10n Then we get the rule of edges’ generation as follow. The first edge is (7, 8), the second one is (8, 7), the third one is (7, 10) and th e fourth one is (10, 4),, and so on. Namely, the first edge is connected between node 7 node 8, the second is also connected between node 8 and node 7, the third is connected between node 7 and node 10, and so on. Wherein, reconnection is allowed. But in case of 1kk YY , we skip over it, since it is not allowed that a node can be connected to itself. Connect other nodes in accordance with the rule above, and then we get the net- work topology, as is shown in Figure 2. 3. Parameters’ Influence on Nodes’ Degree It mainly refers to two parameters in the process of the network’s generating, namely the initial value 0 and Table 1. Integer sequence . 0 0.7 7 1 0.798 8 2 0.6125448 7 3 0.901867938 10 4 0.336308208 4 5 0.84817899 9 6 0.489331286 5 7 0.949567478 10 8 0.181978513 2 9 0.565676868 6 Open Access AM  X. L. YU ET AL. 1560 Figure 2. Network topology generated from sequence: 7, 8, 7, 10, 4, 9, 5, 10, 2, 6. the Logistic parameter . Seen by the nature of the cha- otic sequence, slight difference between the initial values will come to completely different chaotic sequences, and it’s the same with the Logistic parameter. So, the com- plex networks obtained by different initial values and parameters are completely different. What about the n o de s ’ degree? By simulation, we find that the nodes’ degree in various networks showed particular properties as follow. 3.1. Initial Value’s Influence on Nodes’ Degree Given 3.9 , N = 200 and n = 1000, we study nodes’ degree influenced by 100 different initial values. We car r y out a hundred of experiments through computer simula- tion, since there are a hundred of different values of 0 . In each experiment, the computer first generated a ran- dom number—0 , then carried out the iterations of a thousand times. Based on the result of the iterations and the top integral function, we get the final inte ger seque nce of nodes. Then we carry out the connection of adjacent nodes according to the final sequence, and get the data of nodes’ degree. The data is shown graphically in Figure 3. As is shown in the figu re ab ove, th ere a re 200 no des in the network, wherein the horizontal axis represents the 200 nodes, while the vertical axis represents the 100 ex- periments. In the right side of this figure, we use a color bar to describe different values of the degree by different colors. The color bar shows that when the color changes gradually from blue to red, the corresponding value of the degree also synchronously increases. Wherein the co lo r of dark blue represents the value of the degree is zero, namely the dark blue nodes in the figure are all isolated nodes. Figure 3. Nodes’ degree influenced by 100 different initial values. As is shown in Figure 3, in each of the 100 experi- ments, the value of each node’s degree almost has no change although 0 takes different values. In particular, the number of the isolated nodes in the figure is almost the same, which is the initial value has little effect on the number of isolated nodes. It reveals that in the condition of is given; the initial value has little effect on the nodes’ degree. 3.2. Logistic Parameter’s Influence on Nodes’ Degree Given 200N and 1000n , we study the influence on nodes’ degree caused by a total number of 100 dif- ferent Logistic parameters. Since there are a hundred of different values of , so we carry out a hundred of ex- periments through computer simulation, w 11iii herein the value of in the experiment is noted as i thi , 1i100 . For each i , we set, namely the value of i increases with the increasing of . And the value of each i i belongs to the interval that we ob- tained hereinabove—[3.5699456, 4]. In each experiment, the computer first generated a random number—0 , then carry out a thousand of itera- tions according to each value of i . Based on the result of the iterations and the top integral function, we get the final integer sequence of nodes. Then connect the adja- cent nodes according to the final sequence, and get the data of nodes’ degree. The data is shown graphically in Figure 4. Here in which the horizontal axis represents the 200 nodes, while the vertical axis represents the 100 experiments. As is shown in the figure, in most of the 100 experiments, the value of nodes’ degree increase with the increase of . What’s more, in the whole net- work, the total number of the isolated nodes decreases with the increase of the . It reveals that the larger is, the better the connectivity of the network is. From what has been discussed above, we come to the conclusion that have more influence on nodes’ de- gree and the connectivity of the network than 0 , al- though it has important influence on the corresponding Open Access AM  X. L. YU ET AL. 1561 Figure 4. Nodes’ degree influenced by 100 different Logistic parameters. integer sequence. In detail, the larger is, the less the isolated nodes’ number is, and the better the connectivity of the network is, while the initial value has little effect on the nodes’ d egr ee. 4. Degree Distribution On the basis of the conclusion above, we conduct further research on the degree distribution by constructing six typical networks. In the network we constructed, we need to choose applicable parameters to decrease the number of isolated nodes, since the less the number of isolated nodes is, the better the connectivity is, and it is of little significance to the study of degree distri bution. Given N = 100,00, and the value of is respectively as follow, 10,000, 50,000, 100,000, 500,000, 1,000,000, and 5,000,000. Therefore, there are ten thousands of nodes in the network, the total number of iterations is large enough, and the result of iteration is the corresponding integer sequence with sufficiently long length. Then we get the figure of degree distribution in each of the net- works above through computer simulation, and the result is shown in Figure 5. n As is shown in Figure 5, in dual-logarithm coordinates system, the degree distributions of all the networks above approximate a straight line, presenting the characteristics of power law distribution. It is similar to the degree dis- tribution of scale free network. Therefo re, in terms o f the degree distribution, the network we constructed from in- teger sequence presents the characteristics of scale free network. The results presented above provide some insight into distributions of the integer sequence that may help better understanding of the nature of the Logistic mapping. 5. Conclusion In this paper, we have studied the degree distribution of a network which is constructed from Logistic mapping. It is found that has more influence on nodes’ degree and the connectivity of the network than 0 . Further Figure 5. Probability versus degree. more, the degree distribution of the network shows pow er law distribution, presenting the characteristics of scale free network. The results presented in this paper also provide some insight into how networks are constructed from integer sequences, as well as how integer sequence is generated from the Logistic mapping. REFERENCES [1] R. Albert and A.-L. Barabasi, “Statistical Mechanics of Complex Networks,” Reviews of Modern Physics, Vol. 74, No. 1, 2002, pp. 47-97. http://dx.doi.org/10.1103/RevModPhys.74.47 [2] S. N. Dorogovtsev and J. F. F. Mendes, “Evolution of Networks,” Advances in Physics, Vol. 51, No. 4, 2002, pp. 1079-1145. http://dx.doi.org/10.1080/00018730110112519 [3] M. E. J. Newman, “The Structure and Function of Com- plex Networks,” SIAM Review, Vol. 45, No. 2, 2003, pp. 167-224. http://dx.doi.org/10.1137/S003614450342480 [4] R. Pastor-Satorras, A. Vazquez and A. Vespignani, “Dy- namical and Correlation Properties of the Internet,” Physi- cal Review Letters, Vol. 87, No. 25, 2001, pp. 1-4. http://dx.doi.org/10.1103/PhysRevLett.87.258701 [5] G. Bianconi and A. L. Barabasi, “Competition and Mul- tiscaling in Evolving Networks,” Europhysics Letters, V ol. 54, No. 4, 2001, pp. 436-442. http://dx.doi.org/10.1209/epl/i2001-00260-6 [6] F. Liljeros, C. R. Edling, L. A. N. Amaral, H. E. Stanley and Y. Aberg, “The Web of Human Sexual Contacts,” Nature, Vol. 411, No. 6840, 2001, pp. 907-908. http://dx.doi.org/10.1038/35082140 Open Access AM  X. L. YU ET AL. Open Access AM 1562 [7] R. Albert, H. Jeong and A.-L. Barabasi, “Error and Attack Tolerance of Complex Networks,” Nature, Vol. 406, No. 6794, 2000, pp. 378-382. http://dx.doi.org/10.1038/35019019 [8] M. Granovetter, “The Strength of Weak Ties,” American Journal of Sociology, Vol. 78, No. 6, 1973, pp. 1360-1380. http://dx.doi.org/10.1086/225469
|