 Applied Mathematics, 2013, 4, 1547-1557 Published Online November 2013 (http://www.scirp.org/journal/am) http://dx.doi.org/10.4236/am.2013.411209 Open Access AM Maximizing Sampling Efficiency Harmon S. Jordan Health Care Quality Program, RTI International, Waltham, Massachusetts, USA Email: hjordan@rti.org, hsjordan@rcn.com Received July 23, 2013; revised August 23, 2013; accepted August 30, 2013 Copyright © 2013 Harmon S. Jordan. This is an open access article distributed under the Creative Commons Attribution License, which permits unrestricted use, distribution, and reproduction in any medium, provided the original work is properly cited. ABSTRACT Background and Goals: Although health care quality improvement has traditionally involved extensive work with paper records, the adoption of health information technology has increased the use of electronic record and administra- tive systems. Despite these advances, quality improvement practitioners now and for the foreseeable future need guid- ance in defining populations of individuals for study and in selecting and analyzing sample data from such populations. Statistical data analysis in health care research often involves using samples to make inferences about populations. The investigator needs to consider the goals of the study, whether sampling is to be used, and the type of population being studied. While there are numerous sampling strategies designed to conserve resources and yield accurate results, one of these techniques—use of the finite population correction (FPC)—has received relatively little attention in health care sampling contexts. It is important for health care quality practitioners to be aware of sampling options that may increase accuracy and conserve resources. This article describes common sampling situations in which the issue of the finite population correction decision often arises. Methods: This article describes 3 relevant sampling situations that influ- ence the design and analysis phases of a study and offers guidance for choosing the most effective and efficient design. Situation 1: The study or activity involves taking a sample from a large finite target population for which enumerative inferences are needed. Situation 2: The population is finite and the study is enumerative. A complete enumerative count of “defects” in the process is needed so that remediation can occur. Here, statistical inference is unnecessary. Situation 3: The target population is viewed as infinite; such populations are “conceptual populations” [1] or “processes”. Results: The article shows how savings in resources can be achieved by choosing the correct analytic framework at the concep- tualization phase of study design. Choosing the right sampling approach can produce accurate results at lower costs. Several examples are presented and the implications for health services research are discussed. Conclusion: By clearly specifying the objectives of a study and considering explicitly whether the data are a sample or a population, the practi- tioner may be able to design a more efficient study and thereby conserve resources. This article provides a conceptual framework in the form of three situations, several examples, and an algorithm (Figure 1) to help the intervention plan- ner determine how to classify the study and when to apply the FPC. Keywords: Sampling; Finite Population Correction; FPC; Finite Population; Infinite Population 1. Introduction Although health care quality improvement has tradition- ally involved extensive work with paper records, the adoption of health information technology has increased the use of electronic record and administrative systems. Despite these advances, quality improvement (QI) practi- tioners now and for the foreseeable future need guidance in research methodology to improve the usefulness and generalizability of QI studies. Berenholtz et al. for exam- ple, have proposed that QI studies should employ meth- odologies sufficiently rigorous to address potential study bias and facilitate valid inferences from QI projects [2]. Those authors proposed a checklist involving key areas of study design, including random error, bias (selection, measurement and analytic), and confounding. In this ar- ticle we address two components of the list: sample (a sample is a collection of units from a population [3]) size calculation and appropriateness of the statistical analysis. The practice of QI is, of necessity, often multidiscipli- nary, with practicing clinicians and provider-based in- tervention planners, health services researchers, and bio- statisticians. These individuals interact to design the study, manage the data collection, analyze the data, and help stakeholders conceptualize the research questions and study results before and after the study is implemented.  H. S. JORDAN 1548 This article may be of interest to all such participants, because as we will show, more than one perspective may be necessary to design and analyze a study correctly. Defining populations of individuals for study and in selecting and analyzing sample data from such popula- tions is a fundamental component of any QI study. Statis- tical data analysis in health care research often involves using samples to make inferences about populations, and the literature is filled with theory and methods of infer- ence for such situations. Statistical sampling involves making statements about the characteristics of a popula- tion on the basis of reviewing a representative subset of that population. There are statistical rules for defining the population, constructing a sampling frame, selecting a random sample, and extrapolating from the sample to the population. While there are numerous sampling strategies designed to conserve resources and yield accurate results, one of these techniques, the finite population correction (FPC) [4] has received relatively little attention in health care sampling contexts. It is important for health care quality practitioners to be aware of sampling options that may increase accuracy and conserve resources. This article describes common sampling situations in which the issue of the finite population decision often arises. 1.1. Objectives We focus here on potentially ambiguous and problematic types of sampling situations, which occur often in health care sampling contexts. These situations may occur and be addressed at a study’s design phase, and, because the design should determine the analysis, our discussion has implications for the analysis, too. Our objective is to provide illustrations of these situations and offer guid- ance for choosing more efficient and appropriate solu- tions to sampling design and analysis challenges. A sample has value when it provides actionable in- formation about the population of interest. The entire population consists of measurements on all units of in- terest to the study, but complete enumeration of the en- tire population of units is unlikely to be accessible for cost or logistical reasons. This of course is not true when a medical practice uses a fully electronic record. We se- lect a subset or sample of the population so that we may obtain sufficient information to address the problem we are trying to solve [5]. A statistical power analysis or other method is used to calculate, under various assump- tions, the needed sample size. To be efficient and effective, the study sample should be as small as possible to conserve resources and to ease implementation, but large enough to enable comparison of the effects of interventions or the estimation of quanti- ties of interest with adequate precision. A sample design may be too large—that is, inefficient and more costly than necessary. Samples that are too small are ineffective; they do not provide sufficiently precise estimates. During the analysis phase, although the sample size may be cor- rect, the analytic framework for interpreting the results of the analysis may be flawed and lead to incorrect esti- mates. 1.2. Sample and Statistical Power An example of a study objective, for sample size estima- tion purposes, is detecting the effect of a QI intervention before and after the implementation of an intervention. More specifically, the interest is in comparing pre-inter- vention baseline performance to post-intervention per- formance. Alternatively, interest may center on the im- pact of the intervention by comparing the effect on a group of patients that received a QI intervention (e.g., educational materials) vs. a group of patients that did not receive the intervention being studied. Sometimes, pub- lished information can be used to help estimate the size of the sample required, but such information is often not available, and we need to make educated guesses about the value of key study parameters (a parameter is “a nu- merical property of a population, such as its mean”) [3]. The most important aspect of the sample size estimation process is clear specification of the study objective. A sample size “power” calculation [6] requires some in- formation about several parameters. The statistical power approach is used when objectives are formulated as hy- pothesis tests. A different, but related approach for calculating sam- ples sizes is to frame the problem as one in which the objective of the study is to estimate key parameters. In this approach, which we adopt in this article, we assume that we will present study results in terms of confidence intervals (“A confidence interval for a parameter is a random interval constructed from data in such a way that the probability that the interval contains the true value of the parameter can be specified before the data are col- lected” [3]). Using this approach: We determine, based upon the study objectives, what measure we need to use. As an example, say our ob- jective is to calculate the percentage of HMO mem- bers who smoke to help decide whether a QI inter- vention is needed (note: following common usage, we use the terms “percentage”, “rate”, and “proportion” interchangeably. Technically, each of these quantities has different mathematical properties). We specify the level of confidence we need to have in our estimates. This level is usually set at 95% (the equivalent of a statistical significance test at the level of 5%). We estimate the variability of the statistical measures we plan to use to estimate the parameter of interest. Say that the statistic (a number that can be computed from Open Access AM  H. S. JORDAN 1549 data… used to estimate parameters, and to test hypothe- ses 1) is a percentage. We have a rough idea of its size (e.g., we expect that approximately 90% of those patients discharged from the hospital with a diagnosis of AMI received aspirin at discharge. The variance (the average of the squares of the deviations… [of a list of num- bers]… from their mean) 1 of measures expressed as per- centages is “built-in” because the variance of a percent- age is the percentage itself multiplied by its complement: [(1 − 0.90) × (0.90)] = 0.09 in this example. Percentages closer to the middle of the zero to 100% range (around 50%), have smaller variance than percentages closer to the extremes, that is, closer to zero or to 100%). Estimat- ing the variance of means (averages), in contrast to per- centages, is less straightforward, but literature searches can help find such estimates in similar studies, and some sample size software can help estimate the variability of means. We need to specify the desired degree of “preci- sion” of our sample estimate. We specify precision as the width of the desired confidence interval. Narrower sized confidence intervals, all other things being equal, provide more information, but at the price of a larger required sample size. A common way to express precision is to specify that the desired margin of error is plus or minus a specific number of percentage points (p.p.). We now have the information to estimate the percent- age of patients receiving aspirin at discharge from the hospital as mentioned above. If we have no knowledge of the size of the percentage we are trying to estimate, stan- dard practice is to assume that the percentage is around 50%. This leads to the maximum possible (and therefore most costly) sample size, but this conservative approach guards against choosing a sample too small to yield suf- ficiently precise results. Alternatively, if we have data available from existing studies, we might choose a more evidence-based percentage, such as approximately 90% [7]. We further assume that we desire the size of the inter- val that would contain the true percentage to be no larger than 10 (±5) percentage points. Furthermore, we want to be 95% sure of our estimate of the size of this interval. With these assumptions, we can look up the minimum sample size in a table, or enter the assumptions into a computer program to calculate the necessary number of members (or their charts) to sample. Note that we have not yet mentioned the size of the population (the sampling frame) from which the sample will be selected, which may have a major impact on the final sample size required. Note also that the availability of information on possible correlated factors of interest (i.e., covariates used in model building) or costs of data collection can yield more sophisticated sample size esti- mates, but this is a more advanced topic. Reliable statis- tical software is available to process the estimates of the parameters described above to produce a recommended minimum sample size. 2. Characterizing the Population A population may be subject to complete enumeration, given sufficient resources, but there may also be a degree of ambiguity about how to conceptualize a population of interest. A primary concern with respect to sample design and analysis is whether the population is finite or infinite. Ceteris paribus, inferences about an infinite population require a larger sample than a finite population. The dif- ference is often not large, but sometimes it is extremely large, and it can have large cost implications, so accurate conceptualization of the population as finite or infinite is important. This is because calculation of precision of sample estimates is related to how large a proportion of the total population is represented by the sample. In statistical terms, the variability of the parameter es- timate—that is, the size of its standard error—is reduced when working with a finite population. The finite popu- lation correction is a number between zero and one; it increases as the sample becomes a smaller proportion of the population: 1Nn N , where n is the size of the sample and N is the size of the population. For certain purposes, N may be used in the denominator, rather than N − 1 [4, p. 25]. The core statistical issue is how to cal- culate the standard error of the various study parameters, so that the sample size can be accurately estimated. For example, accurate determination of sample sizes for es- timation of rate of prescription of aspirin after myocar- dial infarction in hospitals requires calculation of the standard error. Ceteris paribus, the larger the sample size, the smaller the standard error. Below we describe when it is appropriate to adjust the standard error or sample size because of the study design. Sampling from an infinite population is the application for which many classical procedures were developed [8]. Sampling from a finite target population, however, could require a reduction in the size of the standard error [9] at the time of analysis, with implications for tests of statis- tical significance, confidence intervals, and study costs. Those who work with data—provider-based interven- tion planners, health services researchers, and biostatisti- cians—frequently encounter situations requiring both fi- nite and infinite approaches. Here we present a paradigm for conceptualizing the population of interest. Our conceptualization is grounded in W. Edward Dem- ing’s notion of particular study types, specifically “enu- merative” studies and “analytic” studies. Deming’s [1] distinction between enumerative and analytic studies and Hahn and Meeker’s [10, pp. 3-4] elaboration of that dis- tinction are particularly helpful. It should also be noted that the value of Deming’s concepts of analytical and Open Access AM  H. S. JORDAN 1550 enumerative studies have been noted by others in the context of health care quality improvement. For example, Provost (2011) [11] and Perla et al. (2013) [12] discuss the implications of these concepts for health care quality improvement and sampling design, but do not explicitly address the concept of the finite population correction. Hahn and Meeker quote Deming: an analytic study is one “in which action will be taken on the process or cause-system… the aim being to improve practice in the future… interest centers in future product, not in the ma- terials studied.” Analytic studies involve statistical in- ference, i.e., extrapolating and generalizing from a “sub- set” to the overall set from which the subset is a part. An analytic study, in this context, must entail inference. In contrast, an enumerative study is one in which “action will be taken on the material in the frame studied” [10]. An enumerative study provides information about an en- tire population, and does not involve extrapolation or generalization. A tenet of continuous quality improvement (CQI) the- ory is that quality is better improved not by seeking out individual performance outliers, but by seeking to incre- mentally improve the performance of all participants in the process [13]. This aspect of CQI implies a process constituting an infinite population, in the sense that use of results is desirable not only for the limited sample (or population of individuals) who can be studied at a point or during a period of time, but also for the larger process, set of individuals, and expanded time frame about which these individuals provide insight. The sample or popula- tion observed is only a portion of the process, and the intent is to take action on the process (analytic study), not on specific individuals in a limited group (enumerative study). 3. Sampling Issues and Situations 3.1. Issues The design process is triggered when a practitioner plans the sample size to address the study objectives. As its name suggests, the FPC [4, p. 25] should be considered when the population is finite. Application of the FPC reduces the standard error to a degree related to the size of the calculated sample relative to the size of the popu- lation. There has been some debate, however, regarding whether and when the FPC should be applied. Propo- nents of this procedure have offered guidelines for de- ciding when the procedure should be applied. Cochran suggested that the FPC be used, but “in practice the FPC can be ignored whenever the sampling fraction does not exceed 5% and for many purposes even if it is as high as 10%”. The effect of ignoring the correction is to overes- timate the standard error of the estimate [4, p. 25]. Coch- ran recommended the 5% - 10% range at a time when sample design software was not readily available. An alternative position has been that, usually when the target population is finite and small (relative to the raw estimate of the sample), it is appropriate to reduce the sample size by applying the correction and to modify the analysis. Many discussions in the literature concern analysis of datasets that may be considered to be the target popula- tion. A 100% census can be considered a sample in terms of time: as Deming stated, “Any census gives data of the past, but the generalizations and courses of action that are based on it concern the population as it will exist at some time in the future” [14, p. 45]. Hartley and Sielken, in describing various sampling viewpoints, review one in which the observed population is viewed as a sample from a superpopulation [15]. More recently, Elliott et al. [16, pp. 153-155] argued that the FPC not be applied to institutional quality profiling, defined as analysis of com- parative performance evaluative information for health care providers such as hospitals and nursing homes. Elli- ott et al.’s greatest concern about use of the FPC in most profiling situations is that the method could “understate the uncertainty in data for small facili- ties with high (possibly 100%) sampling rates, mis- leading users into thinking that such a facility would be likely to provide below-average (or above-aver- age) care to them. (In fact, because of nonresponse and other survey defects, complete data are never obtained.) We believe the standard representation of precision and uncertainty is appropriate in profiling applications, and that finite population sampling method-based approaches do not provide real gains in precision with respect to the questions that the surveys attempt to address.” While this argument has merit, a counter-argument is that if the purpose of the study is to make an inference about the care provided to that specific group of patients in the small hospitals at that point in time, then the “fi- niteness” of that small population should be addressed. 3.2. Situations Three different sampling situations are summarized in Table 1, and Figure 1 shows the decision process. (Note the similarities to Hahn and Meeker’s [1993] Figure 1, Determining When to Apply the Finite Population Cor- rection.) The situations are presented below. Situation 1. The study goal involves taking a sample from a large finite target population for which enu- meration is needed. (Alternatively, our goal might have been to generalize to a non-finite (infinite) population over time.) We assume that we do not have the resources to count all of the admissions to support our decision- making process, so we draw a sample, make inferences Open Access AM 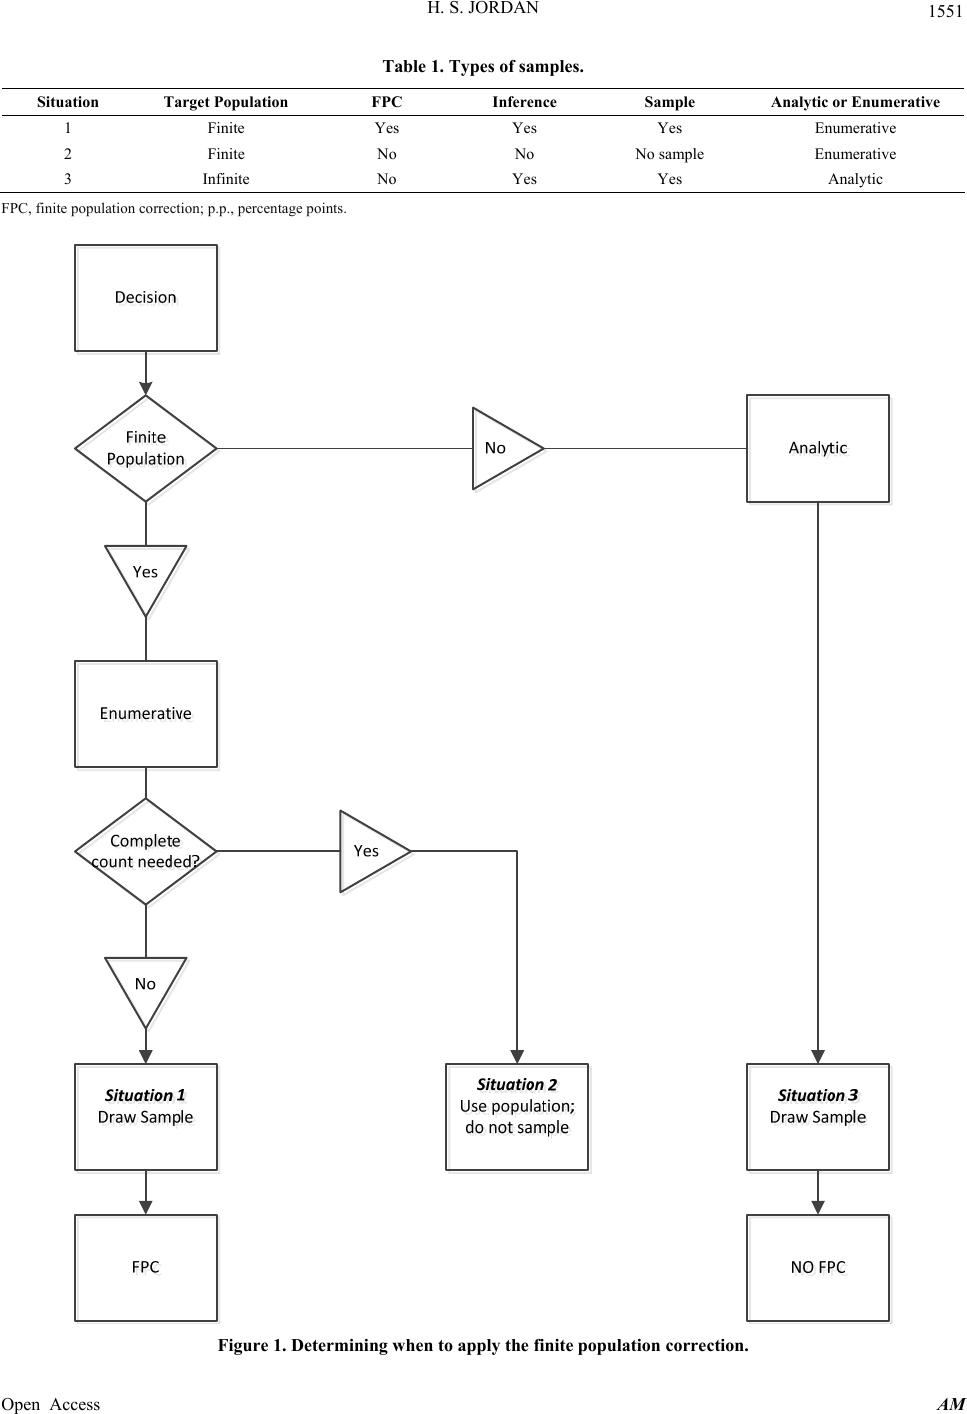 H. S. JORDAN Open Access AM 1551 Table 1. Types of samples. Situation Target Population FPC Inference Sample Analytic or Enumerative 1 Finite Yes Yes Yes Enumerative 2 Finite No No No sample Enumerative 3 Infinite No Yes Yes Analytic FPC, finite population correction; p.p., percentage points. Figure 1. Determining when to apply the finite population correction.  H. S. JORDAN 1552 about this large population, and decide on the basis of the sample whether to take action on this large finite popula- tion. For example, failing to remove a foreign object used in surgery is an avoidable patient safety event [17]. The goal is to reduce the percentage of surgeries when patients at a specific hospital leave surgery with foreign objects (e.g., surgical sponges) in a wound cavity. In this situation, we assume that the patient population of inter- est is finite and that the sample to be drawn constitutes a small proportion of the target patient population. The larger the sample relative to the target population, the more useful the FPC. It should be noted, that when sampling from a finite population, the analysis is somewhat more complicated, because the size of the population must be taken into account when statistics are computed. The full mechanics of this issue are beyond the scope of this article, but one common example is when one needs to adjust the stan- dard error of a statistic using the FPC. Consider the sam- ple standard error of a proportion, which is 12 1ppn , where p represents the proportion of some event, N is the population, and n is the sample size. The adjusted standard error is the above quantity multi- plied by the square root of the FPC: 12 12 1ppn NnN 1 . The adjusted standard error can then be used in tests or confidence intervals. Situation 2. The population is finite and the study is enumerative. The goal is to implement a complete enumeration—i.e. to count the number of “defects” in the process so that remediation can occur. Here, quantitative analysis is necessary, but inferential statistical analysis may not be needed because the population is finite and small enough to be counted. Deming points out that when we have access to the entire population, “a 100% sample of the frame provides a complete answer to the question posed for an enumerative problem” and adds that the emphasis is on “how many”, not “why” [1, p. 147]. Say we need to calculate the percentage of admis- sions with medical errors. If the finite population is small, and if we have the resources to count all of the admis- sions, we calculate the medical error rate and decide whether to take action on this small finite population on the basis of the statistics we calculate from this small finite population. In this situation, a sample size calcula- tion during the design phase is not needed; the calcula- tion of inferential statistics (e.g., confidence intervals or significance tests) during the analysis is similarly unnec- essary. Descriptive statistics, such as the proportion of errors in the population, would be appropriate and nec- essary. Another example is calculating the screening rate and following up on the results of screening tests by identifying all unscreened patients (e.g., women for sub- sequent mammography or all children not screened or immunized). Situation 3. The target population is viewed as infinite; such populations are “conceptual populations” [10] or “processes”. For example, managed health care providers are interested in the process of care provided by indi- vidual physicians so that quality of care can be continu- ously improved. Individual providers are not the target of such studies; the goal here is to improve the system of care. Note that this situation includes instances in which the number of patients in an individual physician’s panel may be sparse (e.g., three male patients aged 20 - 29 years), which justifies treating the situation as a sample from the “process” or system. In this situation, our primary objective is to take action to improve future practice, not to improve the care of the sampled popula- tion alone (although that would be an indirect benefit). Table 1 summarizes these three situations. Note that the above situations are not necessarily mu- tually exclusive. Finite populations can also be consid- ered as a part of a superpopulation over time; what dif- ferentiates the three situations are the goals of the study as defined by the quality improvement professional. Changing the goals might change the study from analytic to enumerative. For example, if the goal of Situation 3 were to limit inference to one or several physicians’ pan- els during a finite time period, the study would be con- sidered enumerative rather than analytic. 4. Sample Size Calculations for Various Populations 4.1. Example 1. Finite Population—Patient Safety Survey The Agency for Healthcare Research and Quality has recommended that hospitals implement patient safety surveys. The reasons include, for example, evaluating the “current status of patient safety culture” and investigating temporal changes in patient safety culture. [18] If the purpose of a survey is to assess the current status of pa- tient safety culture, “current” implies a finite population, because the interest centers on a particular group of indi- viduals at a particular point in time. An example of this situation is described by Baldwin et al.’s [19] study of a national survey of postgraduate year 1 and 2 residents of their learning and work environments, in which a random sample of the population of residents (N = 6106) was drawn (Table 1-Situation 1: finite population with sam- pling). For our simulated example, consider the proportion of hospital staff that agree or strongly agree with the fol- lowing statement: We are actively doing things to im- prove patient safety. Assume that we desire to calculate the sample size needed for a two-sided 95% confidence Open Access AM  H. S. JORDAN 1553 interval with a width of 10 percentage points. To be con- servative (maximum sample size needed), we assume that the true proportion will be approximately 50%. Ta- ble 2 illustrates the procedure for three different finite population sizes. The sample sizes were first calculated using non-finite population formulas. These sample sizes were then adjusted for the FPC by the following formula: FPCno FPCno FPC1nnNn N where N = size of the population, nFPC = sample size ad- justed for the FPC, and nno FPC = the sample size unad- justed for the FPC [20]. This example illustrates several points. For a finite population, the impact of the correction factor can be quite large. If the number of staff members in the popu- lation is 500, it is far less costly to sample 224 of them than the 402 that would appear to be required without the finite adjustment. Even if the population is large, as in the example with 600 staff members, it is still far less costly to sample only 241 employees than to sample 402. Note that even though the sample size is reduced, statis- tical accuracy is not decreased, as long as the correct analytic procedures are applied. Note the situation with a staff member population of 200. The required sample size for all of these examples starts with a calculation assuming that the population is infinite—that is the source of the sample size of 402. For a hospital with only 200 staff members, such a calcula- tion seems meaningless—how could a sample size of 402 staff members (recall that we are looking at current hos- pital culture) be obtained? Although that question is not an issue in this finite example where the required sample size is calculated as 134, there may be situations where the 200 staff members could be considered as a “sample in time” (say over several months), and our interest lies in changing the future culture, but that is not what is sought in this staff culture assessment. It is worth men- tioning, however, that a statistician may be asked to cal- culate a sample size and then need to explain why the calculated sample is larger than the entire population. The true target of inference must be specified. 4.2. Example 2. Finite Population—Pay for Performance Pay for performance has become a popular means of re- munerating physicians and hospitals [21] and encourag- ing the provision of high-quality care. Designing a pay- for-performance program for physicians involves choos- ing measures of performance and time frames for quality assessment. One approach is to specify a threshold of performance, which, when exceeded, generates credit to- ward a financial reward. An example is the proportion of men and women within a certain age range who have received beta blockers for the recommended time period after a heart attack. Say that a physician receives a bonus if more than 83% of her eligible patients are on the medi- cation during the required time period. As in the previous example, the conceptualization of the population as finite or infinite can make a large difference in the measure- ment resources, as shown in Table 3. Again, for a finite population (Table 1 -Situation 1: fi- nite population with sampling), the impact of the correc- tion factor can be quite large. If the number of patients in the physician’s panel is 450, it is less costly to sample 213 patients than the 402 that would appear to be re- quired without the finite adjustment. With a 320-member panel, a sample of 402 would not only be inefficient, it would not be possible. As mentioned previously, there may be situations in which the 320 patients could be con- sidered as a “sample in time”. The question is whether the financial reward is viewed as a reward for some very specific time period that has already occurred or, alterna- tively, as an incentive for future performance as expected from the performance already observed. Both options are possible—after all, those who will work with these data can choose their objective. We believe that it is important Table 2. Finite population patient safety examples. Example Population Size: Number of Hospital Employees (N) Sample Size without FPC (nno FPC) Sample Size with FPC (nFPC) Estimated Proportion Width of Interval (percentage points) Confidence Level A 500 402 224 50% 10 p.p. 95% B 200 402 134 50% 10 p.p. 95% C 600 402 241 50% 10 p.p. 95% FPC, finite population correction; p.p., percentage points. Table 3. Finite population pay for performance examples. Example Population Size: Number of Patients (N)Sample Size without FPC (nno FPC) Sample Size with FPC (nFPC) Estimated Proportion Width of Interval Confidence Level A 450 402 213 50% 10 p.p. 95% B 320 402 179 50% 10 p.p. 95% FPC, finite population correction; p.p., percentage points. Open Access AM 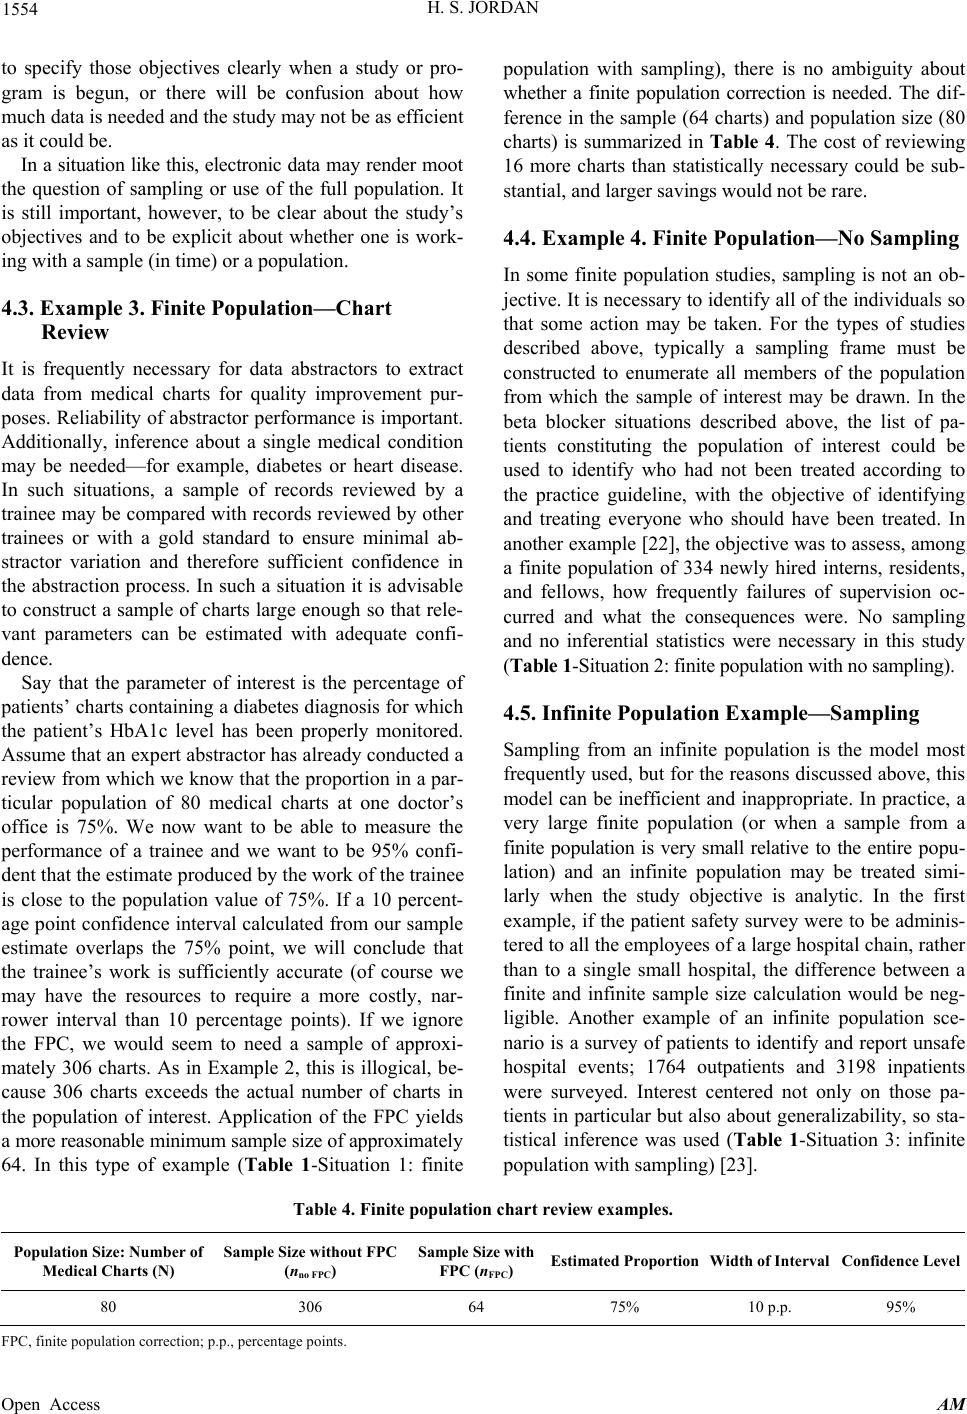 H. S. JORDAN 1554 to specify those objectives clearly when a study or pro- gram is begun, or there will be confusion about how much data is needed and the study may not be as efficient as it could be. In a situation like this, electronic data may render moot the question of sampling or use of the full population. It is still important, however, to be clear about the study’s objectives and to be explicit about whether one is work- ing with a sample (in time) or a population. 4.3. Example 3. Finite Population—Chart Review It is frequently necessary for data abstractors to extract data from medical charts for quality improvement pur- poses. Reliability of abstractor performance is important. Additionally, inference about a single medical condition may be needed—for example, diabetes or heart disease. In such situations, a sample of records reviewed by a trainee may be compared with records reviewed by other trainees or with a gold standard to ensure minimal ab- stractor variation and therefore sufficient confidence in the abstraction process. In such a situation it is advisable to construct a sample of charts large enough so that rele- vant parameters can be estimated with adequate confi- dence. Say that the parameter of interest is the percentage of patients’ charts containing a diabetes diagnosis for which the patient’s HbA1c level has been properly monitored. Assume that an expert abstractor has already conducted a review from which we know that the proportion in a par- ticular population of 80 medical charts at one doctor’s office is 75%. We now want to be able to measure the performance of a trainee and we want to be 95% confi- dent that the estimate produced by the work of the trainee is close to the population value of 75%. If a 10 percent- age point confidence interval calculated from our sample estimate overlaps the 75% point, we will conclude that the trainee’s work is sufficiently accurate (of course we may have the resources to require a more costly, nar- rower interval than 10 percentage points). If we ignore the FPC, we would seem to need a sample of approxi- mately 306 charts. As in Example 2, this is illogical, be- cause 306 charts exceeds the actual number of charts in the population of interest. Application of the FPC yields a more reasonable minimum sample size of approximately 64. In this type of example (Table 1-Situation 1: finite population with sampling), there is no ambiguity about whether a finite population correction is needed. The dif- ference in the sample (64 charts) and population size (80 charts) is summarized in Table 4. The cost of reviewing 16 more charts than statistically necessary could be sub- stantial, and larger savings would not be rare. 4.4. Example 4. Finite Population—No Sampling In some finite population studies, sampling is not an ob- jective. It is necessary to identify all of the individuals so that some action may be taken. For the types of studies described above, typically a sampling frame must be constructed to enumerate all members of the population from which the sample of interest may be drawn. In the beta blocker situations described above, the list of pa- tients constituting the population of interest could be used to identify who had not been treated according to the practice guideline, with the objective of identifying and treating everyone who should have been treated. In another example [22], the objective was to assess, among a finite population of 334 newly hired interns, residents, and fellows, how frequently failures of supervision oc- curred and what the consequences were. No sampling and no inferential statistics were necessary in this study (Table 1-Situation 2: finite population with no sampling). 4.5. Infinite Popula t io n Ex am p le —Sampli ng Sampling from an infinite population is the model most frequently used, but for the reasons discussed above, this model can be inefficient and inappropriate. In practice, a very large finite population (or when a sample from a finite population is very small relative to the entire popu- lation) and an infinite population may be treated simi- larly when the study objective is analytic. In the first example, if the patient safety survey were to be adminis- tered to all the employees of a large hospital chain, rather than to a single small hospital, the difference between a finite and infinite sample size calculation would be neg- ligible. Another example of an infinite population sce- nario is a survey of patients to identify and report unsafe hospital events; 1764 outpatients and 3198 inpatients were surveyed. Interest centered not only on those pa- tients in particular but also about generalizability, so sta- tistical inference was used (Table 1-Situation 3: infinite population with sampling) [23]. Table 4. Finite population chart review examples. Population Size: Number of Medical Charts (N) Sample Size without FPC (nno FPC) Sample Size with FPC (nFPC) Estimated ProportionWidth of Interval Confidence Level 80 306 64 75% 10 p.p. 95% FPC, finite population correction; p.p., percentage points. Open Access AM  H. S. JORDAN 1555 4.6. Discussion The practitioner must determine how the study will be used. Classical analysis assumes that the data are a sim- ple random sample. Clearly, this assumption is some- times not met, especially in electronic full datasets (e.g., health care claims databases). Information in such data- sets may sometimes be viewed as the entire population (not a sample in any sense), although in some instances, such data may be viewed as a “sample in time”, in which case the data may be considered a simple random sample. For this reason, resampling and hierarchical [16, p. 156] models and other related techniques may become increas- ingly attractive as alternative means of analyzing both sparse and large full datasets. The intervention planner must understand that the price of ambiguous objectives can be high. Treating a popula- tion as a sample can lead to the erroneous recommenda- tion that the study is not done because of insufficient power. Treating a dataset as a sample can lead to unjusti- fied lack of confidence about the certainty of the results. The conceptual basis for the FPC can, when appropri- ately applied, provide a rationale for otherwise problem- atic sampling situations. One reason for the advice to ignore the FPC stems from the time before computing resources were ubiquitous; the FPC should always be considered when appropriate to the situation. No thresh- old is needed, especially in the medical research context at the design phase, where each additional sampled unit can be quite expensive, and in the analysis phase, where adjustments for the finite population can identify other- wise undiscovered effects. Not correctly characterizing the data needed as popu- lation or sample can cloud the design and analysis plans of a study. The researcher needs to determine whether an existing dataset is a sample from a finite or infinite popu- lation. Deming’s and Hahn and Meeker’s formulations of this problem provide a conceptual framework for ad- dressing these questions. Whereas designing a study has been the focus of this paper, a parallel case can be made for correctly analyzing data. To obtain the benefit of a correctly designed study, analyses that use the correct variance calculations will enable the researcher to reap the statistical benefit of a smaller sample size. Also, without correct variance cal- culations, the statistical significance of results will be incorrect, so the services of a consulting statistician are necessary to calculate the correct statistics. The finite population correction sample sizes shown in the exam- ples were obtained using formulas that can be imple- mented in a spreadsheet in conjunction with commer- cially available sample size software. The challenge is to correctly distinguish the situations when an FPC adjustment is necessary from situations when it would be inappropriate. For example, consider the rationale of a study by Coffey et al. [24]: “[E]ven though the disparities analysis file contains discharges from a finite sample of hospitals, we treat the sample as though it was drawn from an in- finite population. We do not employ finite popula- tion correction factors in estimating standard errors. We take this approach because we view the out- comes as a result of myriad processes that go into treatment decisions rather than being the result of specific, fixed processes generating outcomes for a specific population and a specific year” [24]. In another example, Elliott et al. [16] make a case against using the FPC in certain situations. For example, they feel that “the greater claims of precision when using FPSM [finite population sampling model] estimators are not justified by additional information or statistical effi- ciency, but rather by changing the question that is being asked….” Furthermore, they believe that: “FPC-based approaches would under represent the uncertainty in data for small facilities with high (possibly 100%) sampling rates, misleading users into thinking that such a facility would be likely to provide below av- erage (or above-average) care to them…”. These concerns may be consistent with our assertion that it is critical to be clear about what question is actu- ally being asked. When that is done, there should not be a “changing” of the question. In order to assist the inter- vention planner, we provide a checklist. If the quality improvement practitioner does not con- sider a population as finite when appropriate, a sample size calculation may yield a sample that is larger than the actual population. Additionally, a practitioner may not benefit from the smaller sample size achievable when, in small populations, the FPC should be applied. The use of electronic records changes, but does not eliminate, many of the issues addressed in this paper. As described above, a full electronic database will still need to be viewed in the context of a sample or a population to be correctly analyzed. If such a database is treated as a sample, the issue of whether it is a sample from a finite or infinite population still needs to be addressed. Alter- natively, the database may be viewed as a population, in which case the study might be enumerative. 4.7. Study Design Checklist for Assessing Appropriateness of FPC 1) Does the study involve taking a sample from a large finite target population for which enumerative inferences are needed? Sampling, inference, and the FPC are needed. Open Access AM  H. S. JORDAN 1556 The larger the sample relative to the target population, the more useful the FPC (Situation 1). 2) Is the population finite and the study objective enu- merative? If so, a complete enumerative count is needed so that all of the items of interest can be repaired or modified, and while quantitative descriptions may be nec- essary, sampling, statistical inference and the FPC are not (Situation 2). 3) Is the target population of interest perceived as infi- nite? Such populations are “conceptual populations” [10, p. 3] or “processes” [10, p. 5]. An analytic approach would be implemented with sampling, inference, but no FPC calculation (Situation 3). One line of future research on this topic could involve a systematic review of a sample of articles involving fi- nite population considerations regarding quality improve- ment. For example, the review could explore which arti- cles define their populations as finite and which do not, then document the rationale in each case (e.g., evaluative purpose, limitation to particular hospitals or practices). 5. Conclusion It is to the intervention planner’s advantage to make the right decision about whether to sample or, in contrast, whether to study a complete population. By clearly speci- fying the objectives of a study and considering explicitly whether the data are a sample or a population, the practi- tioner may be able to design a more efficient study and thereby lower data collection costs and conserve resources. This article builds upon the conceptual framework pioneered by Deming and others by providing applica- tions of that framework to common health care sampling problems in the form of three situation, several examples, and an algorithm. These tools can help the intervention planner determine how to choose the correct sampling design, how to conceptualize the study, and whether or not to apply the FPC. In conclusion, use of the study classification algorithm (Figure 1) guides the interven- tion planner with respect to use or non-use of the FPC. As important, the algorithm helps the planner decide whether, conceptually, the study is analytic or enumera- tive, with important implications for design and analy- sis. 6. Acknowledgements I thank Richard Goldstein, PhD, with whom I developed early ideas on these issues (Jordan, H., & Goldstein, R. [1994]. Does the population exist only in the eye of the beholder? Proceedings of the Section on Quality and Pro- ductivity of the American Statistical Association, 71-76). Suggestions from Steve Berman and Stephen Schmalz, PhD are acknowledged. Loretta Bohn and Loraine Mon- roe’s assistance in preparing the manuscript is also ac- knowledged, as is the support of RTI, International. REFERENCES [1] W. E. Deming, “On Probability as a Basis for Action,” American Statistician, Vol. 29, No. 4, 1975, pp. 146-152. [2] S. M. Berenholtz, D. M. Needham, L. H. Lubomski, C. A. Goeschel and P. J. Pronovost, “Improving the Quality of Quality Improvement Projects,” Joint Commission Jour- nal on Quality and Patient Safety, Vol. 36, No. 10, 2010, pp. 468-473. [3] “Glossary of Statistical Terms.” http://statistics.berkeley.edu/~stark/SticiGui/Text/gloss.htm [4] W. G. Cochran, “Sampling Techniques,” 3rd Edition, John Wiley & Sons, New York, 1977. [5] P. Levy and S. Lemeshow, “Sampling of Populations: Methods and Applications,” John Wiley, New York, 1991. [6] J. Cohen, “Statistical Power Analysis for the Behavioral Sciences,” 2nd Edition, Lawrence Erlbaumn Associates, Hillsdale, 1988. [7] B. Frilling, R. Schiele, A. K. Gitt, R. Zahn, S. Schneider, H. G. Glunz, et al., “Too Little Aspirin for Secondary Prevention after Acute Myocardial Infarction in Patients at High Risk for Cardiovascular Events: Results from the Mitra Study,” American Heart Journal, Vol. 148, No. 2, 2004, pp. 306-311. http://dx.doi.org/10.1016/j.ahj.2004.01.027 [8] G. A. Barnard, “Discussion of Paper by V.P. Godambe and M.E. Thompson, Bayes, Fiducial and Frequent As- pects of Regression Analysis in Survey Sampling,” Jour- nals of the Royal Statistical Society B, Vol. 33, 1973, pp. 361-390. [9] W. G. Cochran, “The Use of Analysis of Variance in Enumeration by Sampling,” Journal of the American Sta- tistical Association, Vol. 34, No. 207, 1939, pp. 492-511. http://dx.doi.org/10.1080/01621459.1939.10503549 [10] G. J. Hahn and W. Q. Meeker, “Assumptions for Statisti- cal Inference,” The American Statistician, Vol. 47, No. 1, 1993, pp. 1-11. [11] L. P. Provost, “Analytical Studies: A Framework for Qual- ity Improvement Design and Analysis,” BMJ Quality & Safety, Vol. 20, No. Suppl. 1, 2011, pp. 92-96. [12] R. J. Perla, L. P. Provost and S. K. Murray, “Sampling Considerations for Health Care Improvement,” Quality Management in Health Care, Vol. 22, No. 1, 2013, pp. 36-47. http://dx.doi.org/10.1097/QMH.0b013e31827deadb [13] D. M. Berwick, “Continuous Improvement as an Ideal in Health Care,” New England Journal of Medicine, Vol. 320, No. 1, 1989, pp. 53-56. http://dx.doi.org/10.1056/NEJM198901053200110 [14] W. E. Deming, “On the Interpretation of Censuses as Samples,” Journal of the American Statistical Association, Vol. 36, No. 213, 1941, pp. 45-49. http://dx.doi.org/10.1080/01621459.1941.10502070 [15] H. O. Hartley and J. Sielken, “A ‘Super-Population View- Open Access AM  H. S. JORDAN Open Access AM 1557 point’ for Finite Population Sampling,” Biometrics, Vol. 31, No. 2, 1975, pp. 411-422. http://dx.doi.org/10.2307/2529429 [16] M. Elliott, A. Zaslavsky and P. Cleary, “Are Finite Popu- lation Corrections Appropriate When Profiling Institu- tions?” Health Services and Outcomes Research Method- ology, Vol. 6, No. 3-4, 2006, pp. 153-156. http://dx.doi.org/10.1007/s10742-006-0011-2 [17] A. A. Gawande, D. M. Studdert, E. J. Orav, T. A. Bren- nan and M. J. Zinner, “Risk Factors for Retained Instru- ments and Sponges after Surgery,” New England Journal of Medic i ne , Vol. 348, No. 3, 2003, pp. 229-235. http://dx.doi.org/10.1056/NEJMsa021721 [18] Agency for Healthcare Research and Quality, “Surveys on Patient Safety Culture.” http://www.ahrq.gov/legacy/qual/patientsafetyculture [19] J. de Baldwin, S. R. Daugherty and P. M. Ryan, “How Residents View Their Clinical Supervision: A Reanalysis of Classic National Survey Data,” Journal of Graduate Medical Education, Vol. 2, No. 1, 2010, pp. 37-45. http://dx.doi.org/10.4300/JGME-D-09-00081.1 [20] “Estimation and Sample Size Determination for Finite Populations.” http://courses.wcupa.edu/rbove/Berenson/10th%20ed%20 CD-ROM%20topics/section8_7.pdf [21] J. Cromwell, M. Trisolini, G. Pope, J. Mitchell and L. Greenwald, “Pay for Performance in Health Care: Meth- ods and Approaches,” RTI International, Research Trian- gle Park, 2011. http://dx.doi.org/10.3768/rtipress.2011.bk.0002.1103 [22] P. T. Ross, E. T. McMyler, S. G. Anderson, K. A. Saran, A. Urteaga-Fuentes, R. C. Boothman, et al., “Trainees’ Perceptions of Patient Safety Practices: Recounting Fail- ures of Supervision,” Joint Commission Journal on Qual- ity and Patient Safety, Vol. 37, No. 2, 2011, pp. 88-95. [23] T. Hasegawa, S. Fujita, K. Seto, T. Kitazawa and K. Ma- tsumoto, “Patients’ Identification and Reporting of Un- safe Events at Six Hospitals in Japan,” Joint Commission Journal on Quality and Patient Safety, Vol. 37, No. 11, 2011, pp. 502-508. [24] R. Coffey, M. Barrett, B. Houchens, K. Ho, E. Moy, J. Brady, et al., “National Healthcare Disparities Report, 2008. Healthcare Cost and Utilization Project (Hcup). Appendix B: Healthcare Cost and Utilization Project (Hcup),” 2008. http://www.ahrq.gov/research/findings/nhqrdr/nhdr08/me thods/HCUP.html
|