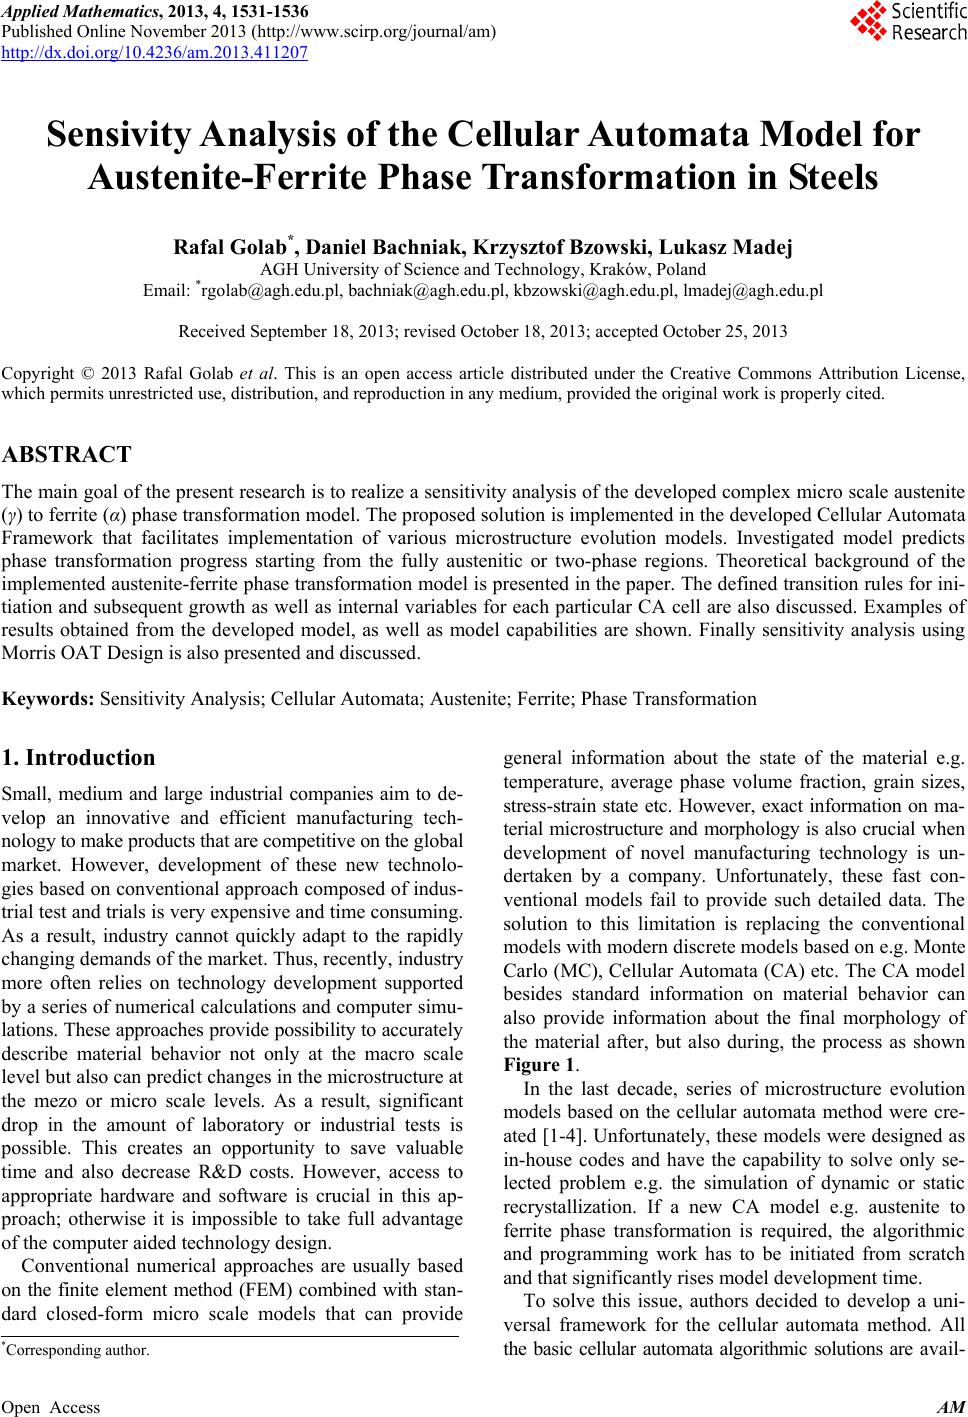
 Applied Mathematics, 2013, 4, 1531-1536 Published Online November 2013 (http://www.scirp.org/journal/am) http://dx.doi.org/10.4236/am.2013.411207 Open Access AM Sensivity Analysis of the Cellular Automata Model for Austenite-Ferrite Phase Transformation in Steels Rafal Golab*, Daniel Bachniak, Krzysztof Bzowski, Lukasz Madej AGH University of Science and Technology, Kraków, Poland Email: *rgolab@agh.edu.pl, bachniak@agh.edu.pl, kbzowski@agh.edu.pl, lmadej@agh.edu.pl Received September 18, 2013; revised October 18, 2013; accepted October 25, 2013 Copyright © 2013 Rafal Golab et al. This is an open access article distributed under the Creative Commons Attribution License, which permits unrestricted use, distribution, and reproduction in any medium, provided the original work is properly cited. ABSTRACT The main goal of the present research is to realize a sensitivity analysis of the developed complex micro scale austenite (γ) to ferrite (α) phase transformation model. The proposed solution is implemented in the developed Cellular Automata Framework that facilitates implementation of various microstructure evolution models. Investigated model predicts phase transformation progress starting from the fully austenitic or two-phase regions. Theoretical background of the implemented austenite-ferrite phase transformation model is presented in the paper. The defined transition rules for ini- tiation and subsequent growth as well as internal variables for each particular CA cell are also discussed. Examples of results obtained from the developed model, as well as model capabilities are shown. Finally sensitivity analysis using Morris OAT Design is also presented and discussed. Keywords: Sensitivity Analysis; Cellular Automata; Austenite; Ferrite; Phase Transformation 1. Introduction Small, medium and large industrial companies aim to de- velop an innovative and efficient manufacturing tech- nology to make products that are competitive on the global market. However, development of these new technolo- gies based on conventional approach composed of indus- trial test and trials is very expensive and time consuming. As a result, industry cannot quickly adapt to the rapidly changing demands of the market. Thus, recently, industry more often relies on technology development supported by a series of numerical calculations and computer simu- lations. These approaches provide possibility to accurately describe material behavior not only at the macro scale level but also can predict changes in the microstructure at the mezo or micro scale levels. As a result, significant drop in the amount of laboratory or industrial tests is possible. This creates an opportunity to save valuable time and also decrease R&D costs. However, access to appropriate hardware and software is crucial in this ap- proach; otherwise it is impossible to take full advantage of the computer aided technology design. Conventional numerical approaches are usually based on the finite element method (FEM) combined with stan- dard closed-form micro scale models that can provide general information about the state of the material e.g. temperature, average phase volume fraction, grain sizes, stress-strain state etc. However, exact information on ma- terial microstructure and morphology is also crucial when development of novel manufacturing technology is un- dertaken by a company. Unfortunately, these fast con- ventional models fail to provide such detailed data. The solution to this limitation is replacing the conventional models with modern discrete models based on e.g. Monte Carlo (MC), Cellular Automata (CA) etc. The CA model besides standard information on material behavior can also provide information about the final morphology of the material after, but also during, the process as shown Figure 1. In the last decade, series of microstructure evolution models based on the cellular automata method were cre- ated [1-4]. Unfortunately, these models were designed as in-house codes and have the capability to solve only se- lected problem e.g. the simulation of dynamic or static recrystallization. If a new CA model e.g. austenite to ferrite phase transformation is required, the algorithmic and programming work has to be initiated from scratch and that significantly rises model development time. To solve this issue, authors decided to develop a uni- versal framework for the cellular automata method. All the basic cellular automata algorithmic solutions are avail- *Corresponding author. 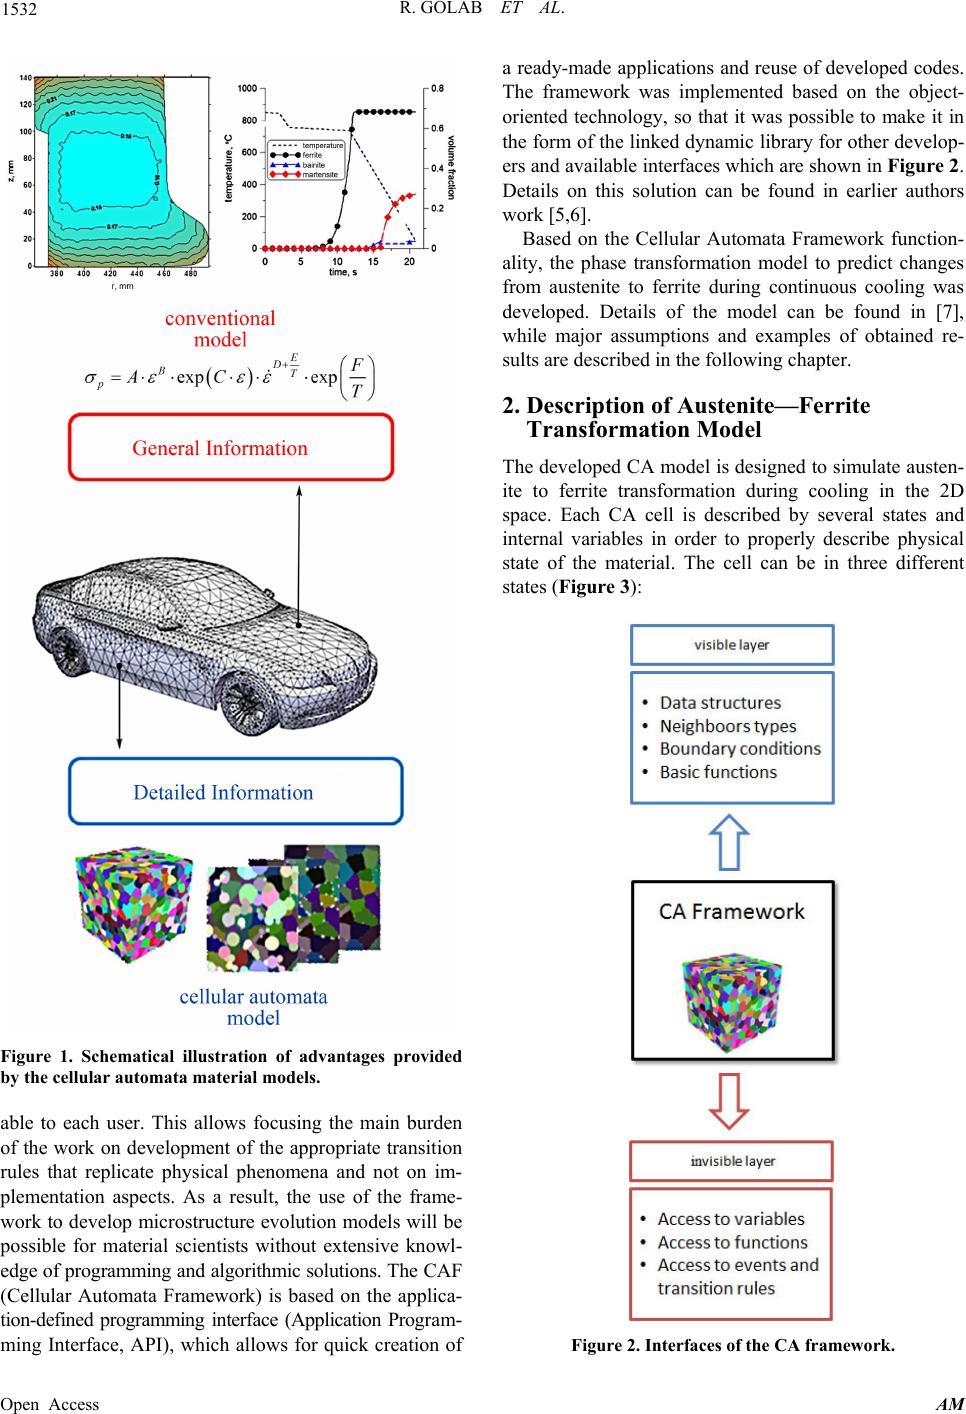 R. GOLAB ET AL. 1532 Figure 1. Schematical illustration of advantages provided by the cellular automata material models. able to each user. This allows focusing the main burden of the work on development of the appropriate transition rules that replicate physical phenomena and not on im- plementation aspects. As a result, the use of the frame- work to develop microstructure evolution models will be possible for material scientists without extensive knowl- edge of programming and algorithmic solutions. The CAF (Cellular Automata Framework) is based on the applica- tion-defined programming interface (Application Program- ming Interface, API), which allows for quick creation of a ready-made applications and reuse of developed codes. The framework was implemented based on the object- oriented technology, so that it was possible to make it in the form of the linked dynamic library for other develop- ers and available interfaces which are shown in Figure 2. Details on this solution can be found in earlier authors work [5,6]. Based on the Cellular Automata Framework function- ality, the phase transformation model to predict changes from austenite to ferrite during continuous cooling was developed. Details of the model can be found in [7], while major assumptions and examples of obtained re- sults are described in the following chapter. 2. Description of Austenite—Ferrite Transformation Model The developed CA model is designed to simulate austen- ite to ferrite transformation during cooling in the 2D space. Each CA cell is described by several states and internal variables in order to properly describe physical state of the material. The cell can be in three different states (Figure 3): Figure 2. Interfaces of the CA framework. Open Access AM 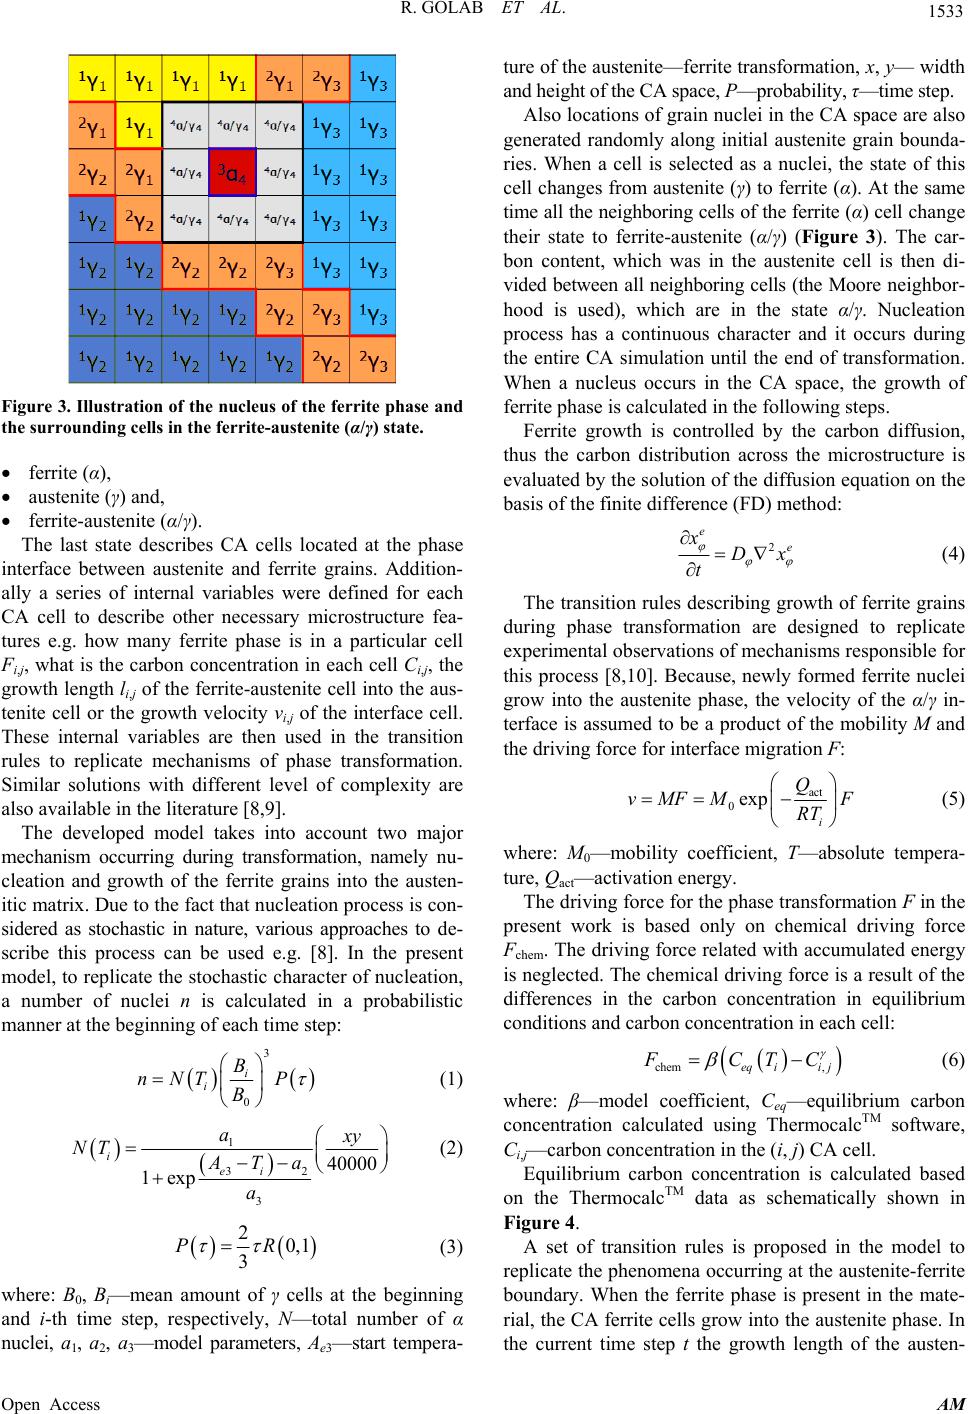 R. GOLAB ET AL. 1533 Figure 3. Illustration of the nucleus of the ferrite phase and the surrounding cells in the ferrite -auste nite (α/γ) state. ferrite (α), austenite (γ) and, ferrite-austenite (α/γ). The last state describes CA cells located at the phase interface between austenite and ferrite grains. Addition- ally a series of internal variables were defined for each CA cell to describe other necessary microstructure fea- tures e.g. how many ferrite phase is in a particular cell Fi,j, what is the carbon concentration in each cell Ci,j, the growth length li,j of the ferrite-austenite cell into the aus- tenite cell or the growth velocity vi,j of the interface cell. These internal variables are then used in the transition rules to replicate mechanisms of phase transformation. Similar solutions with different level of complexity are also available in the literature [8,9]. The developed model takes into account two major mechanism occurring during transformation, namely nu- cleation and growth of the ferrite grains into the austen- itic matrix. Due to the fact that nucleation process is con- sidered as stochastic in nature, various approaches to de- scribe this process can be used e.g. [8]. In the present model, to replicate the stochastic character of nucleation, a number of nuclei n is calculated in a probabilistic manner at the beginning of each time step: 3 0 i i B nNT P B (1) 1 32 3 40000 1exp i ei a y NT ATa a (2) 20,1 3 PR (3) where: B0, Bi—mean amount of γ cells at the beginning and i-th time step, respectively, N—total number of α nuclei, a1, a2, a3—model parameters, Ae3—start tempera- ture of the austenite—ferrite transformation, x, y— width and height of the CA space, P—probability, τ—time step. Also locations of grain nuclei in the CA space are also generated randomly along initial austenite grain bounda- ries. When a cell is selected as a nuclei, the state of this cell changes from austenite (γ) to ferrite (α). At the same time all the neighboring cells of the ferrite (α) cell change their state to ferrite-austenite (α/γ) (Figure 3). The car- bon content, which was in the austenite cell is then di- vided between all neighboring cells (the Moore neighbor- hood is used), which are in the state α/γ. Nucleation process has a continuous character and it occurs during the entire CA simulation until the end of transformation. When a nucleus occurs in the CA space, the growth of ferrite phase is calculated in the following steps. Ferrite growth is controlled by the carbon diffusion, thus the carbon distribution across the microstructure is evaluated by the solution of the diffusion equation on the basis of the finite difference (FD) method: 2 e e xDx t (4) The transition rules describing growth of ferrite grains during phase transformation are designed to replicate experimental observations of mechanisms responsible for this process [8,10]. Because, newly formed ferrite nuclei grow into the austenite phase, the velocity of the α/γ in- terface is assumed to be a product of the mobility M and the driving force for interface migration F: act 0exp i Q vMFM F RT (5) where: M0—mobility coefficient, T—absolute tempera- ture, Qact—activation energy. The driving force for the phase transformation F in the present work is based only on chemical driving force Fchem. The driving force related with accumulated energy is neglected. The chemical driving force is a result of the differences in the carbon concentration in equilibrium conditions and carbon concentration in each cell: chem ,eqii j FCTC (6) where: β—model coefficient, Ceq—equilibrium carbon concentration calculated using ThermocalcTM software, Ci,j—carbon concentration in the (i, j) CA cell. Equilibrium carbon concentration is calculated based on the ThermocalcTM data as schematically shown in Figure 4. A set of transition rules is proposed in the model to replicate the phenomena occurring at the austenite-ferrite boundary. When the ferrite phase is present in the mate- rial, the CA ferrite cells grow into the austenite phase. In the current time step t the growth length of the austen- Open Access AM 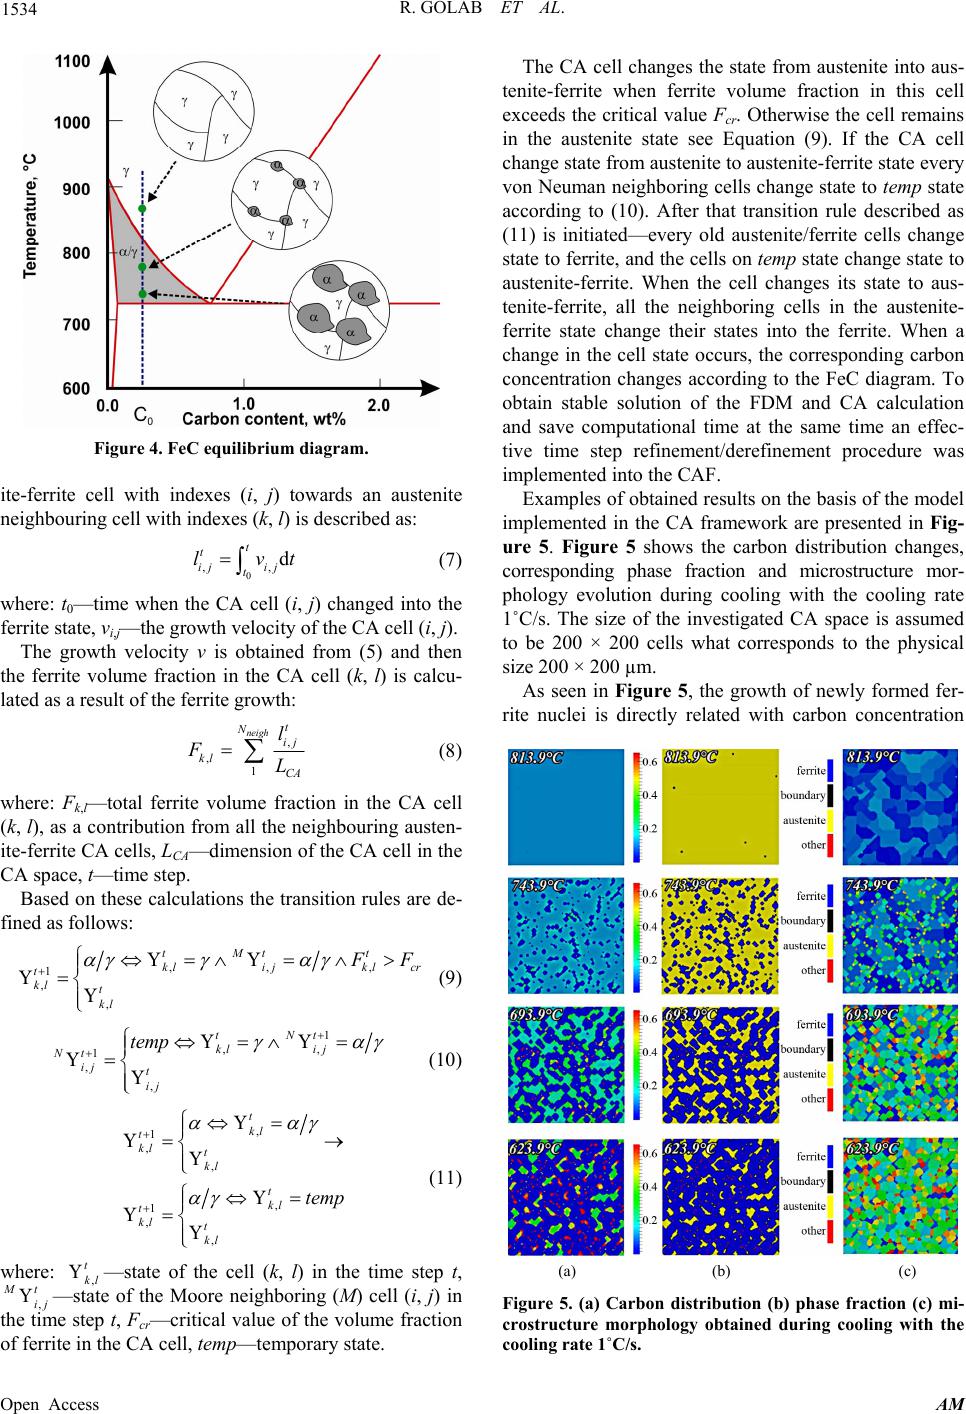 R. GOLAB ET AL. 1534 Figure 4. FeC equilibrium diagram. ite-ferrite cell with indexes (i, j) towards an austenite neighbouring cell with indexes (k, l) is described as: 0 ,, d t t ij ij t lvt (7) where: t0—time when the CA cell (i, j) changed into the ferrite state, vi,j—the growth velocity of the CA cell (i, j). The growth velocity v is obtained from (5) and then the ferrite volume fraction in the CA cell (k, l) is calcu- lated as a result of the ferrite growth: , , 1 neigh t N ij kl CA l FL (8) where: Fk,l—total ferrite volume fraction in the CA cell (k, l), as a contribution from all the neighbouring austen- ite-ferrite CA cells, LCA—dimension of the CA cell in the CA space, t—time step. Based on these calculations the transition rules are de- fined as follows: ,, , 1 , , tMt t kli jklcr t kl t kl F (9) 1 ,, 1 , , tNt kli j Nt ij t ij temp (10) , 1 , , , 1 , , t kl t kl t kl t kl t kl t kl temp (11) where: ,—state of the cell (k, l) in the time step t, , t kl t ij —state of the Moore neighboring (M) cell (i, j) in the time step t, Fcr—critical value of the volume fraction of ferrite in the CA cell, temp—temporary state. The CA cell changes the state from austenite into aus- tenite-ferrite when ferrite volume fraction in this cell exceeds the critical value Fcr. Otherwise the cell remains in the austenite state see Equation (9). If the CA cell change state from austenite to austenite-ferrite state every von Neuman neighboring cells change state to temp state according to (10). After that transition rule described as (11) is initiated—every old austenite/ferrite cells change state to ferrite, and the cells on temp state change state to austenite-ferrite. When the cell changes its state to aus- tenite-ferrite, all the neighboring cells in the austenite- ferrite state change their states into the ferrite. When a change in the cell state occurs, the corresponding carbon concentration changes according to the FeC diagram. To obtain stable solution of the FDM and CA calculation and save computational time at the same time an effec- tive time step refinement/derefinement procedure was implemented into the CAF. Examples of obtained results on the basis of the model implemented in the CA framework are presented in Fig- ure 5. Figure 5 shows the carbon distribution changes, corresponding phase fraction and microstructure mor- phology evolution during cooling with the cooling rate 1˚C/s. The size of the investigated CA space is assumed to be 200 × 200 cells what corresponds to the physical size 200 × 200 µm. As seen in Figure 5, the growth of newly formed fer- rite nuclei is directly related with carbon concentration (a) (b) (c) Figure 5. (a) Carbon distribution (b) phase fraction (c) mi- crostructure morphology obtained during cooling with the cooling rate 1˚C/s. Open Access AM 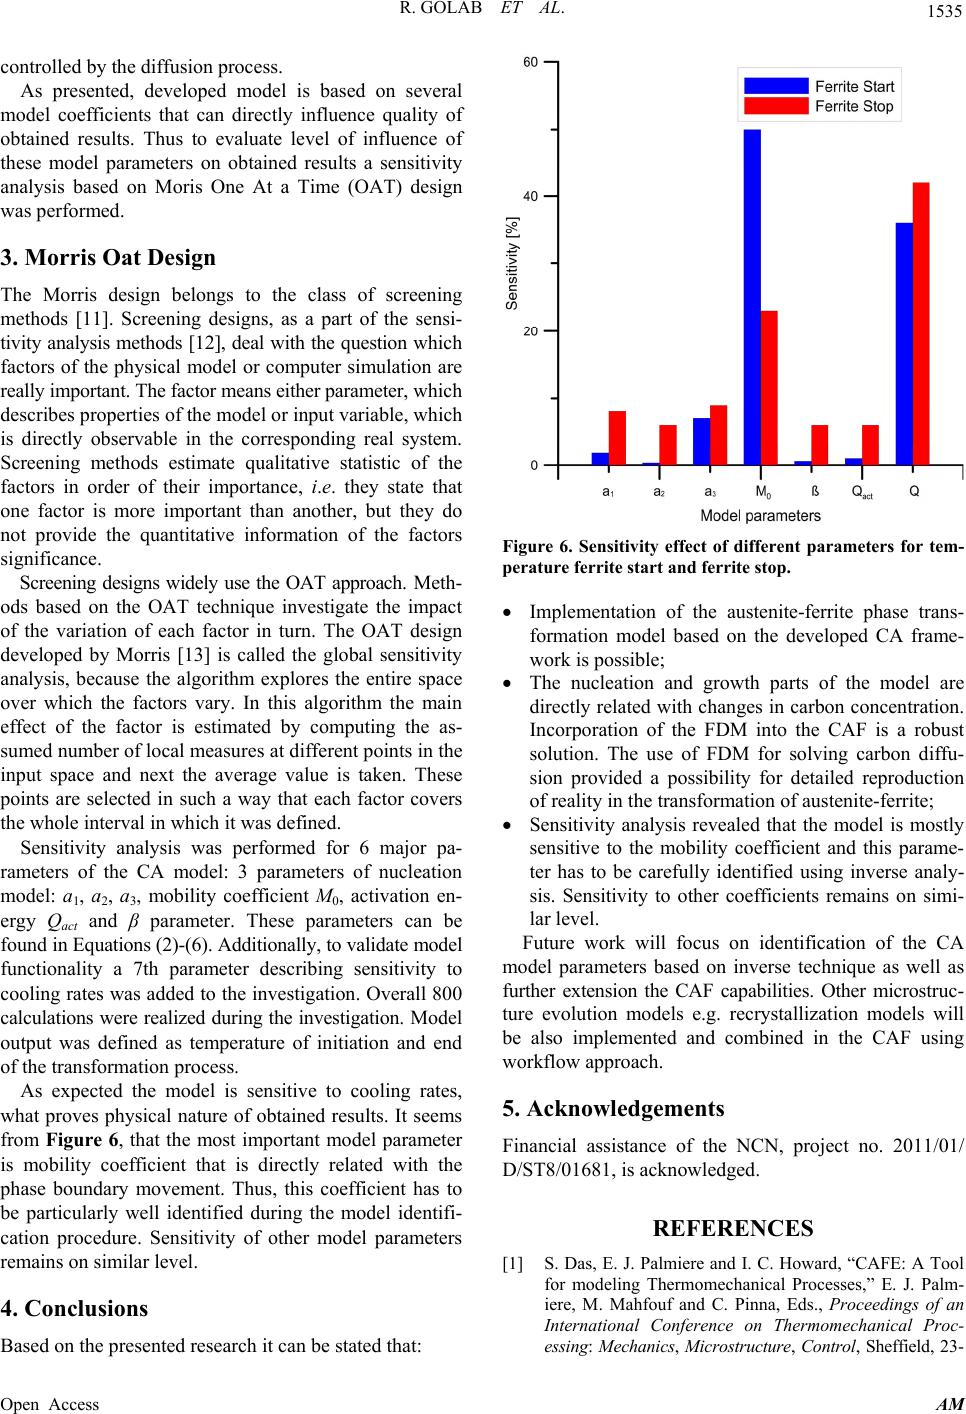 R. GOLAB ET AL. 1535 controlled by the diffusion process. As presented, developed model is based on several model coefficients that can directly influence quality of obtained results. Thus to evaluate level of influence of these model parameters on obtained results a sensitivity analysis based on Moris One At a Time (OAT) design was performed. 3. Morris Oat Design The Morris design belongs to the class of screening methods [11]. Screening designs, as a part of the sensi- tivity analysis methods [12], deal with the question which factors of the physical model or computer simulation are really important. The factor means either parameter, which describes properties of the model or input variable, which is directly observable in the corresponding real system. Screening methods estimate qualitative statistic of the factors in order of their importance, i.e. they state that one factor is more important than another, but they do not provide the quantitative information of the factors significance. Screening designs widely use the OAT approach. Meth- ods based on the OAT technique investigate the impact of the variation of each factor in turn. The OAT design developed by Morris [13] is called the global sensitivity analysis, because the algorithm explores the entire space over which the factors vary. In this algorithm the main effect of the factor is estimated by computing the as- sumed number of local measures at different points in the input space and next the average value is taken. These points are selected in such a way that each factor covers the whole interval in which it was defined. Sensitivity analysis was performed for 6 major pa- rameters of the CA model: 3 parameters of nucleation model: a1, a2, a3, mobility coefficient M0, activation en- ergy Qact and β parameter. These parameters can be found in Equations (2)-(6). Additionally, to validate model functionality a 7th parameter describing sensitivity to cooling rates was added to the investigation. Overall 800 calculations were realized during the investigation. Model output was defined as temperature of initiation and end of the transformation process. As expected the model is sensitive to cooling rates, what proves physical nature of obtained results. It seems from Figure 6, that the most important model parameter is mobility coefficient that is directly related with the phase boundary movement. Thus, this coefficient has to be particularly well identified during the model identifi- cation procedure. Sensitivity of other model parameters remains on similar level. 4. Conclusions Based on the presented research it can be stated that: Figure 6. Sensitivity effect of different parameters for tem- perature ferrite start and ferrite stop. Implementation of the austenite-ferrite phase trans- formation model based on the developed CA frame- work is possible; The nucleation and growth parts of the model are directly related with changes in carbon concentration. Incorporation of the FDM into the CAF is a robust solution. The use of FDM for solving carbon diffu- sion provided a possibility for detailed reproduction of reality in the transformation of austenite-ferrite; Sensitivity analysis revealed that the model is mostly sensitive to the mobility coefficient and this parame- ter has to be carefully identified using inverse analy- sis. Sensitivity to other coefficients remains on simi- lar level. Future work will focus on identification of the CA model parameters based on inverse technique as well as further extension the CAF capabilities. Other microstruc- ture evolution models e.g. recrystallization models will be also implemented and combined in the CAF using workflow approach. 5. Acknowledgements Financial assistance of the NCN, project no. 2011/01/ D/ST8/01681, is acknowledged. REFERENCES [1] S. Das, E. J. Palmiere and I. C. Howard, “CAFE: A Tool for modeling Thermomechanical Processes,” E. J. Palm- iere, M. Mahfouf and C. Pinna, Eds., Proceedings of an International Conference on Thermomechanical Proc- essing: Mechanics, Microstructure, Control, Sheffield, 23- Open Access AM  R. GOLAB ET AL. Open Access AM 1536 26 June 2002, pp. 296-301. [2] C. H. J. Davies, “Growth of Nuclei in a Cellular Automa- ton Simulation of Recrystalization,” Scripta Materialia, Vol. 36, No. 1, 1997, pp. 35-40. http://dx.doi.org/10.1016/S1359-6462(96)00331-4 [3] J. Gawąd and M. Pietrzyk, “Application of CAFE Cou- pled Model to Description of Microstructure Develop- ment during Dynamic Recrystallization,” Archives of Met- allurgy and Materials, Vol. 52, No. 2, 2007, pp. 257-266. [4] L. Madej, P. D. Hodgson and M. Pietrzyk, “Development of the Multi-Scale Analysis Model to Simulate Strain Localization Occurring during Material Processing,” Ar- chives of Computational Methods in Engineering, Vol. 16, No. 3, 2009, pp. 287-231. http://dx.doi.org/10.1007/s11831-009-9033-6 [5] P. Spytkowski, T. Klimek, L. Rauch and L. Madej, “Im- plementation of Cellular Automata Framework Dedicated to Digital Material Representation,” Computer Methods in Materials Science, Vol. 9, No. 2, 2009, pp. 283-288. [6] L. Rauch, L. Madej and K. Perzynski, “Numerical Simu- lations of the Microscale Material Phenomena Based on Cellular Automata Framework and Workflow Idea,” Pro- ceedings of the 17th ISPE International Conference on Concurrent Engineering, Cracow, 6-10 September 2010, pp. 539-546. [7] R. Golab and L. Madej, “Development of the Complex Austenite—Ferrite Transformation Model Based on CA Method,” 22nd International Conference on Metallurgy and Materials, Brno, 15-17 May 2013. [8] Y. J. Lan, D. Z. Li and Y. Y. Li, “Modeling Austenite Decomposition into Ferrite at Different Cooling Rate in Low-Carbon Steel with Cellular Automaton Method,” Acta Materialia, Vol. 52, No. 6, 2004, pp. 1721-1729. http://dx.doi.org/10.1016/j.actamat.2003.12.045 [9] M. Pietrzyk, L. Madej, L. Rauch and R. Golab, “Multis- cale Modeling of Microstructure Evolution during Lami- nar Cooling of Hot Rolled DP Steels,” Archives of Civil and Mechanical Engineering, Vol. 10, No. 4, 2010, pp. 66-67. http://dx.doi.org/10.1016/S1644-9665(12)60031-4 [10] Y. J. Lan, N. M. Xiao, D. Z. Li and Y. Y. Li, “Mesoscale Simulation of Deformed Austenite Decomposition into Ferrite by Coupling a Cellular Automaton Method with a crystal Plasticity Finite Element Model,” Acta Materialia, Vol. 53, No. 4, 2005, pp. 991-1003. http://dx.doi.org/10.1016/j.actamat.2004.10.045 [11] A. Saltelli, K. Chan and E. M. Scott, “Sensitivity Analy- sis,” Wiley, Hoboken, 2000. [12] M. Kleiber, H. Antunez, T. D. Hien and P. Kowalczyk, “Parameter Sensitivity in Nonlinear Mechanics,” Wiley, Hoboken, 1997. [13] M. D. Morris, “Factorial Sampling Plans for Preliminary Computational Experiments,” Technometrics, Vol. 33, No. 2, 1991, pp. 161-174. http://dx.doi.org/10.1080/00401706.1991.10484804
|