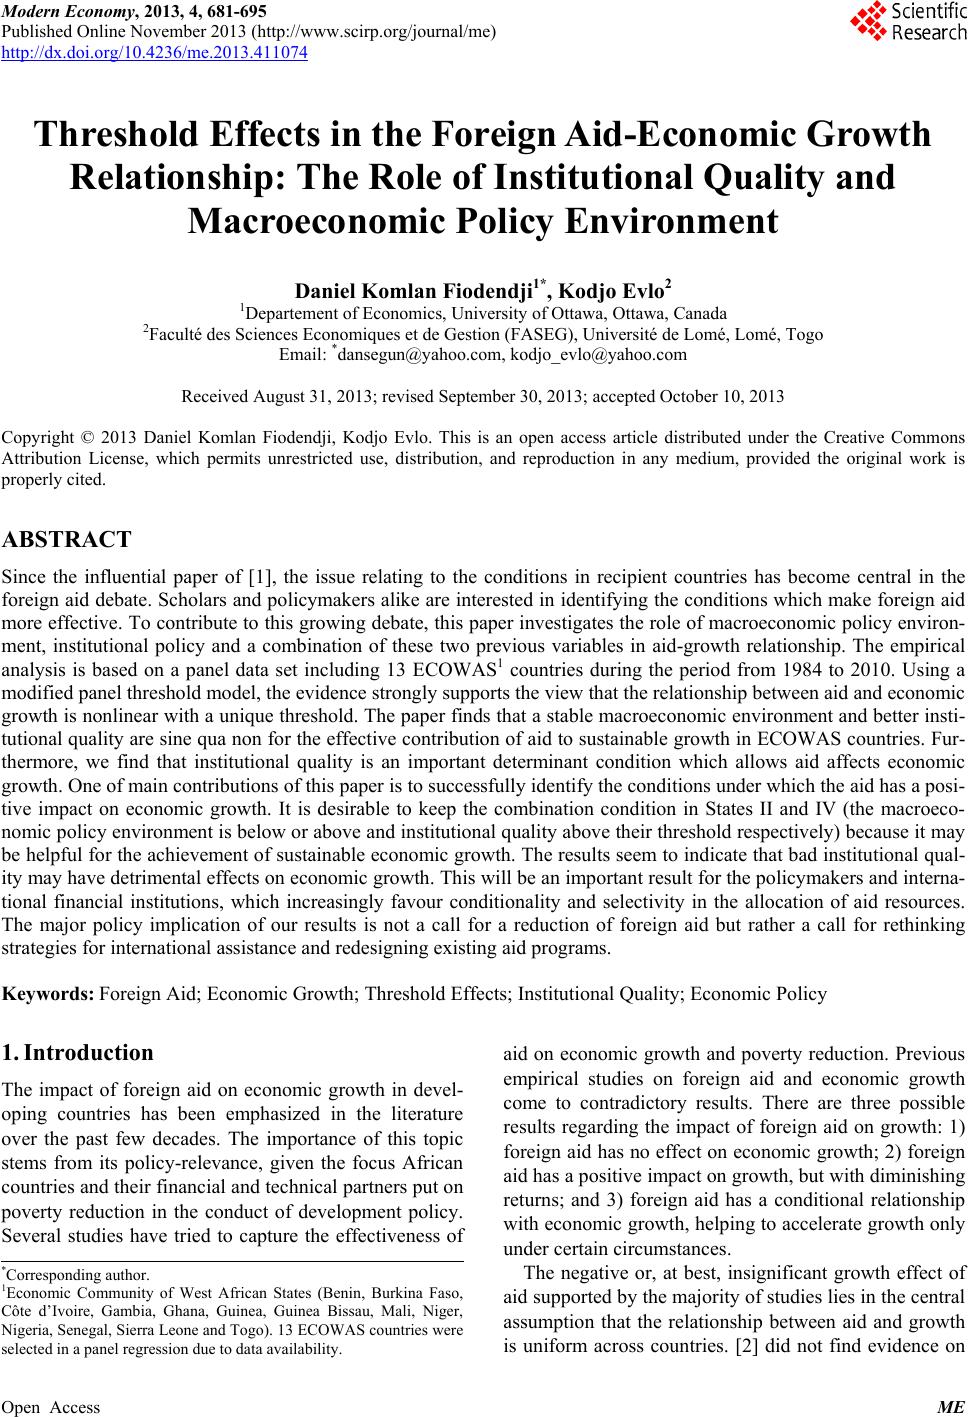
 Modern Economy, 2013, 4, 681-695 Published Online November 2013 (http://www.scirp.org/journal/me) http://dx.doi.org/10.4236/me.2013.411074 Open Access ME Threshold Effects in the Foreign Aid-Economic Growth Relationship: The Role of Institutional Quality and Macroeconomic Policy Environment Daniel Komlan Fiodendji1*, Kodjo Evlo2 1Departement of Economics, University of Ottawa, Ottawa, Canada 2Faculté des Sciences Economiques et de Gestion (FASEG), Université de Lomé, Lomé, Togo Email: *dansegun@yahoo.com, kodjo_evlo@yahoo.com Received August 31, 2013; revised September 30, 2013; accepted October 10, 2013 Copyright © 2013 Daniel Komlan Fiodendji, Kodjo Evlo. This is an open access article distributed under the Creative Commons Attribution License, which permits unrestricted use, distribution, and reproduction in any medium, provided the original work is properly cited. ABSTRACT Since the influential paper of [1], the issue relating to the conditions in recipient countries has become central in the foreign aid debate. Scholars and policymakers alike are interested in identifying the conditions which make foreign aid more effective. To contribute to this growing debate, this paper investigates the role of macroeconomic policy environ- ment, institutional policy and a combination of these two previous variables in aid-growth relationship. The empirical analysis is based on a panel data set including 13 ECOWAS1 countries during the period from 1984 to 2010. Using a modified panel threshold model, the evidence strongly supports the view that the relationship between aid and economic growth is nonlinear with a unique threshold. The paper finds that a stable macroeconomic environment and better insti- tutional quality are sine qua non for the effective contribution of aid to sustainable growth in ECOWAS countries. Fur- thermore, we find that institutional quality is an important determinant condition which allows aid affects economic growth. One of main contributions of this paper is to successfully identify the conditions under which the aid has a posi- tive impact on economic growth. It is desirable to keep the combination condition in States II and IV (the macroeco- nomic policy environment is below or above and institutional quality above their threshold respectively) because it may be helpful for the achievement of sustainable economic growth. The results seem to indicate that bad institutional qual- ity may have detrimental effects on economic growth. This will be an important result for the policymakers and interna- tional financial institutions, which increasingly favour conditionality and selectivity in the allocation of aid resources. The major policy implication of our results is not a call for a reduction of foreign aid but rather a call for rethinking strategies for international assistance and redesigning existing aid programs. Keywords: Foreign Aid; Economic Growth; Threshold Effects; Institutional Quality; Economic Policy 1. Introduction The impact of foreign aid on economic growth in devel- oping countries has been emphasized in the literature over the past few decades. The importance of this topic stems from its policy-relevance, given the focus African countries and their financial and technical partners put on poverty reduction in the conduct of development policy. Several studies have tried to capture the effectiveness of aid on economic growth and poverty reduction. Previous empirical studies on foreign aid and economic growth come to contradictory results. There are three possible results regarding the impact of foreign aid on growth: 1) foreign aid has no effect on economic growth; 2) foreign aid has a positive impact on growth, but with diminishing returns; and 3) foreign aid has a conditional relationship with economic growth, helping to accelerate growth only under certain circumstances. The negative or, at best, insignificant growth effect of aid supported by the majority of studies lies in the central assumption that the relationship between aid and growth is uniform across countries. [2] did not find evidence on *Corresponding author. 1Economic Community of West African States (Benin, Burkina Faso, Côte d’Ivoire, Gambia, Ghana, Guinea, Guinea Bissau, Mali, Niger, igeria, Senegal, Sierra Leone and Togo). 13 ECOWAS countries were selected in a panel regression due to data availability.  D. K. FIODENDJI, K. EVLO 682 the relationship between aid and growth rate in develop- ing countries. [3] finds that aid has no impact on growth or investment. However, [4,5] report a positive effect of aid on economic growth, although aid is shown to have diminishing returns. The recent literature has tried to es- tablish that aid works under certain conditions. Various scholars have argued that aid is indeed effective in good policy environments (see [6,7]). Since the influential paper of [1], the issue relating to the conditions in recipient countries has become central in the foreign aid debate. Scholars and policymakers alike are interested in identifying the conditions which make foreign aid more effective. Does aid effectiveness vary with the recipient country or with domestic regime type? Is foreign aid more effective at promoting growth in good macroeconomic environments or in settings where institutional quality is good? Motivated by these questions, the crucial goal of this paper is to contribute to the inconclusive debate on aid and growth relationship. More specifically, this study empirically examines the link among aid and growth conditioned to the role of macroeconomic policy envi- ronment and institutional quality in ECOWAS countries. Developing countries are in fact specified by the vari- ous economic problems these countries are often faced. For example, a low level of income, a high level of un- employment, a very low industrial capacity utilization, and a high poverty level. In addressing these problems, foreign aid has been suggested as a veritable option for augmenting the insufficient domestic resources. While some countries that have benefited from foreign assis- tance at one time or the other have grown such that they have become aid donors (South Korea, China etc.), ma- jority of countries in Africa have remained backward. ECOWAS countries have continued to benefit from all sorts of foreign assistance and in fact still collect at least as much as the amount collected in the early 1980s, yet socio-economic development has remained dismal. Whilst there could be so many determinants explaining these unfavourable trends, the incessant socio-political crisis, policy inconsistencies, macroeconomic instability and bad institutional quality evident in many ECOWAS countries which are indeed indicators of poor policy framework, should give one a pause. On the contrary, however, [8] suggested that empirically, aid is effective everywhere, even in bad policy environments. To address these issues, this paper applies an alterna- tive modelling approach on which uses a threshold vari- able to investigate whether the relationship between aid and growth is different in each sample grouped on the basis of certain thresholds. Threshold models are simple yet efficient methods to capture nonlinearities in cross section and time series models. They split the sample into classes based on the value of observed variables ac- cording to threshold values. Indeed, there are various ways to identify the presence of a threshold in an eco- nomic relationship, depending on the criteria used to de- termine how to split the sample. [9] applies the technique of exogenously imposed data splits as a straightforward technique to select sub-sample. In order to determine the existence of threshold effects between two variables is different from the traditional approach in which the threshold level is determined exogenously. However, under this approach both the number of regimes and the location of sample splits are arbitrarily selected and not based on prior economic guidance. Another limitation of this approach is that it is not possible to derive confi- dence intervals for the location of the threshold. The ro- bustness of the results from the conventional approach is likely to be sensitive to the level of the threshold. The econometric estimator generated on the basis of exoge- nous sample splitting may also generate serious inferen- tial problems (for further details, see [10,11]). Threshold models have some popularity in current applied econo- metric practice. The model splits the sample into classes based on the value of an observed variable-whether or not it exceeds some threshold. When the threshold is unknown (as is typical in practice) it needs to be esti- mated, and this increases the complexity of the econo- metric problem. A theory of estimation and inference is fairly well developed for linear models with exogenous regressors, including [10-13]. These papers explicitly exclude the presence of en- dogenous variables, and this has been an obstacle to em- pirical application, including panel models. Advantages of the endogenous threshold regression technique over the traditional approach are that: 1) it does not require any specified functional form of non-linearity, and the number and location of thresholds are endogenously de- termined by the data; and 2) asymptotic theory applies, which can be used to construct appropriate confidence intervals. A bootstrap method to assess the statistical si- gnificance of the threshold effect, in order to test the null hypothesis of a linear formulation against a threshold al- ternative, is also available. This approach is supposed to eliminate multicollinearity problems among some of the regressors, in order to be able to identify the partial ef- fects of these variables on the dependent variable. For this purpose we used a sample of 13 ECOWAS countries co- vering the period 1984-2010. For the purpose of presentation, the rest of this paper is structured as follows: Sections 2 describes the evolution of aid in ECOWAS countries, Section 3 provides econo- metrics methodology, Section 4 sets out our empirical ana- lysis and interpretation of our results, and Section 5 pro- vides concluding remarks. 2. Foreign Aid in ECOWAS Countries Figure 1 depicts the evolution of the ratio of total foreign id to GDP. For the whole ECOWAS countries, the a Open Access ME  D. K. FIODENDJI, K. EVLO Open Access ME 683 Figure 1. Trends in Aid to ECOWAS countries, 1984-2010. average variations seem to stable around 10%. In Guinea Bissau, aid has reached its highest levels in the 1990s, with a peak of 51% in 1996. Three countries have received relatively small amounts of aid. These countries are Côte d’Ivoire, Guinea and Nigeria. Fur- thermore in the latter country, the ratio of aid was around 1% during 1990s. After that, it became almost nil from 1995 to 2005 before rising slightly and making a jump to 8% in 2007. The trend is stable at our countries sample level. However, for Sierra Leone, there is a change sawtooth. For example, the ratio of aid is around 5% in 1990 except for 2003 (22%) and 2008 (21%). In general case, we have been observed some convergence of ratio of aid for most of ECOWAS countries from the 2000s. In fact the ratio of aid is between 1% and 10%. 3. Econometric Methodo logy Threshold models are simple yet efficient methods to capture nonlinearities in cross section and time series models. The main purpose of this paper is to use a thres- hold variable to investigate whether the relationship be- tween Aid and economic growth through the policy en- vironment and institutional quality is different in each sample grouped on the basis of certain thresholds. The endogenous determination of threshold effects between variables is different from the traditional approach in which the threshold level is determined exogenously. If the threshold level is chosen arbitrarily, or is not deter- mined within an empirical model, it is not possible to derive confidence intervals for the chosen threshold. The robustness of the results from the conventional approach is likely to be sensitive to the level of the threshold. The econometric estimator generated on the basis of exoge- nous sample splitting may also pose serious inferential problems (for further details, see [10,11]). 3.1. Econometric Framework: Panel Threshold Models [10] developed the econometric techniques appropriate for threshold regression with panel data. Allowing for fixed individual effects, the panel threshold model di- vides the observations into two or more regimes, depen- ding on whether each observation is above or below the threshold level. The general specification threshold mo- del takes the following form: 1 11 0 11 K itik itkitk k it KitKit yxIq xI q (1) where subscripts i stands for the cross-sections with 1iN and t indexes times . i 1tT is the countries-specific fixed effect and the error term it is independent and identically distributed (iid) with mean zero and finite variance 2 . I(.) is the indicator function indicating the regime defined by the threshold variable it the threshold parameter γ. it is dependent variable and the vector of explanatory variables. 0 q it x y , 1K . Equation (1) allows for K threshold values and, thus, (K+1) regimes. In each regime, the marginal effect of it xk on may differ. it Following the modified version of [10] panel threshold model proposed by [14], we consider a discriminator constant which is not individual specific but captures a common effect for all cross-sections. According to these authors, ignoring regime dependent intercepts y k can lead to biased estimates of both the thresholds and the corresponding marginal impacts. 1 11 0 11 K itikk it kitk k Kit KitKit yxI xI q 1 q (2) This formulation assumes that the difference in the re- gime intercepts, represented by k , is not individual specific but the same for all cross-sections. According to [14], omission of any variable correlated with at least one regressor and the dependent variable causes biased esti- mates, but regime intercepts are a particularly interesting  D. K. FIODENDJI, K. EVLO 684 case. First, the bias can be clearly interpreted. Second, availability of regime intercepts as regressors is not an issue since they are as easily constructed as the re- gime-dependent exogenous regressors for a given thresh- old. 3.2. Estimation and Test Strategy 3.2.1. Estimation Method Estimation of the panel threshold model involves several stages. First, estimation of the parameters model requires eliminating the individual effects i by removing indi- vidual-specific means and then applying the least squares sequential procedure (see [10] for more details). Indeed, the individual specific effects are eliminated using the standard fixed-effects transformation implying for the identification of k and 1k that the elements of it are neither time-invariant nor adding up to a vector of ones. This case applies to regime intercepts which are usually included in each regime in threshold models in pure cross-sectional or time-series contexts. For example, in the case of two regimes, even in the presence of fixed effects it is possible to control for differences in the re- gime intercepts by including them in all but one regime as in the extension of the following equation2: 11 2it iitititit yxIqxIq it (3) The seminal contribution of [11] allows us to estimate and make valid statistical inferences on the threshold. There are three statistical issues that need to be addressed in a threshold model: 1) how to jointly estimate the threshold value and the slope parameters; 2) how to test the hypothesis that a threshold exists and; 3) how to construct confidence intervals for and β. We briefly discuss each in turn. [11] recommends obtaining the least squares estimate ˆ as the value that minimizes the concentrated sum of squared errors, 1 S . The sum of the squared error function depends on only through the indicator function. Hence, the minimization problem is a step procedure where each step occurs at distinct values of the observed threshold variable it qfter the threshold value . A is estimated, it is important to deter- mine whether the threshold effect is statistically signifi- cant. In order to test the statistical significance of a threshold effect typically we would want to test the null hypothesis of no threshold effect, 01 2 :H . How- ever, since is only identified under the alternative 11 2 :H , the distribution of classical test statistics, such as the Wald and Likelihood ratio tests, are not as- ymptotically Chi-squared. In essence this is because the likelihood surface is flat with respect to , consequently the information matrix becomes singular and standard asymptotic arguments no longer apply. There are meth- ods for handling hypothesis testing within these contexts. In some instances, we are able to bind the asymptotic dis- tribution of likelihood ratio statistics ([15,16]); alter- natively their asymptotic distribution must be derived by bootstrap methods (see [11]). The appropriate test statis- tic is 01 12 ˆ ˆ SS F where and are, respect- 0 S1 S tively, the residual sum of squares under the null hy- pothesis 0 and the alternative 1 with 2 ˆ the re- sidual variance under the alternative hypothesis. Once the threshold effect exists, the next question is whether or not the threshold value can be known. The null hypothe- sis of the threshold value is 00 :H , and the likely- hood ratio statistics is 11 12 ˆ ˆ SS LR where 1 S and 1ˆ S are the residual sum of squares from Equation (3) given the true and estimated value, respec- tively. The null hypothesis is rejected for large value of 1. The asymptotic distribution of LR 10 LR can be used to form valid asymptotic confidence interval about the estimated threshold values. The statistics of 1 LR 0 are not normally distributed and [11] com- puted their no-rejection region, c with the given asymptotic level. He proves that the distribution function has the inverse 2ln 11c from which it is easy to compute the critical values. The test rejects the null hypothesis at the asymptotic level if 1 LR 0 exceeds c . The asymptotic 1 con- fidence interval for is set of values of such that 10 LR c . 3.2.2. Regime Intercepts The role of regime intercepts will be discussed in the context of a single threshold model, though it is straight- forward to introduce them in a model with multiple thresholds. The elimination of the individual specific effect in Equation (3) with the standard fixed-effects transformation implies for the identification of slope co- efficients 1 and 2 that the elements of it are nei- ther time-invariant nor adding up to a vector of ones. This latter case applies to regime intercepts which are usually included in each regime in threshold models in pure cross-sectional or time-series contexts. Even in the presence of fixed-effects it is possible to control for dif- ferences in the regime intercepts by including them in all but one regime as in the following extension of Equation (3): 112it iititititit yxIq IqxIq (4) 2There is no reason to limit our analysis to just two regimes. Hence, the estimation approach proposed by [10] and extended by [14] allows a more general specification with K thresholds (i.e. K + 1 regimes). This formulation assumes that the difference in the re- gime intercepts, represented by 1 , is not individual Open Access ME  D. K. FIODENDJI, K. EVLO 685 specific but the same for all cross-sections. Since Equa- tion (4) has neither been considered by [10] nor any of the numerous studies, e.g. [17,18] or [19], applying his methodology, it seems worthwhile to briefly discuss the role of regime intercepts for the estimation results in the [10] framework. In case a regime intercept is included, as in specifica- tion (4), the slope estimates for each regime are identical to those from a regression using only observations from the respective regime which reflects the orthogonality of the regressors im xx and ii m Ix x. Omission of any variable correlated with at least one regressor and the dependent variable causes biased estimates, but re- gime intercepts are a particularly interesting case. First, the bias can be clearly interpreted. Estimating Equation (3) in the presence of a regime intercept in the data gen- erating process results in a bias proportional to 1 ˆ be- cause the orthogonality of the regressors is not preserved anymore. Second, availability of regime intercepts as regressors is not an issue since they are as easily con- structed as the regime-dependent exogenous regressors for a given threshold. Biased estimates of the regression slopes have further consequences in the panel threshold model because the threshold estimates are also obtained by least squares. Only by coincidence, these estimates will be the same for specifications (3) and (4) if a regime intercept is present in the data generating process. Moreover, unbiased esti- mates of 1 and 2 are crucial for the test of the sig- nificance of a threshold which is based on the null hy- pothesis of equality of the two coefficients. Eventually, the setup in [10] has to be extended to al- low for regime intercepts as in Equation (4). First, the null hypothesis to test for the significance of the thresh- old has to be extended by 10 . Second, the derivation of the asymptotic distribution of the threshold estimate now relies on the additional technical assumption that 10 as . It means that the difference in the intercepts between the two regimes is ‘small’ relative to sample size which is completely analogous to the assum- ption regarding the slope coefficients. Third, the proof in the appendix in [10] now relies on the following two expressions taking the regim regressor into account: N e intercept as an additional 21 1 and . it it zx C1 4. Empirical Analysis 4.1. The Variables The set of explanatory variables that constitute the vector it include; foreign aid as a percentage of GDP, policy index, the institutional quality index, investment as a percentage of GDP and human capital as a measured of secondary enrollment schools and initial income. The policy variables are openness, inflation and fiscal policy. Openness, a measure of international trade, is believed to affect growth through several channels, such as access to technology from abroad, greater access to a variety of inputs for production and access to broader markets that raise the efficiency of domestic production through increased specialization. There are various meas- ures of openness but in this paper, we use ratio of total trade to GDP. As suggested by [1], budget surplus as a percentage of GDP is included as a measure of fiscal policy. The budget surplus is believed to be an indicator of the stabilizing role of government. In line with [20] inflation is taken as a measure of monetary policy. 012 3 Policyfispolicy opensinf itititit it www w (5) where 0 the constant term is the country’s predicted growth rate for given values of budget surplus (fish- policy), trade openness w opens and the inflation rate inf assuming that it had the mean values of all other characteristics. The weights 12 and 3 are ob- tained from OLS regression of these variables on growth. The intuition is that the policy index should weight the policies according to their impact on growth. ,ww w The policy index is a measure of the quality of eco- nomic policy; the higher the index the higher the quality of economic policy. Obviously, countries with good eco- nomic policies tend to grow faster than countries with bad economic policy. The institutional quality index (ircg) is not a weighted average of the institutional variables3, but is obtained from OLS regression of corruption, ethnic tension, so- cioeconomic conditions, law and order, profile invest- ment and government stability. 01 234 56 icrgcorr ethnicssocioeclaw proinvgovstab itititit it itit it kk kkk kk (6) The institutional settings within which economic poli- cies are formulated are of crucial importance, because the quality of these institutions can be a primary source of the differences in economic growth among nations. Coun- tries with good institutions such as lower level of confis- cation of private properties, lower level of governmental corruption, lower ethnic tensions, and efficient profile investment are expected to grow faster than countries with bad institutions. Poor institutions interfere with economic growth by inducing economic agents to engage in redistributive politics rather economic activity with lower economic returns. The coefficient of institutional quality is expected to be positive. Another control variable included in equation is in- vestment and human capital. The level of investment is also included as a control variable. The investment/GDP ratio invest is used as a proxy for the growth rate of 3See Ali et al. (2009) for more details. Open Access ME  D. K. FIODENDJI, K. EVLO Open Access ME 686 Financial Statistics and the International Country Risk Guide (ICRG). the capital stock. Since the investment/GDP ratio is not reported for the majority of the ECOWAS countries, gross fixed capital formation as a share of GDP is used to represent investment/GDP ratio. The higher the invest- ment is, the higher the growth rate is. Therefore, we ex- pect a positive sign for the coefficient of investment. Human capital is Secondary School Enroll- ment Rate measures the percentage of school age popula- tion that was enrolled in secondary schools. Thus, the GDP growth rate is a positive function of education. We expect a positive sign for the coefficient of this variable. human We are able to identify the regime of the economy with respect to the macroeconomic policy environment and institutional quality which depend on the estimate of the policy index and institutional quality thresholds. Thus we can also investigate all combinations of those regimes. So we can distinguish between four different states as shown in Figure 2. Figure 2 displays the four states the donors can face when deciding about the aid in recipient countries. We have to use the threshold estimated olicy and institutions to determine the regime. We are able to dis- tinguish with this approach between a situation where the macroeconomic policy environment and institutional qua- lity are below olicy institutions (State I), the macroeco- nomic policy environment is below and institutional quality above olicy institutions and vice versa (States II and III), and a situation where both are above olicy institutions (State IV). We can therefore estimate for each case the aid impact on economic growth and compare those to each other. The key independent variable and the variable of in- terest is which is foreign aid expressed as per- centage of GDP. The aid variable used is the Effective Development Assistance (EDA), which measures official aid flows as the sum of grants and the grant equivalent of official loans. The grant equivalent of a financial inflow is the amount that, at the time of its commitment, is not expected to be repaid, i.e., the amount subsidized through below-market terms at the time of commitment. aid The initial income level (initial) measured as GDP per capita is included to verify the convergence hypothesis. The convergence hypothesis and the steady-state theory predicted in the neoclassical growth theory rests on the premise that countries are similar except for their starting GDP level. Therefore, poor countries are predicted to grow faster than rich countries. If this is true, we expect a negative sign for the coefficient of this variable. However, some differences are of special economic growth. Since when comparing States I and II it becomes obvious that only the sign of the institutional quality has changed while the macroeconomic policy environment remains negative (below the threshold value olicy ) in both cases. The same holds for the States III and IV where again only the macroeconomic policy environment re- mains positive (above the threshold value olicy ). The same argumentation applies when comparing States I and III with respect the negative sign of institutional quality (below the threshold value institutions ) or positive (above the threshold value institutions ). According to our analysis, we expect that the aid negatively affects growth in States I and III and has positive impact in States II and IV. 4.2. Data and Preliminary Analysis In this paper, we consider annual data from the ECOWAS countries which are collected from various sources and covered the period 1984 to 2010. Data are collected from the Penn World Table 6.1 and 6.2, World Development Indicators (WDI), the IMF’s International policy index State III State I State II State IV Institutional quality policy nsinstitutio Figure 2. The four states of the economy.  D. K. FIODENDJI, K. EVLO 687 Having constructed the data we can now separate them into the four states by simply introducing the threshold measures explained in Figure 2. The summary statistics of the different states together with those for each threshold and linear relationship be- tween aid and growth are given in Table 1. Several in- teresting insights can be drawn from Table 1. First, fol- lowing [10], each regime contains at least 5% of all ob- servations. So we have enough data points for each re- gime in order to get consistent estimates. Furthermore, for their combination given by the four states the same conclusion can be drawn. Second, the descriptive statis- tics show that the aid is lower if the policy environment and institutional quality are above their threshold values. This suggests that a stable macroeconomic policy envi- ronment and better institutional quality allow a little aid to improve economic grow. However, the aid is higher when the policy environment and institutional quality are below their threshold values. This implies that even they have more quantitative aid; its impact on growth is un- clear. Following, the four states, our statistics show that economic is highly efficient if the institutional quality achieves optimal value. Before conducting the regression investigation as pro- posed in the recent panel data econometric literature, we tested for possible unit roots in the panels. [10] panel Table 1. Descriptive statistics. Aid Policy index Institutional quality Linear <0.087 >=0.087 <1.880 >=1.880 <0.571 >=0.571 grow 0.007 0.005 0.010 0.007 0.004 0.000 0.017 grow 0.044 0.037 0.059 0.046 0.035 0.048 0.035 max grow 0.226 0.122 0.226 0.226 0.080 0.122 0.226 min grow −0.296 −0.191 −0.296 −0.296 −0.170 −0.296 −0.067 policy 1.794 1.811 1.750 1.758 1.934 1.768 1.839 olicy 0.898 0.658 1.294 0.862 0.264 1.039 0.466 max policy 2.056 2.004 2.056 1.880 2.056 2.007 2.056 min policy 0.040 0.858 0.040 0.040 1.882 0.040 1.363 institutions 0.539 0.550 0.511 0.536 0.554 0.496 0.615 institutions 0.074 0.072 0.074 0.076 0.066 0.054 0.032 max institutions 0.712 0.712 0.673 0.698 0.712 0.570 0.712 min institutions 0.325 0.325 0.353 0.325 0.395 0.325 0.571 aid 0.079 0.048 0.157 0.083 0.063 0.087 0.065 aid 0.068 0.024 0.080 0.069 0.061 0.077 0.045 max aid 0.525 0.086 0.525 0.525 0.319 0.525 0.241 min aid 0.001 0.001 0.087 0.001 0.001 0.001 0.001 invest 0.178 0.173 0.190 0.179 0.172 0.171 0.190 invest 0.062 0.052 0.081 0.064 0.049 0.065 0.054 max invest 0.484 0.310 0.848 0.484 0.310 0.484 0.310 min invest 0.035 0.035 0.067 0.035 0.087 0.035 0.067 income 5.898 6.023 5.579 5.840 6.139 5.809 6.053 income 0.492 0.479 0.364 0.476 0.484 0.496 0.444 max income 7.222 7.222 6.648 7.157 7.222 7.222 7.157 min income 4.878 4.878 4.935 4.878 5.352 4.878 5.217 human 0.220 0.247 0.149 0.207 0.271 0.188 0.275 human 0.119 0.121 0.082 0.118 0.109 0.099 0.132 max human 0.590 0.590 0.560 0.590 0.560 0.440 0.590 min human 0.030 0.030 0.050 0.030 0.040 0.030 0.060 N 351 252 99 283 68 223 128 Open Access ME  D. K. FIODENDJI, K. EVLO 688 Continued State 1 State II State III State IV grow −0.003 0.021 0.004 0.004 grow 0.049 0.037 0.043 0.019 max grow 0.122 0.226 0.080 0.038 min grow −0.296 −0.067 −0.170 −0.036 policy 1.726 1.813 1.940 1.924 olicy 0.990 0.377 0.234 0.293 max policy 1.876 1.880 2.007 2.056 min policy 0.040 1.363 1.882 1.885 institutions 0.493 0.614 0.508 0.620 institutions 0.057 0.030 0.035 0.038 max institutions 0.570 0.698 0.571 0.712 min institutions 0.325 0.571 0.395 0.579 aid 0.091 0.068 0.068 0.054 aid 0.078 0.045 0.070 0.046 max aid 0.525 0.241 0.319 0.179 min aid 0.001 0.001 0.001 0.015 invest. 0.171 0.193 0.168 0.179 invest. 0.069 0.053 0.046 0.053 max invest. 0.848 0.309 0.282 0.310 min invest. 0.035 0.067 0.087 0.096 income 5.731 6.041 6.168 6.097 income 0.443 0.472 0.572 0.326 max income 7.109 7.157 7.222 6.734 min income 4.878 5.217 5.352 5.601 human 0.179 0.259 0.230 0.330 human 0.102 0.130 0.071 0.127 max human 0.440 0.590 0.390 0.560 min human 0.030 0.060 0.040 0.180 N 183 100 40 28 Notes: stands for the mean of the respective variable, max and min for the maximum and minimum realization, while is the standard deviation, N = number of observations. threshold regression model is an extension of the tradi- tional least squared estimation method, in fact. It requires that variables considered in the model need to be station- ary in order to avoid the so-called spurious regression4. Since the stationarity properties of the variables are stud- ied, i.e. the examination of whether or not the variables appear to contain panel unit roots. Non-stationary panels have become extremely popular and have attracted much attention in both theoretical and empirical research over the last decade. A number of panel unit root tests have been proposed in the literature, in this research, we use [21-24] all based on a null hypothesis that a unit root exists in the panels. Indeed, the [21,22] panel unit root tests assume a homogeneous autoregressive unit root under the alternative hypothesis whereas [23] allows for a heterogeneous autoregressive unit root under the alter- native hypothesis. Fundamentally, the [23] test averages the individual augmented Dickey-Fuller (ADF) test sta- tistics. Both the [21,23] tests suffer from a dramatic loss of power when individual specific trends are included, which is due to the bias correction. However, the [22] 4Spurious regression is argued in Granger and Newbold (1974) that the estimation of the relationship among non-stationary series is easily getting higher R2 and t statistics. Open Access ME 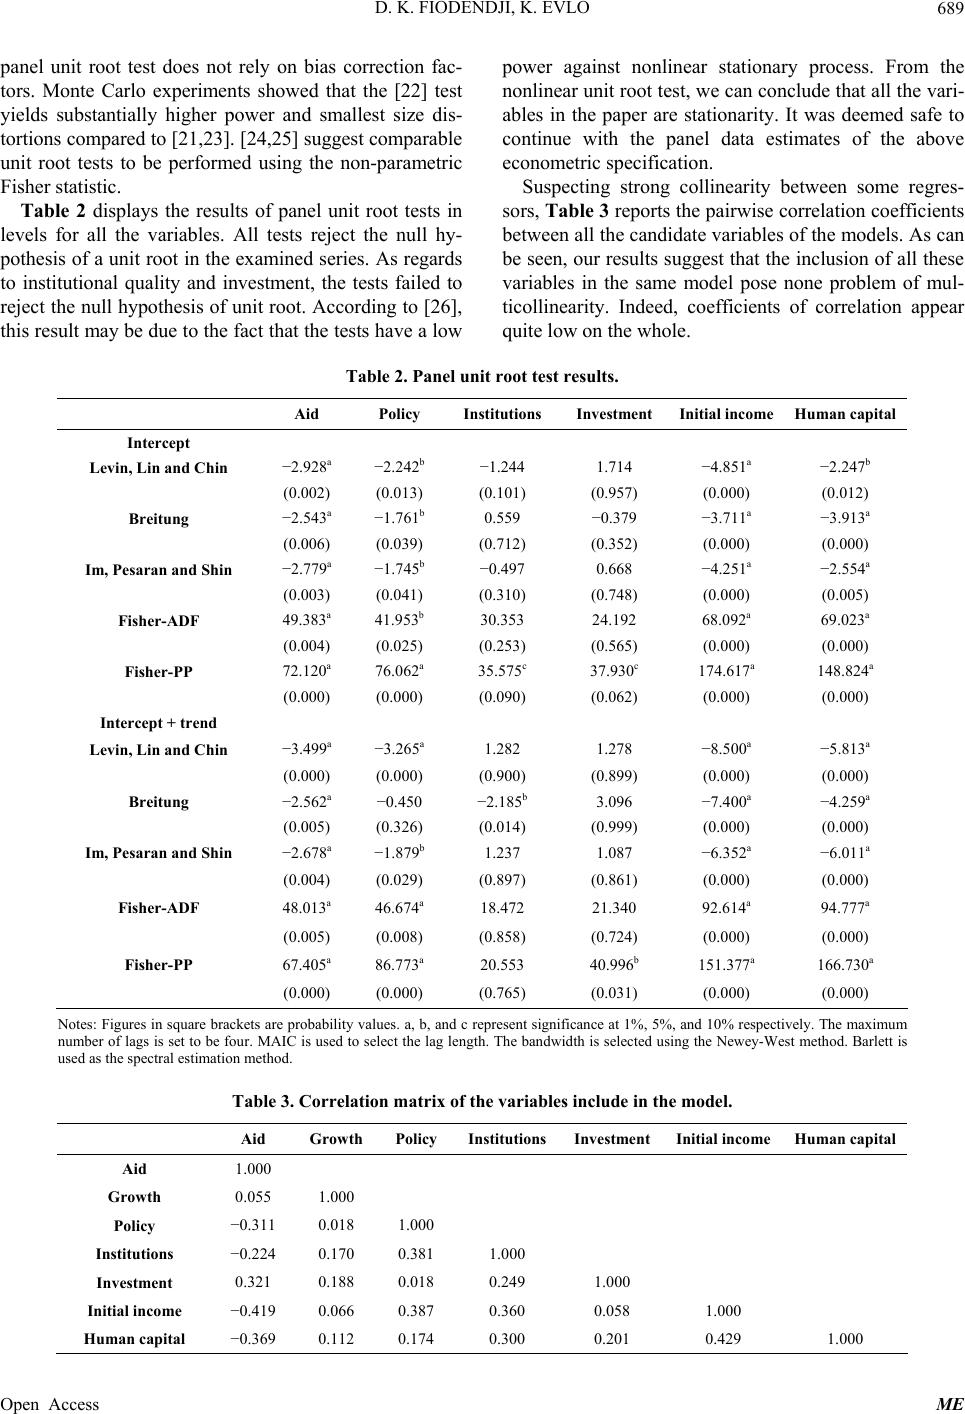 D. K. FIODENDJI, K. EVLO 689 panel unit root test does not rely on bias correction fac- tors. Monte Carlo experiments showed that the [22] test yields substantially higher power and smallest size dis- tortions compared to [21,23]. [24,25] suggest comparable unit root tests to be performed using the non-parametric Fisher statistic. Table 2 displays the results of panel unit root tests in levels for all the variables. All tests reject the null hy- pothesis of a unit root in the examined series. As regards to institutional quality and investment, the tests failed to reject the null hypothesis of unit root. According to [26], this result may be due to the fact that the tests have a low power against nonlinear stationary process. From the nonlinear unit root test, we can conclude that all the vari- ables in the paper are stationarity. It was deemed safe to continue with the panel data estimates of the above econometric specification. Suspecting strong collinearity between some regres- sors, Ta ble 3 reports the pairwise correlation coefficients between all the candidate variables of the models. As can be seen, our results suggest that the inclusion of all these variables in the same model pose none problem of mul- ticollinearity. Indeed, coefficients of correlation appear quite low on the whole. Table 2. Panel unit root test results. Aid Policy Institutions Investment Initial income Human capital Intercept Levin, Lin and Chin −2.928a −2.242b −1.244 1.714 −4.851a −2.247b (0.002) (0.013) (0.101) (0.957) (0.000) (0.012) Breitung −2.543a −1.761b 0.559 −0.379 −3.711a −3.913a (0.006) (0.039) (0.712) (0.352) (0.000) (0.000) Im, Pesaran and Shin −2.779a −1.745b −0.497 0.668 −4.251a −2.554a (0.003) (0.041) (0.310) (0.748) (0.000) (0.005) Fisher-ADF 49.383a 41.953b 30.353 24.192 68.092a 69.023a (0.004) (0.025) (0.253) (0.565) (0.000) (0.000) Fisher-PP 72.120a 76.062a 35.575c 37.930c 174.617a 148.824a (0.000) (0.000) (0.090) (0.062) (0.000) (0.000) Intercept + trend Levin, Lin and Chin −3.499a −3.265a 1.282 1.278 −8.500a −5.813a (0.000) (0.000) (0.900) (0.899) (0.000) (0.000) Breitung −2.562a −0.450 −2.185b 3.096 −7.400a −4.259a (0.005) (0.326) (0.014) (0.999) (0.000) (0.000) Im, Pesaran and Shin −2.678a −1.879b 1.237 1.087 −6.352a −6.011a (0.004) (0.029) (0.897) (0.861) (0.000) (0.000) Fisher-ADF 48.013a 46.674a 18.472 21.340 92.614a 94.777a (0.005) (0.008) (0.858) (0.724) (0.000) (0.000) Fisher-PP 67.405a 86.773a 20.553 40.996b 151.377a 166.730a (0.000) (0.000) (0.765) (0.031) (0.000) (0.000) Notes: Figures in square brackets are probability values. a, b, and c represent significance at 1%, 5%, and 10% respectively. The maximum number of lags is set to be four. MAIC is used to select the lag length. The bandwidth is selected using the Newey-West method. Barlett is used as the spectral estimation method. Table 3. Correlation matrix of the variables include in the model. Aid Growth Policy InstitutionsInvestmentInitial income Human capital Aid 1.000 Growth 0.055 1.000 Policy −0.311 0.018 1.000 Institutions −0.224 0.170 0.381 1.000 Investment 0.321 0.188 0.018 0.249 1.000 Initial income −0.419 0.066 0.387 0.360 0.058 1.000 Human capital −0.369 0.112 0.174 0.300 0.201 0.429 1.000 Open Access ME 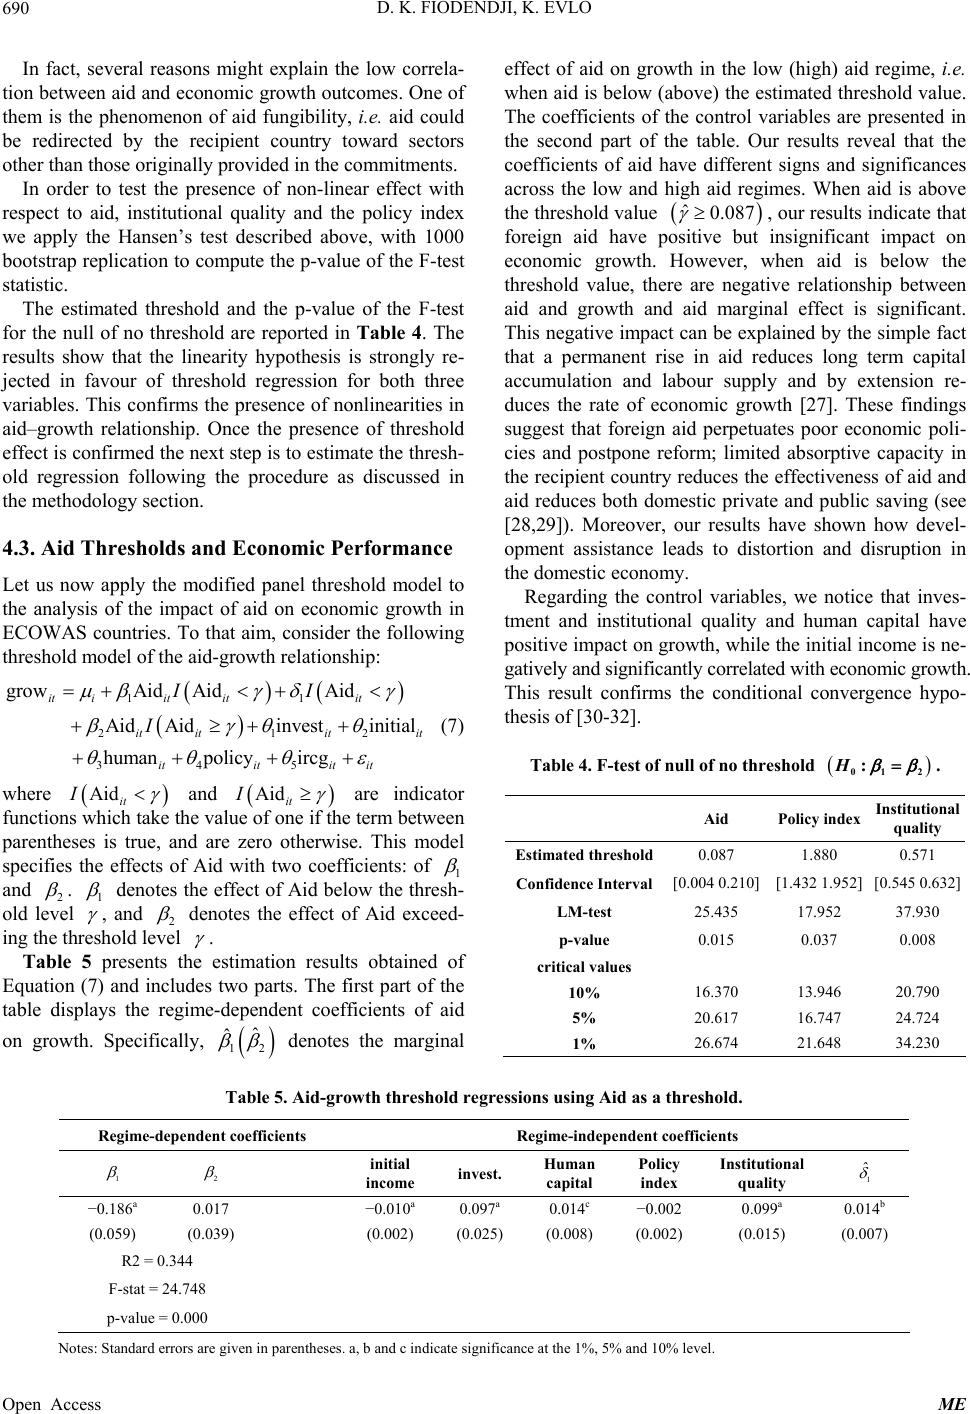 D. K. FIODENDJI, K. EVLO 690 In fact, several reasons might explain the low correla- tion between aid and economic growth outcomes. One of them is the phenomenon of aid fungibility, i.e. aid could be redirected by the recipient country toward sectors other than those originally provided in the commitments. In order to test the presence of non-linear effect with respect to aid, institutional quality and the policy index we apply the Hansen’s test described above, with 1000 bootstrap replication to compute the p-value of the F-test statistic. The estimated threshold and the p-value of the F-test for the null of no threshold are reported in Table 4. The results show that the linearity hypothesis is strongly re- jected in favour of threshold regression for both three variables. This confirms the presence of nonlinearities in aid–growth relationship. Once the presence of threshold effect is confirmed the next step is to estimate the thresh- old regression following the procedure as discussed in the methodology section. 4.3. Aid Thresholds and Economic Performance Let us now apply the modified panel threshold model to the analysis of the impact of aid on economic growth in ECOWAS countries. To that aim, consider the following threshold model of the aid-growth relationship: 11 21 345 growAid AidAid AidAidinvestinitial humanpolicy ircg it iititit it ititit ititit it II I 2 (7) where Aidit I and Aidit I are indicator functions which take the value of one if the term between parentheses is true, and are zero otherwise. This model specifies the effects of Aid with two coefficients: of 1 and 2 . 1 denotes the effect of Aid below the thresh- old level , and 2 denotes the effect of Aid exceed- ing the threshold level . Table 5 presents the estimation results obtained of Equation (7) and includes two parts. The first part of the table displays the regime-dependent coefficients of aid on growth. Specifically, 12 ˆˆ denotes the marginal effect of aid on growth in the low (high) aid regime, i.e. when aid is below (above) the estimated threshold value. The coefficients of the control variables are presented in the second part of the table. Our results reveal that the coefficients of aid have different signs and significances across the low and high aid regimes. When aid is above the threshold value ˆ0.087 , our results indicate that foreign aid have positive but insignificant impact on economic growth. However, when aid is below the threshold value, there are negative relationship between aid and growth and aid marginal effect is significant. This negative impact can be explained by the simple fact that a permanent rise in aid reduces long term capital accumulation and labour supply and by extension re- duces the rate of economic growth [27]. These findings suggest that foreign aid perpetuates poor economic poli- cies and postpone reform; limited absorptive capacity in the recipient country reduces the effectiveness of aid and aid reduces both domestic private and public saving (see [28,29]). Moreover, our results have shown how devel- opment assistance leads to distortion and disruption in the domestic economy. Regarding the control variables, we notice that inves- tment and institutional quality and human capital have positive impact on growth, while the initial income is ne- gatively and significantly correlated with economic growth. This result confirms the conditional convergence hypo- thesis of [30-32]. Table 4. F-test of null of no threshold 01 2 :H . Aid Policy index Institutional quality Estimated threshold0.087 1.880 0.571 Confidence Interval[0.004 0.210] [1.432 1.952] [0.545 0.632] LM-test 25.435 17.952 37.930 p-value 0.015 0.037 0.008 critical values 10% 16.370 13.946 20.790 5% 20.617 16.747 24.724 1% 26.674 21.648 34.230 Table 5. Aid-growth threshold regressions using Aid as a threshold. Regime-dependent coefficients Regime-independent coefficients 1 2 initial income invest. Human capital Policy index Institutional quality 1 ˆ −0.186a 0.017 −0.010a 0.097a 0.014c −0.002 0.099a 0.014b (0.059) (0.039) (0.002) (0.025) (0.008) (0.002) (0.015) (0.007) R2 = 0.344 F-stat = 24.748 p-value = 0.000 Notes: Standard errors are given in parentheses. a, b and c indicate significance at the 1%, 5% and 10% level. Open Access ME 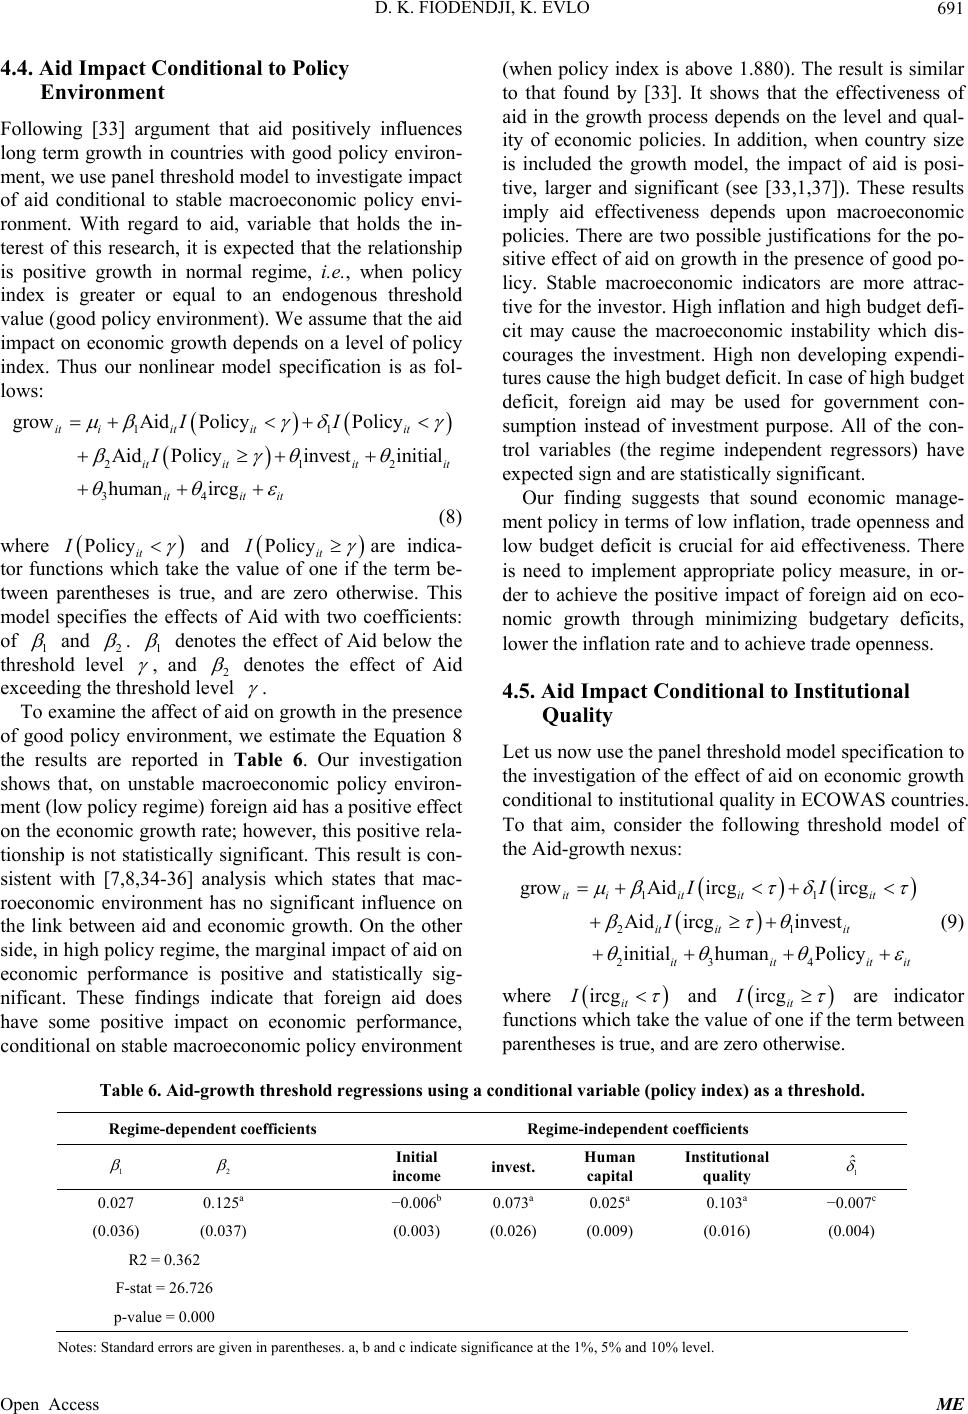 D. K. FIODENDJI, K. EVLO 691 4.4. Aid Impact Conditional to Policy Environment Following [33] argument that aid positively influences long term growth in countries with good policy environ- ment, we use panel threshold model to investigate impact of aid conditional to stable macroeconomic policy envi- ronment. With regard to aid, variable that holds the in- terest of this research, it is expected that the relationship is positive growth in normal regime, i.e., when policy index is greater or equal to an endogenous threshold value (good policy environment). We assume that the aid impact on economic growth depends on a level of policy index. Thus our nonlinear model specification is as fol- lows: 11 21 34 growAid PolicyPolicy AidPolicyinvestinitial humanircg it iititit it ititit itit it II I 2 (8) where Policyit I and Policyit I are indica- tor functions which take the value of one if the term be- tween parentheses is true, and are zero otherwise. This model specifies the effects of Aid with two coefficients: of 1 and 2 . 1 denotes the effect of Aid below the threshold level , and 2 denotes the effect of Aid exceeding the threshold level . To examine the affect of aid on growth in the presence of good policy environment, we estimate the Equation 8 the results are reported in Table 6. Our investigation shows that, on unstable macroeconomic policy environ- ment (low policy regime) foreign aid has a positive effect on the economic growth rate; however, this positive rela- tionship is not statistically significant. This result is con- sistent with [7,8,34-36] analysis which states that mac- roeconomic environment has no significant influence on the link between aid and economic growth. On the other side, in high policy regime, the marginal impact of aid on economic performance is positive and statistically sig- nificant. These findings indicate that foreign aid does have some positive impact on economic performance, conditional on stable macroeconomic policy environment (when policy index is above 1.880). The result is similar to that found by [33]. It shows that the effectiveness of aid in the growth process depends on the level and qual- ity of economic policies. In addition, when country size is included the growth model, the impact of aid is posi- tive, larger and significant (see [33,1,37]). These results imply aid effectiveness depends upon macroeconomic policies. There are two possible justifications for the po- sitive effect of aid on growth in the presence of good po- licy. Stable macroeconomic indicators are more attrac- tive for the investor. High inflation and high budget defi- cit may cause the macroeconomic instability which dis- courages the investment. High non developing expendi- tures cause the high budget deficit. In case of high budget deficit, foreign aid may be used for government con- sumption instead of investment purpose. All of the con- trol variables (the regime independent regressors) have expected sign and are statistically significant. Our finding suggests that sound economic manage- ment policy in terms of low inflation, trade openness and low budget deficit is crucial for aid effectiveness. There is need to implement appropriate policy measure, in or- der to achieve the positive impact of foreign aid on eco- nomic growth through minimizing budgetary deficits, lower the inflation rate and to achieve trade openness. 4.5. Aid Impact Conditional to Institutional Quality Let us now use the panel threshold model specification to the investigation of the effect of aid on economic growth conditional to institutional quality in ECOWAS countries. To that aim, consider the following threshold model of the Aid-growth nexus: 11 21 23 4 growAid ircgircg Aidircginvest initial humanPolicy it iititit it itit ititit it II I (9) where ircgit I and ircg it I are indicator functions which take the value of one if the term between parentheses is true, and are zero otherwise. Table 6. Aid-growth threshold reg ressions using a condi tional variable (policy index) as a threshold. Regime-dependent coefficients Regime-independent coefficients 1 2 Initial income invest. Human capital Institutional quality 1 ˆ 0.027 0.125a −0.006b 0.073a 0.025a 0.103a −0.007c (0.036) (0.037) (0.003) (0.026) (0.009) (0.016) (0.004) R2 = 0.362 F-stat = 26.726 p-value = 0.000 Notes: Standard errors are given in parentheses. a, b and c indicate significance at the 1%, 5% and 10% level. Open Access ME 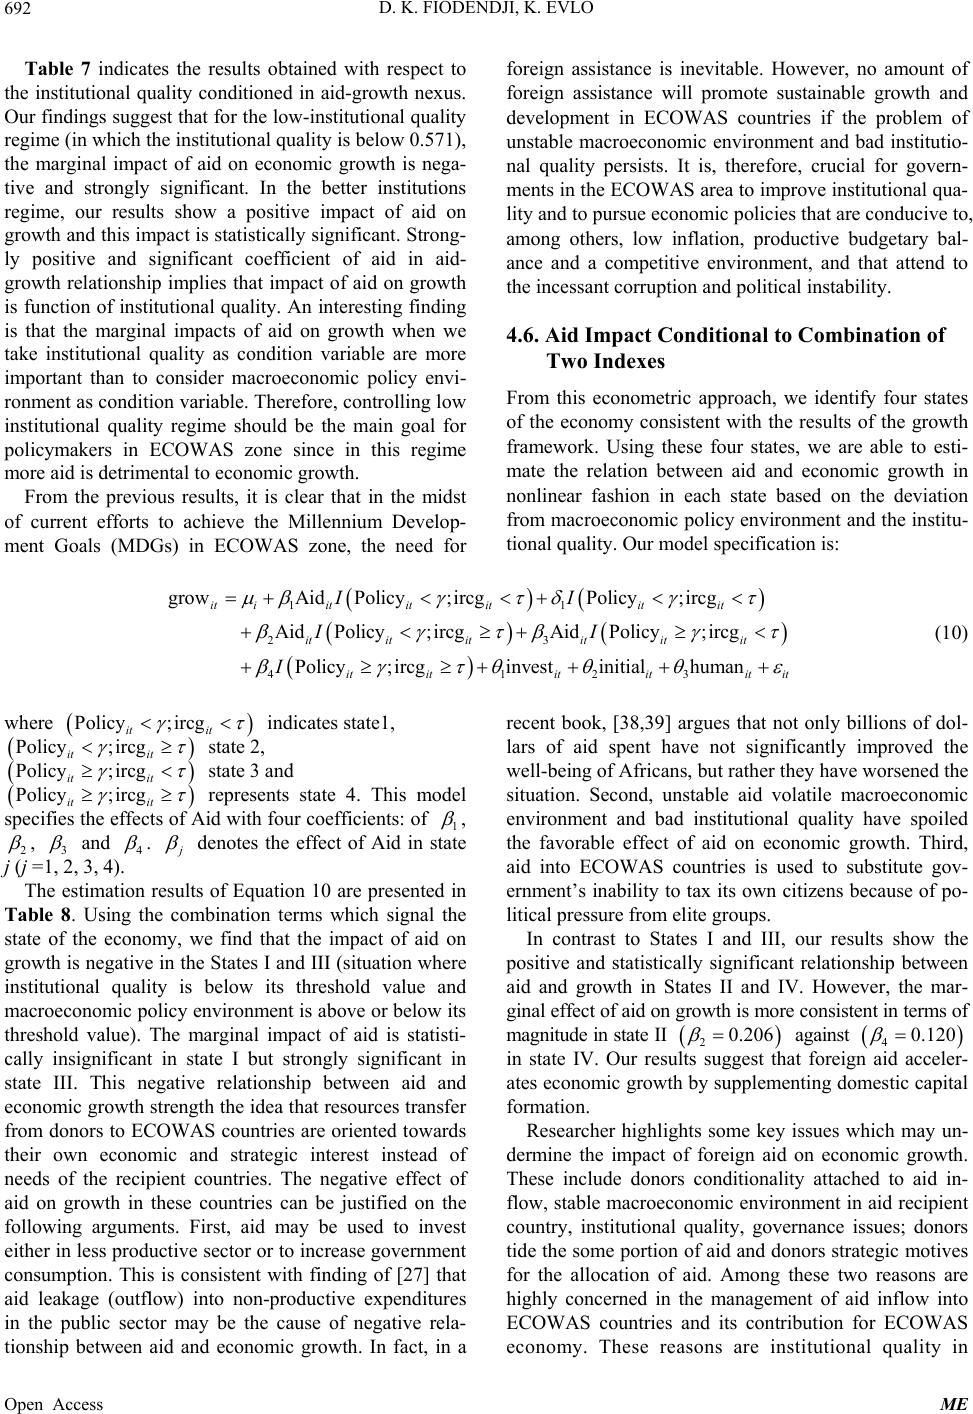 D. K. FIODENDJI, K. EVLO 692 Table 7 indicates the results obtained with respect to the institutional quality conditioned in aid-growth nexus. Our findings suggest that for the low-institutional quality regime (in which the institutional quality is below 0.571), the marginal impact of aid on economic growth is nega- tive and strongly significant. In the better institutions regime, our results show a positive impact of aid on growth and this impact is statistically significant. Strong- ly positive and significant coefficient of aid in aid- growth relationship implies that impact of aid on growth is function of institutional quality. An interesting finding is that the marginal impacts of aid on growth when we take institutional quality as condition variable are more important than to consider macroeconomic policy envi- ronment as condition variable. Therefore, controlling low institutional quality regime should be the main goal for policymakers in ECOWAS zone since in this regime more aid is detrimental to economic growth. From the previous results, it is clear that in the midst of current efforts to achieve the Millennium Develop- ment Goals (MDGs) in ECOWAS zone, the need for foreign assistance is inevitable. However, no amount of foreign assistance will promote sustainable growth and development in ECOWAS countries if the problem of unstable macroeconomic environment and bad institutio- nal quality persists. It is, therefore, crucial for govern- ments in the ECOWAS area to improve institutional qua- lity and to pursue economic policies that are conducive to, among others, low inflation, productive budgetary bal- ance and a competitive environment, and that attend to the incessant corruption and political instability. 4.6. Aid Impact Conditional to Combination of Two Indexes From this econometric approach, we identify four states of the economy consistent with the results of the growth framework. Using these four states, we are able to esti- mate the relation between aid and economic growth in nonlinear fashion in each state based on the deviation from macroeconomic policy environment and the institu- tional quality. Our model specification is: 11 23 4123 growAidPolicy ;ircgPolicy ;ircg AidPolicy ;ircgAidPolicy ;ircg Policy ;ircginvestinitialhuman itiititit itit it it itit it it ititititit it II II I (10) where Policy ;ircg it it y ;ircg it it indicates state1, Polic y ;ircg it it state 2, Polic y ;ircg it it state 3 and Polic represents state 4. This model specifies the effects of Aid with four coefficients: of 1 , 2 , 3 and 4 . denotes the effect of Aid in state j (j =1, 2, 3, 4). The estimation results of Equation 10 are presented in Table 8. Using the combination terms which signal the state of the economy, we find that the impact of aid on growth is negative in the States I and III (situation where institutional quality is below its threshold value and macroeconomic policy environment is above or below its threshold value). The marginal impact of aid is statisti- cally insignificant in state I but strongly significant in state III. This negative relationship between aid and economic growth strength the idea that resources transfer from donors to ECOWAS countries are oriented towards their own economic and strategic interest instead of needs of the recipient countries. The negative effect of aid on growth in these countries can be justified on the following arguments. First, aid may be used to invest either in less productive sector or to increase government consumption. This is consistent with finding of [27] that aid leakage (outflow) into non-productive expenditures in the public sector may be the cause of negative rela- recent book, [38,39] argues that not only billions of dol- lars of aid spent have not significantly improved the well-being of Africans, but rather they have worsened the situation. Second, unstable aid volatile macroeconomic environment and bad institutional quality have spoiled the favorable effect of aid on economic growth. Third, aid into ECOWAS countries is used to substitute gov- ernment’s inability to tax its own citizens because of po- litical pressure from elite groups. In contrast to States I and III, o tionship between aid and economic growth. In fact, in a ur results show the positive and statistically significant relationship between aid and growth in States II and IV. However, the mar- ginal effect of aid on growth is more consistent in terms of magnitude in state II 20.206 against 40.120 in state IV. Our resuat foreign ates economic growth by supplementing domestic capital formation. Research lts suggest th aid acceler- er highlights some key issues which may un- de economy. These reasons are institutional quality in rmine the impact of foreign aid on economic growth. These include donors conditionality attached to aid in- flow, stable macroeconomic environment in aid recipient country, institutional quality, governance issues; donors tide the some portion of aid and donors strategic motives for the allocation of aid. Among these two reasons are highly concerned in the management of aid inflow into ECOWAS countries and its contribution for ECOWAS Open Access ME 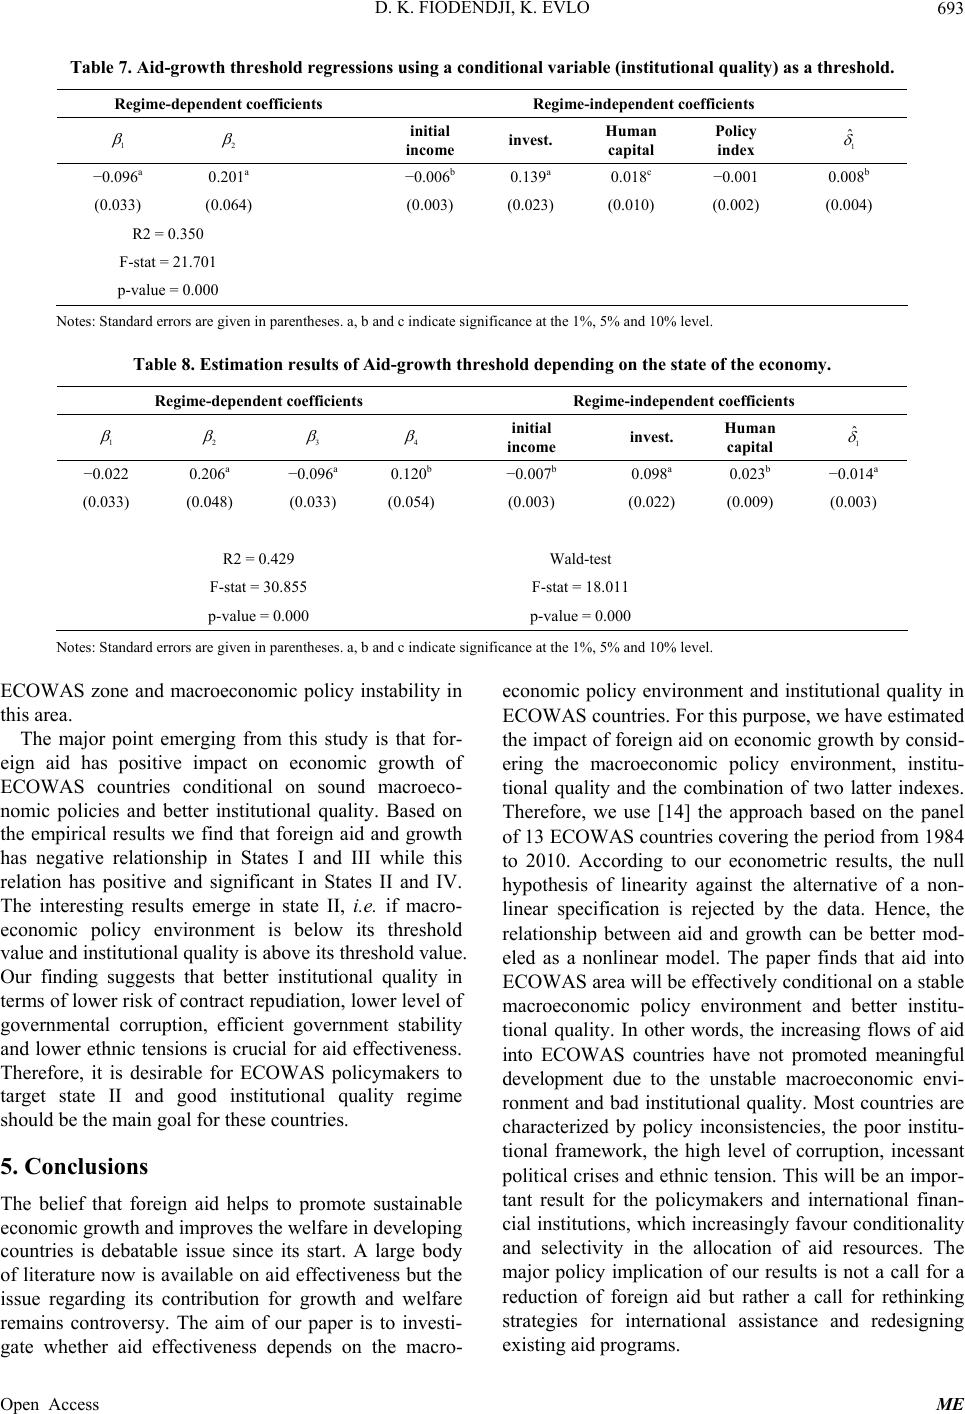 D. K. FIODENDJI, K. EVLO 693 Table 7. Aid-growth threshol d reg ressions using a condional variable (institutional quality) as a threshol d. ti Regime-dependent coefficients Regime-independent coefficients initial income inv Human Policy est. capital index 1 ˆ 1 2 −0.096a 0.20 a 0.00 b 1−0.006b 0.139a 0.018c −0.001 8 (0.033) (0.064) (0.023) (0.004) 2 = 0.350 p- (0.003) (0.010) (0.002) R F-stat = 21.701 value = 0.000 Notes: Stan in parentheses. a, b and c indicate significancet the 1%, 5% avel. the economy. ndard errors are give and 10% le Table 8. Estimation results of Aid-growth thre shold depending on the state of Regime-dependent coefficients Regime-independent coefficients initial income Human invest. capital 1 ˆ 1 2 3 4 −0.0 0.20a −0.096a 0.12 b −0.014a 22 60−0.007b 0.098a 0.023b (0.033) (0.048) (0.033) (0.054) (0.022) (0.003) = 0.42ald-test -stat = 30.855 -stat = 18.011 p-0 p- (0.003) (0.009) R29 W F F value = 0.00 value = 0.000 Notes: Standard errors arses. a, b and c indicate significancevel. ECOW is area. has positive impact on economic growth of EC ign aid helps to promote sustainable proves the welfare in developing nd institutional quality in ECOWAS countries. For this purpose, we have estimated e given in parenthe at the 1%, 5% and 10% le AS zone and macroeconomic policy instability in economic policy environment a th The major point emerging from this study is that for- eign aid OWAS countries conditional on sound macroeco- nomic policies and better institutional quality. Based on the empirical results we find that foreign aid and growth has negative relationship in States I and III while this relation has positive and significant in States II and IV. The interesting results emerge in state II, i.e. if macro- economic policy environment is below its threshold value and institutional quality is above its threshold value. Our finding suggests that better institutional quality in terms of lower risk of contract repudiation, lower level of governmental corruption, efficient government stability and lower ethnic tensions is crucial for aid effectiveness. Therefore, it is desirable for ECOWAS policymakers to target state II and good institutional quality regime should be the main goal for these countries. 5. Conclusions The belief that fore economic growth and im countries is debatable issue since its start. A large body of literature now is available on aid effectiveness but the issue regarding its contribution for growth and welfare remains controversy. The aim of our paper is to investi- gate whether aid effectiveness depends on the macro- the impact of foreign aid on economic growth by consid- ering the macroeconomic policy environment, institu- tional quality and the combination of two latter indexes. Therefore, we use [14] the approach based on the panel of 13 ECOWAS countries covering the period from 1984 to 2010. According to our econometric results, the null hypothesis of linearity against the alternative of a non- linear specification is rejected by the data. Hence, the relationship between aid and growth can be better mod- eled as a nonlinear model. The paper finds that aid into ECOWAS area will be effectively conditional on a stable macroeconomic policy environment and better institu- tional quality. In other words, the increasing flows of aid into ECOWAS countries have not promoted meaningful development due to the unstable macroeconomic envi- ronment and bad institutional quality. Most countries are characterized by policy inconsistencies, the poor institu- tional framework, the high level of corruption, incessant political crises and ethnic tension. This will be an impor- tant result for the policymakers and international finan- cial institutions, which increasingly favour conditionality and selectivity in the allocation of aid resources. The major policy implication of our results is not a call for a reduction of foreign aid but rather a call for rethinking strategies for international assistance and redesigning existing aid programs. Open Access ME 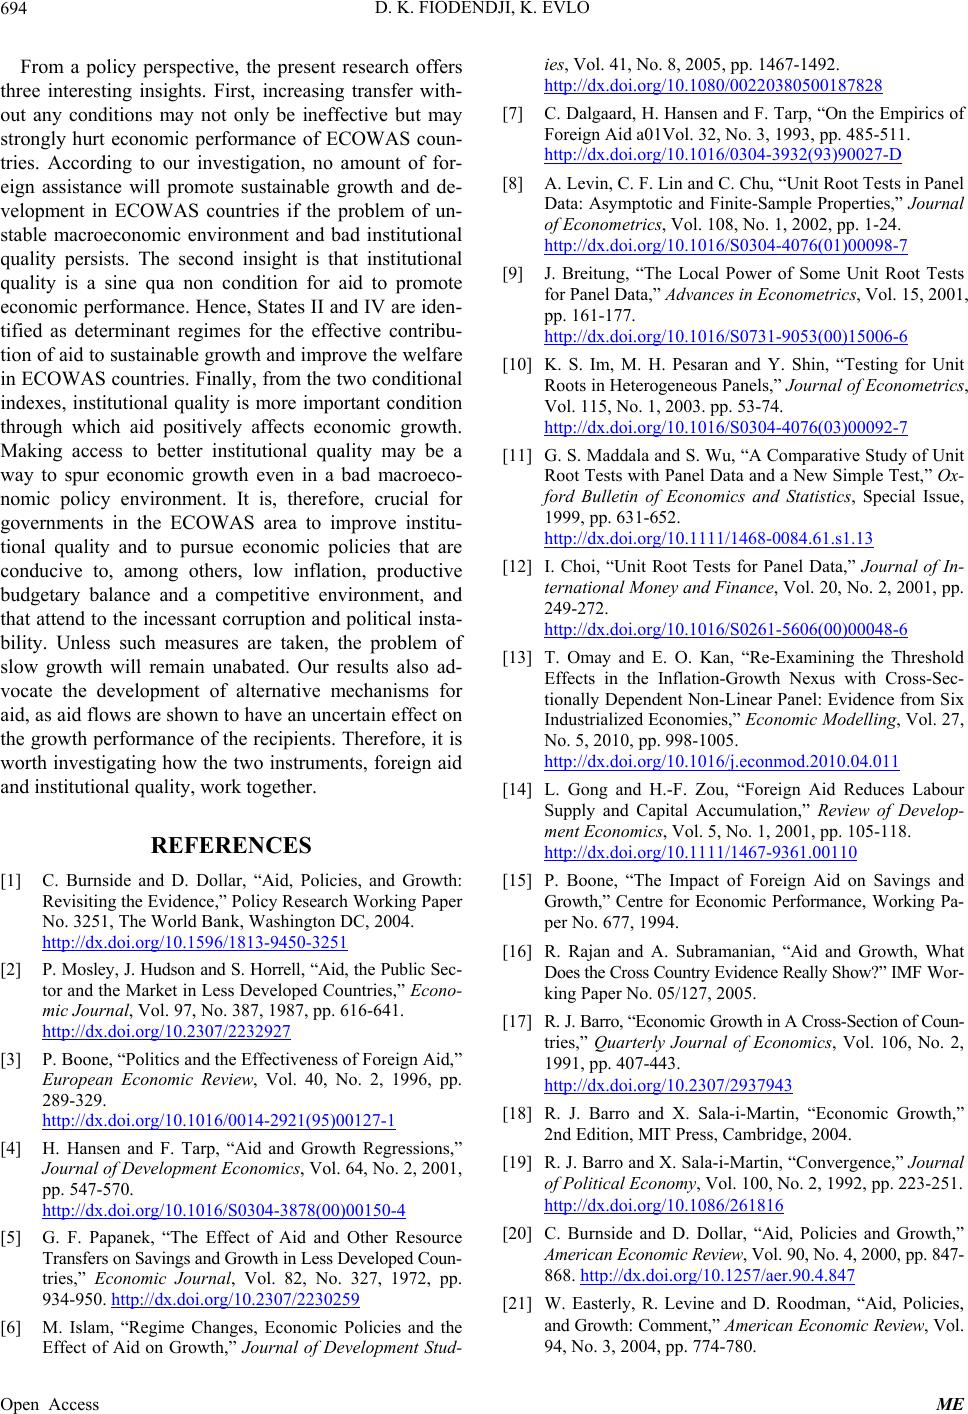 D. K. FIODENDJI, K. EVLO 694 From a policy perspective, the present research offers three interesting insights. First, increasing transfer with- out any conditions may not only be ineffective but may strongly hurt economic performance of ECOWAS co tri cies, and Growth: Working Paper No. 3251, The 04. http://dx.doi.o 51 un- es. According to our investigation, no amount of for- eign assistance will promote sustainable growth and de- velopment in ECOWAS countries if the problem of un- stable macroeconomic environment and bad institutional quality persists. The second insight is that institutional quality is a sine qua non condition for aid to promote economic performance. Hence, States II and IV are iden- tified as determinant regimes for the effective contribu- tion of aid to sustainable growth and improve the welfare in ECOWAS countries. Finally, from the two conditional indexes, institutional quality is more important condition through which aid positively affects economic growth. Making access to better institutional quality may be a way to spur economic growth even in a bad macroeco- nomic policy environment. It is, therefore, crucial for governments in the ECOWAS area to improve institu- tional quality and to pursue economic policies that are conducive to, among others, low inflation, productive budgetary balance and a competitive environment, and that attend to the incessant corruption and political insta- bility. Unless such measures are taken, the problem of slow growth will remain unabated. Our results also ad- vocate the development of alternative mechanisms for aid, as aid flows are shown to have an uncertain effect on the growth performance of the recipients. Therefore, it is worth investigating how the two instruments, foreign aid and institutional quality, work together. REFERENCES [1] C. Burnside and D. Dollar, “Aid, Poli Revisiting the Evidence,” Policy Research World Bank, Washington DC, 20 rg/10.1596/1813-9450-32 [2] P. Mosley, J. Hudson and S. Horrell, “Aid, the Public Sec- tor and the Market in Less Developed Countries,” Econo- mic Journal, Vol. 97, No. 387, 1987, pp. 616-641. http://dx.doi.org/10.2307/2232927 [3] P. Boone, “Politics and the Effectiveness of Foreign Aid,” European Economic Review, Vol. 40, No. 2, 1996, pp. 289-329. http://dx.doi.org/10.1016/0014-2921(95)00127-1 [4] H. Hansen and F. Tarp, “Aid and Growth Regressions,” Journal of Development Economics, Vol. 64, No. 2, 2001, pp. 547-570. http://dx.doi.org/10.1016/S0304-3878(00)00150-4 [5] G. F. Papanek, “The Effect of Aid and Other Resource Transfers on Savings and Growth in Less Developed Coun- tries,” Economic Journal, Vol. 82, No. 327, 1972, pp. 934-950. http://dx.doi.org/10.2307/2230259 [6] M. Islam, “Regime Changes, Economic Policies and the Effect of Aid on Growth,” Journal of Development Stud- ies, Vol. 41, No. 8, 2005, pp. 1467-1492. http://dx.doi.org/10.1080/00220380500187828 [7] C. Dalgaard, H. Hansen and F. Tarp, “On the Empirics of Foreign Aid a01Vol. 32, No. 3, 1993, pp. 485-511. http://dx.doi.org/10.1016/0304-3932(93)90027-D [8] A. Levin, C. F. Lin and C. Chu, “Unit Root Test Data: Asymptotic and Finite-Sample Properties, s in Panel ” Journal of Econometrics, Vol. 108, No. 1, 2002, pp. 1-24. http://dx.doi.org/10.1016/S0304-4076(01)00098-7 [9] J. Breitung, “The Local Power of Some Unit Root Tests for Panel Data,” Advances in Econometrics, Vol. 15, 2001, pp. 161-177. http://dx.doi.org/10.1016/S0731-9053(00)15006-6 [10] K. S. Im, M. H. Pesaran and Y. Shin, “Testing for Unit /10.1016/S0304-4076(03)00092-7 Roots in Heterogeneous Panels,” Journal of Econometrics, Vol. 115, No. 1, 2003. pp. 53-74. http://dx.doi.org [11] G. S. Maddala and S. Wu, “A Comparative Study of Unit Root Tests with Panel Data and a New Simple Test,” Ox- ford Bulletin of Economics and Statistics, Special Issue, 1999, pp. 631-652. http://dx.doi.org/10.1111/1468-0084.61.s1.13 [12] I. Choi, “Unit Root Tests for Panel Data,” Journal of In- ternational Money and Finance, Vol. 20, No. 2, 2001, pp. 249-272. http://dx.doi.org/10.1016/S0261-5606(00)00048-6 Threshold d Economies,” Economic Modelling, Vol. 27, [13] T. Omay and E. O. Kan, “Re-Examining the Effects in the Inflation-Growth Nexus with Cross-Sec- tionally Dependent Non-Linear Panel: Evidence from Six Industrialize No. 5, 2010, pp. 998-1005. http://dx.doi.org/10.1016/j.econmod.2010.04.011 [14] L. Gong and H.-F. Zou, “Foreign Aid Reduces Labour Supply and Capital Accumulation,” Review of Develop- ment Economics, Vol. 5, No. 1, 2001, pp. 105-118. http://dx.doi.org/10.1111/1467-9361.00110 hat ?” IMF Wor- urnal of Economics, Vol. 106, No. 2, [15] P. Boone, “The Impact of Foreign Aid on Savings and Growth,” Centre for Economic Performance, Working Pa- per No. 677, 1994. [16] R. Rajan and A. Subramanian, “Aid and Growth, W Does the Cross Country Evidence Really Show king Paper No. 05/127, 2005. [17] R. J. Barro, “Economic Growth in A Cross-Section of Coun- tries,” Quarterly Jo 1991, pp. 407-443. http://dx.doi.org/10.2307/2937943 [18] R. J. Barro and X. Sala-i-Martin, “Economic Growth,” 2, 1992, pp. 223-251. 2nd Edition, MIT Press, Cambridge, 2004. [19] R. J. Barro and X. Sala-i-Martin, “Convergence,” Journal of Political Economy, Vol. 100, No. http://dx.doi.org/10.1086/261816 [20] C. Burnside and D. Dollar, “Aid, Policies and Growth,” American Economic Review, Vol. 90, No. 4, 2000, pp. 847- 868. http://dx.doi.org/10.1257/aer.90.4.847 [21] W. Easterly, R. Levine and D. Roodman, “Aid, Policies, and Growth: Comment,” American Economic Review, Vol. 94, No. 3, 2004, pp. 774-780. Open Access ME  D. K. FIODENDJI, K. EVLO Open Access ME 695 http://dx.doi.org/10.1257/0002828041464560 [22] W. Easterly, R. Levine and D. Roodman, “New 74-780. Policy and s Bulletin, Vol o. 3, 2010, pp. 452-469. Data, [25] D. Moyo, “Dead Aid: Why Aid Is Not Working and How There Is a Better Way for Africa,” Farrar, Straus and Giroux, New York, 2009. New Doubts: A Comment on Burnside and Dollar’s ‘Aid, Policies, and Growth’ (2000),” American Economic Re- view, Vol. 94, No. 3, 2003, pp. 7 [23] R. G. Murphy and N. G. Tresp, “Government the Effectiveness of Foreign Aid,” Department of Eco- nomics, Boston College, Chestnut Hill, 2006. [24] E. Alvi, D. Mukherjee and E. K. Shukralla, “Foreign Aid, Growth, Policy and Reform,” Economic . 15, No. 6, 2006, pp. 1-9. [26] Y. M. Batana, “Aid and Poverty in Africa: Do Well-Be- ing Measures Understate the Progress?” African Devel- opment Review, Vol. 22, N http://dx.doi.org/10.1111/j.1467-8268.2010.00256.x
|