Creative Education
2013. Vol.4, No.11, 705-712
Published Online November 2013 in SciRes (http://www.scirp.org/journal/ce) http://dx.doi.org/10.4236/ce.2013.411100
Open Access 705
The Influence of Classroom Seating Position on Student Learning
Gains in Primary Schools in Kenya
Moses Waithanji Ngware1, James Ciera1,2, Peter K. Musyoka1, Moses Oketch1
1Education Research Program, African Population and Health Research Center, Nairobi, Kenya
2African Institute for Development Policy, Nairobi, Kenya
Email: mngware@aphrc.org, jmciera@yahoo.com, petmusyoka@yahoo.com, moketch@aphrc.org
Received September 18th, 2013; revised October 18th, 2013; accepted October 25th, 2013
Copyright © 2013 Moses Waithanji Ngware et al. This is an open access article distributed under the Creative
Commons Attribution License, which permits unrestricted use, distribution, and reproduction in any medium,
provided the original work is properly cited.
This paper examines the contribution of classroom students’ seating positions to learning gains. Data were
gathered from a sample of 1907 grade six students who sat for the same seat twice over an interval of
about 10 months. They were drawn from a random selection of 72 low and high performing primary
schools. Results of a multi-level regression show that seating in the front row in a classroom led to higher
learning gains of between 5 percent and 27 percent compared to seating in other rows that are farther
away from the chalkboard. The policy implication to education is that student’s seating position can be
manipulated in a way that it optimizes learning gains for slow learners.
Keywords: Classroom; Assessment; Learning; Seat; Teaching
Introduction
Teaching is a profession that requires specialized skills and
knowledge to impact significantly on student learning. One
factor associated with improved achievement among learners is
the position at which they sit in a classroom. For example, sev-
eral studies (Levine, O’Neal, Garwood, & McDonald, 1980;
Marx, Fuhrer, & Hartig, 2006; Siang, 1991; Tagliacollo, Vol-
pato, & Pereira Jr., 2010) have shown that those pupils who sit
in the front tend to be more active and have higher achievement
scores. These learners, therefore, have better interaction with
teachers and gain more from each lesson than those who sit at
the back of the classroom and are somewhat “hidden” from the
teacher (Marx et al., 2006). However, as the debate on quality
of education and opportunity to learn is becoming the primary
focus for many Sub-Sahara Africa (SSA) countries that have
made significant improvement on access to schooling, there is
the need to revisit this classroom seating position advantage.
Most studies on seat position in the classroom and how it in-
fluences learner achievement are to be found outside Africa.
But in spite of the limited literature on seat position in the
classroom in SSA, many countries have initiated Universal
Primary Education (UPE) programs that have led to improved
access to schooling, and in some cases to overcrowded class-
rooms. In an overcrowded classroom, seat position is critical as
it determines access to the learning resources and opportunities
inside the classroom.
Available literature shows that students who sit near the
chalkboard have better school performance compared to those
who sit far away from the chalkboard (Benedict & Hoag, 2004;
Perkins & Wieman, 2005). Teachers’ instructional space is near
the chalkboard and hence those seated in the front are more
likely to interact with their teachers. Seating at the back of the
class has been associated with problem behavior as well as low
grades (Perkins & Wieman, 2005). Earlier studies show that
teachers tend to direct more questions to students seated in the
front rows of the classroom (Juhary, 2012; Moore & Glynn,
1984). Students seated at the back interact more with each other,
in a disruptive way, thus minimizing their opportunity to learn
(Granstrom, 1996).
However, other studies have found no detrimental effects of
sitting at the back on learning achievement (see for example
Kalinowski, & Taper, 2007). According to Taglioacollo et al.
(2010), achievement has led teachers to move students closer to
the chalkboard with a view toward raising their grades, but that
outcome may not always be realized. Taglioacollo et al., (2010)
posit that motivation to learn is the mediating factor between
seat position and student academic achievement, and hence
there exists no direct effect of seat position on student academic
performance. Taglioacollo et al. concluded that students’ moti-
vation to learn is the main determinant of seat position. This
may not always be true, for instance, some teachers may assign
students to seats regardless of student preference.
The Milieu
In Kenya, the Free Primary Education (FPE) program was
introduced in 2003 and brought over one million children into
the public school system (Government of Kenya, 2005). Con-
sequently, class sizes of as many as 80 students exist in public
primary schools (Ngware, Oketch, & Ezeh, 2011). With a large
class size, seating position becomes an important determinant
of opportunity to learn, and it may influence student achieve-
ment (Tagliacollo et al., 2010). At the same time, public expec-
tations on teachers to produce better grades on examinations
remain high despite large class sizes.
M. W. NGWARE ET AL.
KCPE is a national standardized test that all students com-
pleting grade eight take. Their scores on that test are the major
determinant of the high school into which they are ultimately
enrolled. High scoring students gain admission to competitive
high schools. This raise their chances of scoring well on the
parallel standardized high school exams and, therefore, make it
more likely that they will earn one of the comparatively few
places available within the public and private university system.
KCPE is, therefore, a high-stake exam. Within the context of
FPE, there exist schools in the same neighborhood that persis-
tently perform well and others that persistently perform poorly
in standardized national examinations. Examining the students’
seating position will improve our understanding of what hap-
pens in the classroom that may explain some of the differences
in performance among pupils and schools. Teacher-classroom
interactions that aid student learning are often complex proc-
esses that hinge on interpersonal and pedagogical awareness.
The teacher’s classroom management strategies and interac-
tions with students at the classroom level can determine how
much is learned (Morrison, Bachman, & Connor, 2005).
In this paper, we examine the effects of seating position on
increases in student achievement at the classroom level. The
research question to be answered in this paper is “Does student
classroom seating positions explain learning gains?” By an-
swering this question, the paper contributes to the debate on
classroom environment and learning achievement. This paper
also contributes to filling the gap that exists in sub Saharan
Africa (SSA) on research evidence of what is happening in the
classroom.
Methods
Sampling
For the purpose of selecting the highest and lowest perform-
ing districts and schools, the Kenya Certificate of Primary Ex-
amination (KCPE) results of the last four available years (2002-
2005) were used to rank districts and schools. School perform-
ance in national examinations (a proxy indicator for student
achievement) in Kenya varies by district. Some districts persis-
tently score high, while other districts are repeatedly low per-
formers. Based on the distribution of school mean scores in a
district, schools were categorized as low performing and high
performing.
Six districts were randomly selected, two from those that
were consistently ranked in the bottom 10% in KCPE examina-
tions over the past 4 years, two from those that were consis-
tently ranked in the middle 20%, and another two from those
that were consistently ranked in the top 10% over the same
period. Seventy-two schools, 12 in each of the six districts,
were randomly selected for the study—six that consistently
rank in the bottom 20% and six that consistently rank in the top
20% in each of the districts. Data for this paper were collected
from 72 head teachers, 72 math teachers, and 1907 grade six
students who sat for the same math test, administered by the
study team, in rounds one and two.
To collect data, several instruments and techniques were
used. Three survey instruments and two assessment tools were
developed and pre-tested to improve the validity and reliability.
The three survey instruments include a head teacher question-
naire that solicited information on school management, staffing,
enrolment, and parental participation in school affairs among
others; a teacher questionnaire that solicited information on
demographics, qualification and training, discipline, and sylla-
bus coverage; a learner questionnaire that collected information
on social economic backgrounds of the grade six learners and
their perceptions of the school environment. This questionnaire
was administered to grade six students in the selected schools.
The assessment tools included a grade six mathematics teacher
test and a learner mathematics test for grade six students. The
return rates of the research instruments from the participants
were quite high; 100% for the head teachers, 97.6% for teachers,
and 99.8% for the students.
Variable Descriptions
In this paper, the dependent variable is gain score while the
main explanatory variable is student seating position. These
variables are defined as follows:
Gain score: The difference between pupil score in test (round)
one and two. Test one and two had the same test items but were
administered ten months apart. For the purposes of fitting a
regression model, Item Response Theory (IRT) scale proce-
dures were used to compute a gain score from the raw scores
for each student. We then computed gain scores from the IRT
scale scores by simply subtracting each student’s IRT mathe-
matics scale score in test one from their score in test two. This
gave us the IRT scale score points the students gained between
rounds one and two.
Seating position: In all schools, students sat in desks of three
or four. A few schools had lockers placed together in 2s, 3s, or
4s forming a set/group that fits in a column width. Seating posi-
tion was the classroom physical seat position occupied by the
student relative to the front of the classroom. The front of the
classroom was taken to be the side with the chalkboard. Student
seating position was allocated a three-digit number—i, j and k
for purposes of mapping the seat position of the student in the
classroom. For example, ijk meant ith row in the jth column,
student k. Rows were serialized from the front of the classroom.
The three digit number was recorded in the student’s assess-
ment tool.
Conceptualization
The paper uses a value-added approach to investigate the in-
fluence of quality of teaching and seating position on learning
gains. A value-added approach was chosen for two main fea-
tures. First, the dependent variable is designed to measure the
amount of change that occurs in learning (i.e. gain score) during
the period when students are in classroom. Second, measures of
change were adjusted for differences across classrooms in the
student’s prior achievement (entry behavior), students’ socio-
economic background, and other school factors (Harris & Sass,
2007; McCaffrey et al., 2004; Rowan, Correnti, & Miller,
2002). According to Rowan et al. (2002), the aim of a value-
added model is to approximate size of variance changes in stu-
dent learning achievement within classrooms after controlling
for the effects of other variables.
From this brief background, we conceptualize the effects of
seat position to be independent of that of other factors including
student characteristics, teacher factors, teaching quality and
school/classroom context. IRT-scale gain score is the dependent
variable, and IRT round one scores adjusts for initial academic
performance that can probably be the source of changes in
Open Access
706
M. W. NGWARE ET AL.
learning achievement. We carry out a two-level analysis (stu-
dent and school) that assumes classrooms and schools are the
same (one sixth grade teacher per school). Therefore, we use
cluster correction in STATA to correct standard errors in the
regression analyses.
We estimate a multi-level linear regression following the
value-addition models derived from a basic educational produc-
tion function (EPF). In theory, student learning achievement is
determined by an EPF:
AfH,I,S,α (1)
where achievement A is a product of home or social economic
background (H), individual characteristics (I), school resource
inputs (S), and an efficiency parameter measuring capacity
utilization in the school (α) (Marshall, 2009). This general EPF
does not specify effects levels of the determinants of learning
achievement. Showing the effects levels is relevant to policy
since it enhances the understanding of the learning achievement
dynamics. According to Glewwe (2002), if the independent
variables do not change much over time, the analysis of levels
will return similar results to that of a general EPF. Three mod-
els are estimated: 1) the overall model that includes all schools;
2) one model for the top performing schools; and, 3) one model
for the bottom performing schools.
The multivariate model assumes that all pupils have the same
or varying number of repeated IRT measurements taken at
identical points in time (Verbeke, & Molenberghs, 2000). In the
analysis, we consider the repeated IRT measurements for all the
students and schools computed from the same math test admin-
istered in rounds one and two, over an interval of ten months.
Let yij1 and yij2 be the IRT scores for round one and two for
the jth pupil in the ith school where j = 1, 2, … ni and i = 1,
2, … N. The two IRT scores can be grouped together in a vec-
tor 12
. The pupil’s scores in the ith school
can be clustered into a vector 12 i
iii in
i = 1,
2, … N. The general multivariate model assumes that the re-
peated measurements in satisfy a regression model given
by:
,
ijij ij
yy
y
i
ij
y
,,,


Yyy y
i
Y
ii
YXβε
, i = 1, 2, … N (2)
where i is a vector of error components and ε
~0,
iN
ε.
The response vector for the ith pupil i has a multivariate
normal density
Y
~,
ii
NYXβ, where β is a vector of fixed
effects and is the covariance matrix. Since the study has two
time points (rounds one and two), we adopt an unstructured
covariance matrix for the covariance structure . The unstruc-
tured covariance matrix offers the most generalized structure
that does not assume any prior knowledge of the relationship
between the variables of interest.
Results and Discussion
Descriptive Statistics
The mean score for the top performing schools was 0.645
and the bottom performing schools was 0.492. Overall, the
mean gain score for all schools was 0.582. On average, the top
schools gained more by 0.153 IRT gain scores, equivalent to a
gain of 31%. The IRT scores were distributed normally with the
highest peak at the mean. The gain score for the top schools
ranged between 2.1 to 4.0 while the range for the bottom
school was 2.1 to 2.8, an indication that top schools had
higher gain scores compared to the bottom schools.
Table 1 shows the mean, number of students, percentage of
students in each row, and the p-values (significance measures)
of a t-test that compares the gain score mean between row one
and each of the subsequent seating rows. Rows one and two
were at the front of the class, rows three and four were the mid-
dle of the class and rows five and six were at the back of the
class. On average, each of the first three class rows contained
about 18% of the pupils and the mean gain score varied be-
tween 0.524 and 0.687. It is evident that pupils who sat in row
one had the highest gain score. With an exception of row four
in both the overall sample and bottom schools, the rest of the
rows had significantly less mean gain score compared to row
one.
Appendix A shows the mean gain score based on student,
teacher, and other school characteristics. On student character-
istics, we computed the means depending on whether a student
had math tuition, the student’s gender and age, the student’s
household wealth index, number of times a student repeated
grade(s), student’s frequency in speaking English outside
school, and desk-group composition (girls, boys or mixed). On
teacher and school characteristics, we considered school rank,
frequency of the head teacher supervision, teacher’s highest
training level, gender, and teacher’s preparedness to teach.
From the descriptive results, it is evident that having math
tuition is associated with better gain score. Similarly, pupils
from the poor background significantly perform poorly relative
to those from wealthy families. Failure to speak English outside
school and having repeated a grade are related to lower gain
scores. However, student sex does not help improve the gain
score since the mean scores for both boys and girls are nearly
the same. For school characteristics, top schools performed
better than bottom schools as expected, while the head teachers’
supervision helped students achieve a higher gain. Desk-group
gender composition, teachers’ gender, training and prepared-
ness to teach were insignificantly correlated with students’
performance in math. Descriptive results suggest that students
taught by degree holders scored lower; however, these findings
may be a result of small sample size among teachers with de-
gree certificates, who represented 2% of the total number of
teachers in the sample.
Multi-Level Models
To investigate the effects of seating position on pupils’ gain
scores, we fitted a multi-level linear regression model while
controlling the clustering observed among students that belong
to the same class. From the analysis in Descriptive Statistics
Section, it was observed that top and bottom performing
schools scored differently; hence, we modeled the data for all
the sample schools, and then modeled data by school category
(top and bottom schools) separately. In each category (top,
bottom, and all schools combined), we fitted two multi-level
models. The first one is univariate while the second model is a
multiple linear regression. The first model fit the gain score
against our main explanatory variable—seating position. In the
second model we fitted the gain score against the main ex-
planatory variable while adjusting for the related student,
teacher, and school characteristics described in the literature as
influencing student achievement (Baumert et al., 2010; Georges,
Borman, & Lee, 2010; Goldschmidt & Phelps, 2010 ). The
regression results are as shown in the Appendixes B and C.
Open Access 707
M. W. NGWARE ET AL.
Table 1.
Mean IRT score gain based on seating position.
Seating row Mean IRT gain score (se) N % t-test p-value*
All schools
row 1 0.687 (0.035) 434 18.0 -
row 2 0.576 (0.035) 450 18.6 0.016
row 3 0.528 (0.033) 438 18.1 0.001
row 4 0.606 (0.035) 376 15.6 0.051
row 5 0.524 (0.044) 315 13.0 0.002
row 6+ 0.556 (0.038) 403 16.7 0.005
Top schools
row 1 0.707 (0.047) 236 17.14 -
row 2 0.691 (0.054) 247 17.94 0.017
row 3 0.496 (0.045) 251 18.23 0.001
row 4 0.715 (0.045) 227 16.49 0.040
row 5 0.603 (0.055) 195 14.16 0.002
row 6+ 0.667 (0.053) 221 16.05 0.007
Bottom schools
row 1 0.663 (0.052) 198 19.1 -
row 2 0.444 (0.050) 203 19.5 0.097
row 3 0.576 (0.049) 187 18.0 0.014
row 4 0.424 (0.050) 149 14.3 0.178
row 5 0.381 (0.070) 120 11.6 0.022
row 6+ 0.398 (0.048) 182 17.5 0.051
Note: *using row 1 as the comparison category.
To investigate the effect of the seating position on students’
gain score, we modeled the variable seat position alone, and
then fitted other models in which we controlled for individual
and school characteristics. The results show that students seated
in the first row perform better in comparison to students seated
in any other row. When we control for pupil and teacher char-
acteristics, students seated in the first row still had better per-
formance net of students’ academic ability. This is an indication
that seating in a front row is associated with higher math scores.
Modeling the two school categories separately helped us gain a
deeper understanding of the interaction of seat position and
school category. For example, descriptive analysis shows (see
Table 1) that in top schools, students seated in row one had
significantly higher mean scores than those seated in the other
rows. After controlling for other characteristics in the top
school model (see Appendix C), we find that seating in the
second row had a lesser effects on learning gains when com-
pared to seating in the first row. Further, seating in row three
significantly reduced the score gain. Seating in the other rows
led to a reduction in gain scores, though not significant (at α =
0.05). In bottom performing schools (Appendix C), the effect
of seating position is more pronounced. Univariate analysis
showed that with reference to the first row, seating in any other
row (except in row 4) significantly reduced the score gain. Af-
ter controlling for other student, teacher, and school character-
istics, the effect of seating position remains significant.
From these findings, we can argue that either higher achiev-
ers sit in the front row, and/or seating in the front row improves
learning gains. Since we controlled for initial academic ability
(test one scores), we conclude the latter. Kaya and Burgess
(2007), Martin (2002), and Thomas (2003), have examined
classroom seating arrangements and pupil’s in-class nonaca-
demic behavior. They found that seating position is important
because it has the potential to prevent the problem behaviors
that decrease student attention and probably this can diminish
opportunities to learn. Wannarka and Ruhl (2008) has sug-
gested that such problem behavior influences achievement.
Students seated in the front row have an advantage over stu-
dents in other rows because of their closeness to the teacher,
and they are engaged more during instruction. Such active en-
gagement leads to more learning opportunities and higher
learning gains. This line of argument has been supported by
Higgins et al. (2005) who observed that advanced involvement
between teacher and students occur across the front and down
the middle of the classroom. This implies that students in the
first row get more attention of the teacher during classroom
instructions which led to more learning gains. Our findings
contradict the results of Kalinowski and Taper (2007) who
found no detrimental effect of sitting at the back on learning
achievement among college students in Montana. However we
confirm the findings of Benedict and Hoag (2004), and Perkins
and Wieman (2005) in Bowling Green State University and
Colorado respectively; they found that seating in front has an
academic advantage.
We tested the relative importance of the seating position on
learning gains. We used the likelihood ratio test based on the
school sample dataset as well as the separate data for top and
bottom schools. For the entire school sample, seating position is
highly significant (chi-square = 19.75, p = 0.011). In top
schools, seating position is significant (chi-square = 32.24, p =
0.003). In the bottom schools seating position is not significant.
Other pupil-level variables in the model included score for
test one, desk-group score for test one, mathematics tuition,
pupil’s age, gender, household wealth index, frequency of
grade repetition, and the frequency with which the pupil spoke
English outside of school. Desk-group composition was used to
measure peer influence within the class. It referred to the gen-
der composition of pupils who sat at the same desk. Seat group
composition did not have any significant effect on score gain in
the top schools model. However, in the model for bottom
schools, boys only desk-groups performed marginally better
(15%) than girls only desk-groups. In top performing schools,
an increase in student teacher ratio (PTR) significantly lowers
the score gain by 1%.
Accounting for inter-class variability is an important aspect
when modeling multi-level data. Based on a scale of 0 to 1, the
estimated variability between school mean scores was 0.135
while the variability among students in the same school was
0.589. This indicates that the variability among students in the
same school is almost five times higher than the variability
between school mean scores. This suggests that variability is
pronounced more within a school than between schools. How-
ever, when we model the top and bottom performing schools
separately, the school-mean variability reduces dramatically, an
indication that the observed variability between schools is due
primarily to the school category (i.e. top or bottom performing
schools). These findings suggest that each of the top and bot-
tom school categories have homogenous school characteristics.
Conclusion
This study uses survey and assessment data from urban and
rural Kenyan primary schools to examine the effects of student
Open Access
708
M. W. NGWARE ET AL.
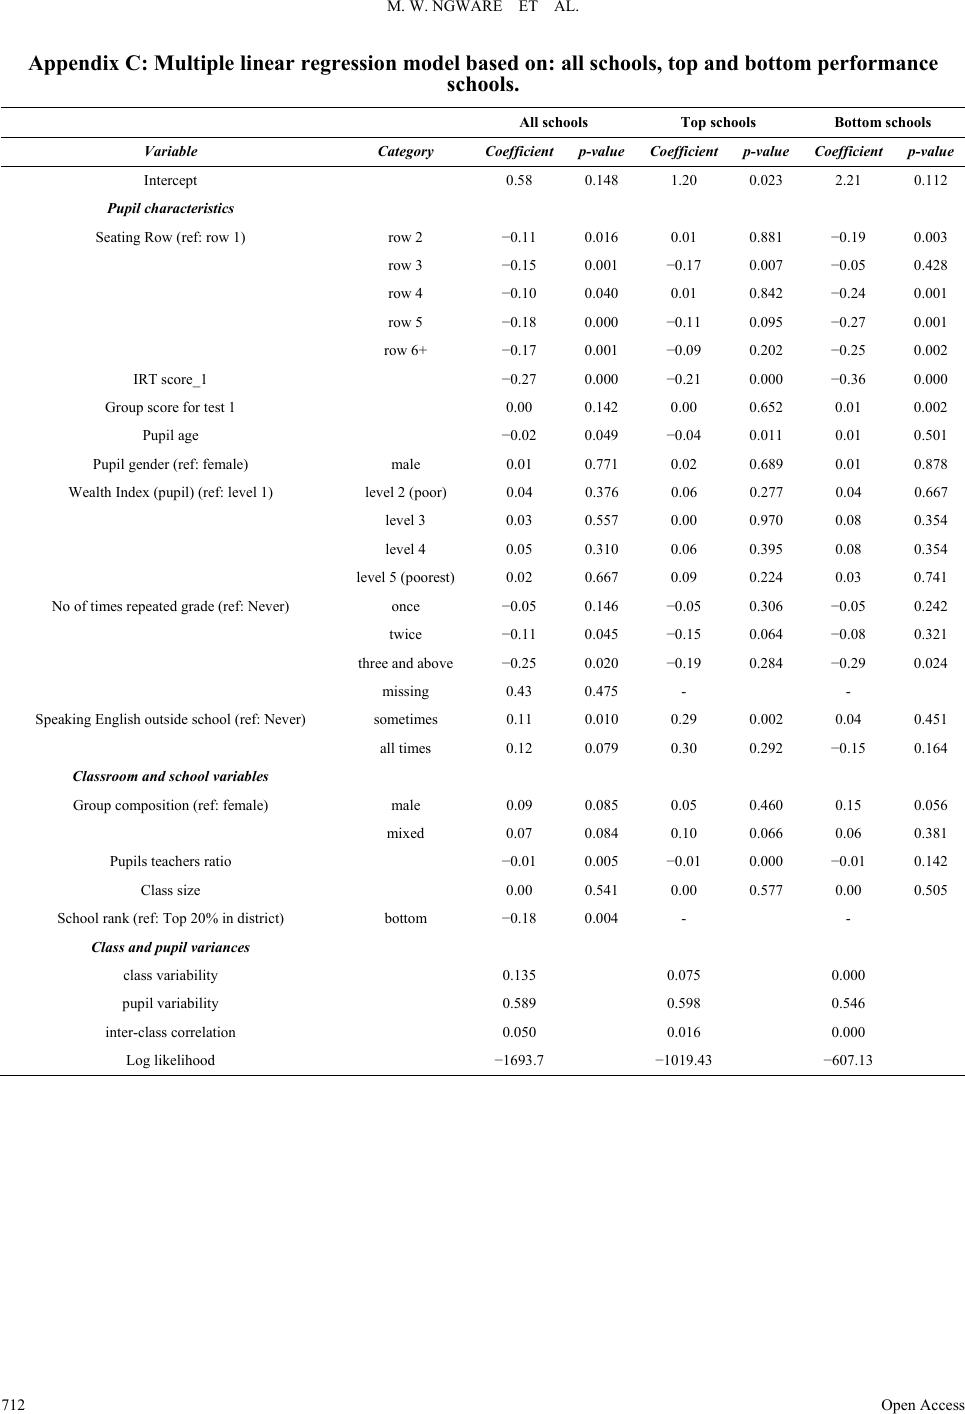
seating position on learning achievement gains. The study uses
gain score as the outcome variable to measure the amount of
learning that took place within an interval of 10 months, with
the same math test being administered twice. This rich data and
our analyses made it possible to generate scientific evidence
that we use to fill several existing gaps in the literature. For
example, extant literature on learning achievement in Kenya
has not used score gains as an outcome measure, and instead it
relies on test and national examination scores; there is no lit-
erature on Kenya that links seat position to learning gains.
The consideration of the student’s seat position relative to the
student’s academic ability in the Kenyan primary school class-
room deserves more attention. Our analysis shows that seating
in the front row has a positive and significant effect on learning
achievement. Our results corroborate what other studies outside
Kenya have found, though not using gain score.
The linkages between seating position and learner achieve-
ment have important implications for education policy and
classroom practices in Kenya. Teachers can change classroom
seating positions in a way that optimizes learning achievement
for every learner, since the seat position has the potential to
improve achievement gains. In particular, low performing
learners can improve their grades by seating at the front rows
especially in large class sizes. However, the teacher would have
to monitor the progress of those seated away from the front
rows, even if such students are high performers. That is, the
teachers should pay attention to the different seating rows for
the benefit of all students. Teacher preparation programs, both
in-service and pre-service, and teacher employers need to em-
phasize more on classroom environment. This paper shows how
our main explanatory variable predicts learning gains in schools
that are different academically. Although managing classroom
physical environments has the potential to address learning
differentials, different seating positions and arrangements
should be tested for their efficiency in instructional delivery
and effectiveness in improving learning outcomes among
learners with different academic ability.
Acknowledgements
We acknowledge the important contribution of the African
Population and Health Research Center (APHRC) staff who
participated at various stages of the development of this paper
including data collection and processing as well as giving valu-
able comments during the internal review process. We are also
grateful to our partners including the Ministry of Education for
providing us with introductory letters to the District Education
Officers and school head teachers. Funding for this study was
provided by Google.org through the Education Research Pro-
gram at APHRC. We are grateful to The William and Flora
Hewlett Foundation for their continued support. Finally, we are
grateful to the school principals, teachers, and learners who
participated in this study. The views presented in this paper are
only those of the authors and not necessarily shared by those
mentioned.
REFERENCES
Benedict, M. E., & Hoag, J. (2004). Seating location in large lectures:
Are seating preferences or location related to course performance?
Journal of Economic Education, 35, 215-231.
http://dx.doi.org/10.3200/JECE.35.3.215-231
Baumert, J., Kunter, M., Blum, W., Brunner, M., Voss, T., Jordan, A.,
et al. (2010). Teachers’ mathematical knowledge, cognitive activa-
tion in the classroom, and student progress. American Educational
Research Journal, 47, 371-406. http://aerj.aera.net
http://dx.doi.org/10.3102/0002831209345157
Georges, A., Borman, K. M., & Lee, R. S. (2010). Mathematics reform
and teacher quality in elementary grades: Assessments, teacher li-
censure, and certification. Educational Policy Analysis Archives, 18,
1-36. http://epaa.asu.edu/epaa/757
Glewwe, P. (2002). Schools and skills in developing countries: Educa-
tion policies and socioeconomic outcomes. Journal of Economic Lit-
erature, 40, 436-482.
http://dx.doi.org/10.1257/002205102320161258
Goldschmidt, P., & Phelps, G. (2010). Does teacher professional de-
velopment affect content and pedagogical knowledge: How much
and for how long? Economics of Education Review, 29, 432-439.
http://dx.doi.org/10.1016/j.econedurev.2009.10.002
Government of Kenya (2005). Education statistical booklet 1999-2004.
Nairobi: Ministry of Education Science and Technology.
Granstrom, K. (1996). Private communication between students in a
classroom in relation to different classroom features. Educational
Psychology, 16, 349-364.
http://dx.doi.org/10.1080/0144341960160401
Harris, D. N., & Sass, T. R. (2007). Teacher training, teacher quality
and student achievement. CALDER Working Paper No. 3.
http://www.caldercenter.org/PDF/1001059_Teacher_Training.pdf
Higgins, S., Hall, E., Wall, K., Woolner, P., & McCaughey, C. (2005).
The impact of school environments: A literature review. Callaghan,
NSW: University of Newcastle.
http://www.cfbt.com/PDF/91085.pdf
Juhary, J. (2012). An assigned seating arrangement based on students’
performance: A critical review. Journal of Education and Practice, 3.
(Online)
http://www.iiste.org/Journals/index.php/JEP/article/view/3414/3441
Kalinowski, S., & Taper, M. L. (2007). The effect of seat location on
exam grades and student perceptions in an introductory biology class.
Journal of College Science Teaching, 36, 54-57.
Kaya, N., & Burgess, B. (2007). Territoriality seat preferences in dif-
ferent types of classroom arrangements. Environment and Behaviour,
39, 859-879. http://eab.sagepub.com
http://dx.doi.org/10.1177/0013916506298798
Levine, D. W., O’Neal, E. C., Garwood, S. G., & McDonald, P. J.
(1980). Classroom ecology: The effects of seating position on grades
and participation. Personality and Social Psychology Bulletin, 6,
409-412. http://psp.sagepub.com/content/6/3/409.abstract
Marshall, J. H. (2009). School quality and learning gains in rural Gua-
temala. Economics of Education Review, 28, 207-216.
http://dx.doi.org/10.1016/j.econedurev.2007.10.009
Martin, S. H. (2002). The classroom environment and its effect on the
practice of teachers. Journal of Environmental Psychology, 22, 139-
156. http://dx.doi.org/10.1006/jevp.2001.0239
Marx, A., Fuhrer, U., & Hartig, T. (2006). Effects of classroom seating
arrangements on children’s question-asking. Learning Environment
Research, 2, 249-263. http://dx.doi.org/10.1023/A:1009901922191
McCaffrey, D. F., Lockwood, J. R., Koretz, D., Louis, T. A., & Hamil-
ton, L. (2004). Models for value-added modeling of teacher effects.
Journal of Educational and Behavioral Statistics, 29, 67-101.
http://dx.doi.org/10.3102/10769986029001067
Morrison, F. J., Bachman, H. J., & Connor, C. M. (2005). Improving
literacy in America: Guidelines from research. New Haven, CT:
Yale University Press.
Moore, D. W., & Glynn, T. (1984). Variations in question rate as a
function of position in the classroom. Educational Psychology, 4,
233-248. http://dx.doi.org/10.1080/0144341840040304
Ngware, M. W., Oketch, M., & Ezeh, A. C. (2011). Quality of primary
education inputs in urban schools: Evidence from Nairobi. Education
and Urban Society, 43, 91-116.
http://dx.doi.org/10.1177/0013124510379131
Perkins, K. K., & Wieman, C. (2005). The surprising impact of seat
location on student performance. The Physics Teacher, 43, 30-33.
http://dx.doi.org/10.1119/1.1845987
Open Access 709
M. W. NGWARE ET AL.
Open Access
710
Rowan, B., Correnti, R., & Miller, R. J. (2002). What large-scale, sur-
vey research tells us about teacher effects on student achievement:
Insights from the prospects study of elementary schools. Consortium
for Policy Research in Education, Research Report Series RR-051.
http://www.americancivil.literacy.org/sites/default/files/researchrepo
rt/791_rr51.pdf
Siang, T. K. (1991). The effects of seat location on students’ learning
behaviour in the classroom. Singapore Journal of Education, 11, 71-
75. http://dx.doi.org/10.1080/02188799108547675
Tagliacollo, V. A., Volpato, G. L., & Pereira Jr., A. (2010). Association
of student position in classroom and school performance. Educa-
tional Research, 1, 198-201.
http://interesjournal.org/ER/Abstracts/2010%20abstract/July/Tagliacoll
o%20et%20al.htm
Thomas, B. (2003). Take my chair (please). Chronicle of Higher Edu-
cation, 49, 36-38.
Verbeke, G., & Molenberghs, G. (2000). Linear mixed models for lon-
gitudinal data. New York: Springer,
Wannarka, R., & Ruhl, K. (2008). Seating arrangements that promote
positive academic and behavioural outcomes: A review of empirical
research. Support for Learning, 2 3, 89-93.
http://dx.doi.org/10.1111/j.1467-9604.2008.00375.x
M. W. NGWARE ET AL.
Appendix A: Mean IRT score gain based on pupil, teacher, and school characteristics.
Pupil characteristics School and teacher characteristics
Category Mean (se) %t-test
p-value
Mean (se) %t-test
p-value
no 0.550 (0.023) 44.3- Top 0.645 (0.020) 57.0-
Have math
tuition yes 0.611 (0.020) 55.40.023
School rank
Bottom 0.493 (0.021) 43.00.000
Pupil gender female 0.601 (0.022) 48.0- Female 0.560 (0.025) 32.2
male 0.565 (0.021) 52.00.126
Group
composition Male 0.553 (0.025) 35.60.577
Mixed 0.644 (0.028) 32.20.014
level 1 (poor) 0.655 (0.033) 20.1-
Wealth Index
level 2 0.627 (0.035) 20.00.280 Often 0.805 (0.040) 15.4-
level 3 0.565 (0.034) 19.70.029 sometimes 0.498 (0.028) 25.40.000
level 4 0.600 (0.031) 20.20.112 rarely 0.518 (0.037) 18.80.000
level 5 (poorest) 0.463 (0.035) 20.00.000
Head-teacher
supervision
frequency
never 0.581 (0.023) 40.20.000
Never 0.612 (0.022) 52.0- No education 0.640 (0.038) 17.1-
once 0.571 (0.024) 36.60.104 certificate 0.559 (0.018) 73.20.025
Twice 0.499 (0.044) 9.00.023 Diploma 0.736 (0.049) 7.50.066
Number of times
repeated grade
three and above 0.381 (0.103) 2.40.018
Teacher’s
highest
training level
Degree 0.337 (0.081) 2.20.005
Never 0.481 (0.041) 13.4-
Teachers’
gender female 0.647 (0.051) 47.0-
sometimes 0.595 (0.017) 79.60.005 male 0.575 (0.016) 53.00.421
Speaking English
outside school
all times 0.604 (0.062) 6.70.047 Teachers’
Preparedness inadequate 0.647(0.051) 10.6-
Adequate 0.575(0.016) 89.50.080
Appendix B: Univariate linear regression model based on all schools, top and bottom
performance schools.
All schools Top schools Bottom schools
Variable Category Coeff i cien t p-value Coefficien t p-value Coefficient p-value
Intercept 0.68 0.000 0.70 0.000 0.66 0.000
Pupil characteristics
Seating Row (ref: row 1) row 2 0.11 0.016 0.03 0.612 0.21 0.001
row 3 0.15 0.001 0.21 0.001 0.08 0.275
row 4 0.09 0.076 0.00 0.949 0.24 0.001
row 5 0.17 0.001 0.14 0.039 0.26 0.001
row 6 and above 0.18 0.001 0.16 0.025 0.25 0.001
Class and pupil variances
class variability 0.212 0.257 0.075
pupil variability 0.617 0.627 0.595
inter-class correlation 0.104 0.144 0.016
Log likelihood 1809.48 1097.10 714.69
Open Access 711
M. W. NGWARE ET AL.
Appendix C: Multiple linear regression model based on: all schools, top and bottom performance
schools.
All schools Top schools Bottom schools
Variable Category Coefficientp-valueCoefficientp-value Coefficientp-value
Intercept 0.58 0.148 1.20 0.023 2.21 0.112
Pupil characteristics
Seating Row (ref: row 1) row 2 0.11 0.016 0.01 0.881 0.19 0.003
row 3 0.15 0.001 0.17 0.007 0.05 0.428
row 4 0.10 0.040 0.01 0.842 0.24 0.001
row 5 0.18 0.000 0.11 0.095 0.27 0.001
row 6+ 0.17 0.001 0.09 0.202 0.25 0.002
IRT score_1 0.27 0.000 0.21 0.000 0.36 0.000
Group score for test 1 0.00 0.142 0.00 0.652 0.01 0.002
Pupil age 0.02 0.049 0.04 0.011 0.01 0.501
Pupil gender (ref: female) male 0.01 0.771 0.02 0.689 0.01 0.878
Wealth Index (pupil) (ref: level 1) level 2 (poor) 0.04 0.376 0.06 0.277 0.04 0.667
level 3 0.03 0.557 0.00 0.970 0.08 0.354
level 4 0.05 0.310 0.06 0.395 0.08 0.354
level 5 (poorest) 0.02 0.667 0.09 0.224 0.03 0.741
No of times repeated grade (ref: Never) once 0.05 0.146 0.05 0.306 0.05 0.242
twice 0.11 0.045 0.15 0.064 0.08 0.321
three and above 0.25 0.020 0.19 0.284 0.29 0.024
missing 0.43 0.475 - -
Speaking English outside school (ref: Never) sometimes 0.11 0.010 0.29 0.002 0.04 0.451
all times 0.12 0.079 0.30 0.292 0.15 0.164
Classroom and sch ool var ia bles
Group composition (ref: female) male 0.09 0.085 0.05 0.460 0.15 0.056
mixed 0.07 0.084 0.10 0.066 0.06 0.381
Pupils teachers ratio 0.01 0.005 0.01 0.000 0.01 0.142
Class size 0.00 0.541 0.00 0.577 0.00 0.505
School rank (ref: Top 20% in district) bottom 0.18 0.004 - -
Class and pupil variances
class variability 0.135 0.075 0.000
pupil variability 0.589 0.598 0.546
inter-class correlation 0.050 0.016 0.000
Log likelihood 1693.7 1019.43 607.13
Open Access
712