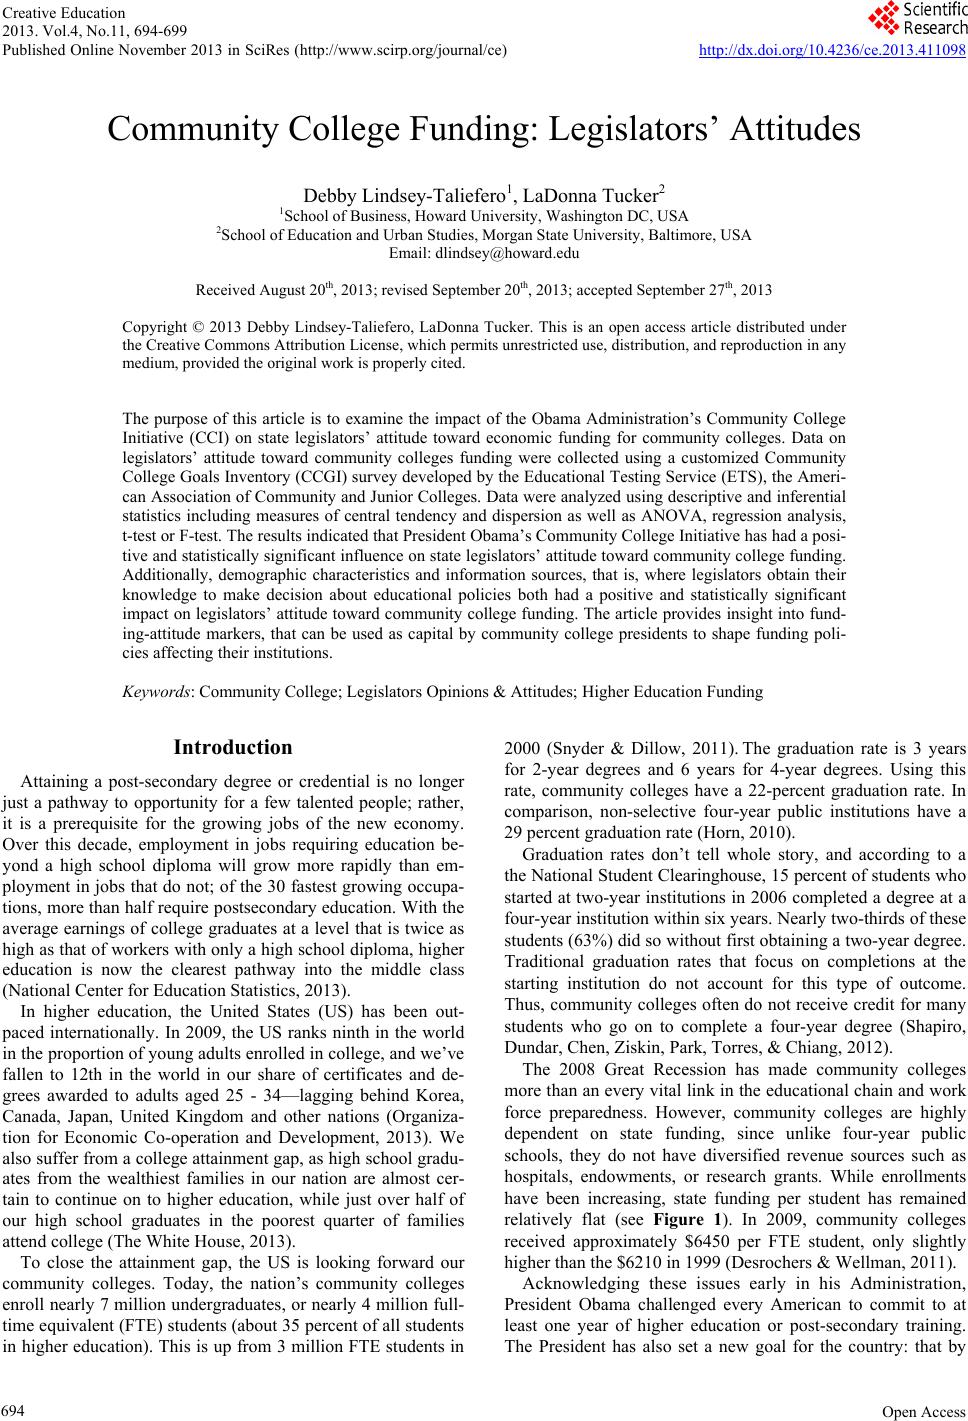
 Creative Education 2013. Vol.4, No.11, 694-699 Published Online November 2013 in SciRes (http://www.scirp.org/journal/ce) http://dx.doi.org/10.4236/ce.2013.411098 Open Access 694 Community College Funding: Legislators’ Attitudes Debby Lindsey-Taliefero1, LaDonna Tucker2 1School of Business, Howard University, Washington DC, USA 2School of Education and Urban Studies, Morgan State University, Baltimore, USA Email: dlindsey@howard.edu Received August 20th, 2013; revised September 20th, 2013; accepted September 27th, 2013 Copyright © 2013 Debby Lindsey-Taliefero, LaDonna Tucker. This is an open access article distributed under the Creative Commons Attribution License, which permits unrestricted use, distribution, and reproduction in any medium, provided the original work is properly cited. The purpose of this article is to examine the impact of the Obama Administration’s Community College Initiative (CCI) on state legislators’ attitude toward economic funding for community colleges. Data on legislators’ attitude toward community colleges funding were collected using a customized Community College Goals Inventory (CCGI) survey developed by the Educational Testing Service (ETS), the Ameri- can Association of Community and Junior Colleges. Data were analyzed using descriptive and inferential statistics including measures of central tendency and dispersion as well as ANOVA, regression analysis, t-test or F-test. The results indicated that President Obama’s Community College Initiative has had a posi- tive and statistically significant influence on state legislators’ attitude toward community college funding. Additionally, demographic characteristics and information sources, that is, where legislators obtain their knowledge to make decision about educational policies both had a positive and statistically significant impact on legislators’ attitude toward community college funding. The article provides insight into fund- ing-attitude markers, that can be used as capital by community college presidents to shape funding poli- cies affecting their institutions. Keywords: Community College; Legislators Opinions & Attitudes; Higher Education Funding Introduction Attaining a post-secondary degree or credential is no longer just a pathway to opportunity for a few talented people; rather, it is a prerequisite for the growing jobs of the new economy. Over this decade, employment in jobs requiring education be- yond a high school diploma will grow more rapidly than em- ployment in jobs that do not; of the 30 fastest growing occupa- tions, more than half require postsecondary education. With the average earnings of college graduates at a level that is twice as high as that of workers with only a high school diploma, higher education is now the clearest pathway into the middle class (National Center for Education Statistics, 2013). In higher education, the United States (US) has been out- paced internationally. In 2009, the US ranks ninth in the world in the proportion of young adults enrolled in college, and we’ve fallen to 12th in the world in our share of certificates and de- grees awarded to adults aged 25 - 34—lagging behind Korea, Canada, Japan, United Kingdom and other nations (Organiza- tion for Economic Co-operation and Development, 2013). We also suffer from a college attainment gap, as high school gradu- ates from the wealthiest families in our nation are almost cer- tain to continue on to higher education, while just over half of our high school graduates in the poorest quarter of families attend college (The White House, 2013). To close the attainment gap, the US is looking forward our community colleges. Today, the nation’s community colleges enroll nearly 7 million undergraduates, or nearly 4 million full- time equivalent (FTE) students (about 35 percent of all students in higher education). This is up from 3 million FTE students in 2000 (Snyder & Dillow, 2011). The graduation rate is 3 years for 2-year degrees and 6 years for 4-year degrees. Using this rate, community colleges have a 22-percent graduation rate. In comparison, non-selective four-year public institutions have a 29 percent graduation rate (Horn, 2010). Graduation rates don’t tell whole story, and according to a the National Student Clearinghouse, 15 percent of students who started at two-year institutions in 2006 completed a degree at a four-year institution within six years. Nearly two-thirds of these students (63%) did so without first obtaining a two-year degree. Traditional graduation rates that focus on completions at the starting institution do not account for this type of outcome. Thus, community colleges often do not receive credit for many students who go on to complete a four-year degree (Shapiro, Dundar, Chen, Ziskin, Park, Torres, & Chiang, 2012). The 2008 Great Recession has made community colleges more than an every vital link in the educational chain and work force preparedness. However, community colleges are highly dependent on state funding, since unlike four-year public schools, they do not have diversified revenue sources such as hospitals, endowments, or research grants. While enrollments have been increasing, state funding per student has remained relatively flat (see Figure 1). In 2009, community colleges received approximately $6450 per FTE student, only slightly higher than the $6210 in 1999 (Desrochers & Wellman, 2011). Acknowledging these issues early in his Administration, President Obama challenged every American to commit to at least one year of higher education or post-secondary training. The President has also set a new goal for the country: that by 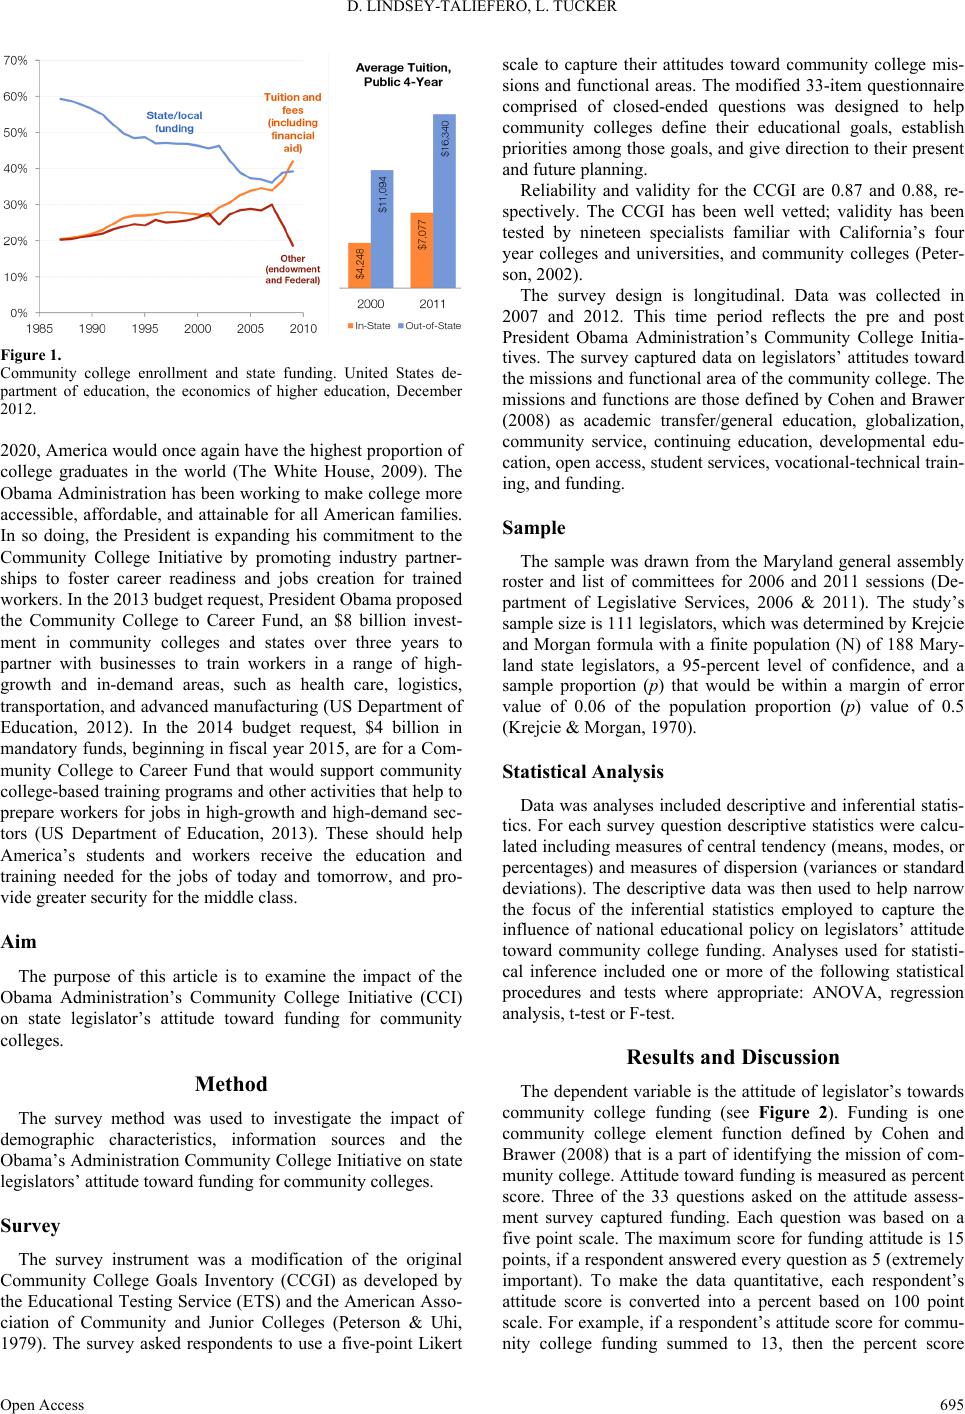 D. LINDSEY-TALIEFERO, L. TUCKER Figure 1. Community college enrollment and state funding. United States de- partment of education, the economics of higher education, December 2012. 2020, America would once again have the highest proportion of college graduates in the world (The White House, 2009). The Obama Administration has been working to make college more accessible, affordable, and attainable for all American families. In so doing, the President is expanding his commitment to the Community College Initiative by promoting industry partner- ships to foster career readiness and jobs creation for trained workers. In the 2013 budget request, President Obama proposed the Community College to Career Fund, an $8 billion invest- ment in community colleges and states over three years to partner with businesses to train workers in a range of high- growth and in-demand areas, such as health care, logistics, transportation, and advanced manufacturing (US Department of Education, 2012). In the 2014 budget request, $4 billion in mandatory funds, beginning in fiscal year 2015, are for a Com- munity College to Career Fund that would support community college-based training programs and other activities that help to prepare workers for jobs in high-growth and high-demand sec- tors (US Department of Education, 2013). These should help America’s students and workers receive the education and training needed for the jobs of today and tomorrow, and pro- vide greater security for the middle class. Aim The purpose of this article is to examine the impact of the Obama Administration’s Community College Initiative (CCI) on state legislator’s attitude toward funding for community colleges. Method The survey method was used to investigate the impact of demographic characteristics, information sources and the Obama’s Administration Community College Initiative on state legislators’ attitude toward funding for community colleges. Survey The survey instrument was a modification of the original Community College Goals Inventory (CCGI) as developed by the Educational Testing Service (ETS) and the American Asso- ciation of Community and Junior Colleges (Peterson & Uhi, 1979). The survey asked respondents to use a five-point Likert scale to capture their attitudes toward community college mis- sions and functional areas. The modified 33-item questionnaire comprised of closed-ended questions was designed to help community colleges define their educational goals, establish priorities among those goals, and give direction to their present and future planning. Reliability and validity for the CCGI are 0.87 and 0.88, re- spectively. The CCGI has been well vetted; validity has been tested by nineteen specialists familiar with California’s four year colleges and universities, and community colleges (Peter- son, 2002). The survey design is longitudinal. Data was collected in 2007 and 2012. This time period reflects the pre and post President Obama Administration’s Community College Initia- tives. The survey captured data on legislators’ attitudes toward the missions and functional area of the community college. The missions and functions are those defined by Cohen and Brawer (2008) as academic transfer/general education, globalization, community service, continuing education, developmental edu- cation, open access, student services, vocational-technical train- ing, and funding. Sample The sample was drawn from the Maryland general assembly roster and list of committees for 2006 and 2011 sessions (De- partment of Legislative Services, 2006 & 2011). The study’s sample size is 111 legislators, which was determined by Krejcie and Morgan formula with a finite population (N) of 188 Mary- land state legislators, a 95-percent level of confidence, and a sample proportion (p) that would be within a margin of error value of 0.06 of the population proportion (p) value of 0.5 (Krejcie & Morgan, 1970). Statistical Analysis Data was analyses included descriptive and inferential statis- tics. For each survey question descriptive statistics were calcu- lated including measures of central tendency (means, modes, or percentages) and measures of dispersion (variances or standard deviations). The descriptive data was then used to help narrow the focus of the inferential statistics employed to capture the influence of national educational policy on legislators’ attitude toward community college funding. Analyses used for statisti- cal inference included one or more of the following statistical procedures and tests where appropriate: ANOVA, regression analysis, t-test or F-test. Results and Discussion The dependent variable is the attitude of legislator’s towards community college funding (see Figure 2). Funding is one community college element function defined by Cohen and Brawer (2008) that is a part of identifying the mission of com- munity college. Attitude toward funding is measured as percent score. Three of the 33 questions asked on the attitude assess- ment survey captured funding. Each question was based on a five point scale. The maximum score for funding attitude is 15 points, if a respondent answered every question as 5 (extremely important). To make the data quantitative, each respondent’s attitude score is converted into a percent based on 100 point scale. For example, if a respondent’s attitude score for commu- nity college funding summed to 13, then the percent score Open Access 695 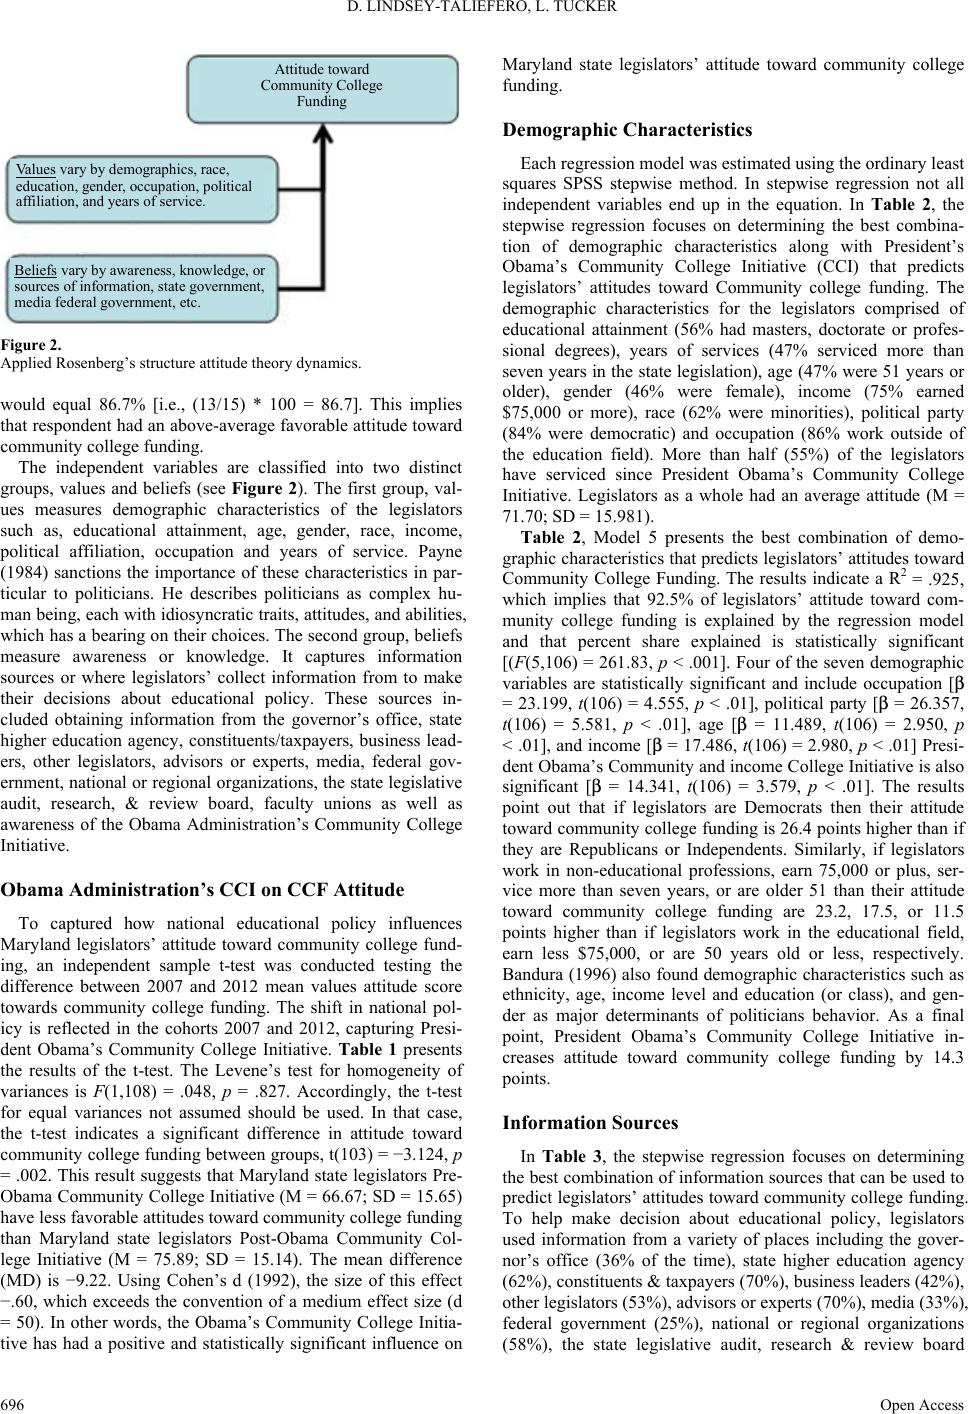 D. LINDSEY-TALIEFERO, L. TUCKER Attitude toward Community College Funding Va l u e s vary by demographics, race, education, gender, occupation, political affiliation, and years of service. Beliefs vary by awareness, knowledge, or sources of information, state government, media federal government, etc. Figure 2. Applied Rosenberg’s structure attitude theory dynamics. would equal 86.7% [i.e., (13/15) * 100 = 86.7]. This implies that respondent had an above-average favorable attitude toward community college funding. The independent variables are classified into two distinct groups, values and beliefs (see Figure 2). The first group, val- ues measures demographic characteristics of the legislators such as, educational attainment, age, gender, race, income, political affiliation, occupation and years of service. Payne (1984) sanctions the importance of these characteristics in par- ticular to politicians. He describes politicians as complex hu- man being, each with idiosyncratic traits, attitudes, and abilities, which has a bearing on their choices. The second group, beliefs measure awareness or knowledge. It captures information sources or where legislators’ collect information from to make their decisions about educational policy. These sources in- cluded obtaining information from the governor’s office, state higher education agency, constituents/taxpayers, business lead- ers, other legislators, advisors or experts, media, federal gov- ernment, national or regional organizations, the state legislative audit, research, & review board, faculty unions as well as awareness of the Obama Administration’s Community College Initiative. Obama Administration’s CCI on CCF At titude To captured how national educational policy influences Maryland legislators’ attitude toward community college fund- ing, an independent sample t-test was conducted testing the difference between 2007 and 2012 mean values attitude score towards community college funding. The shift in national pol- icy is reflected in the cohorts 2007 and 2012, capturing Presi- dent Obama’s Community College Initiative. Table 1 presents the results of the t-test. The Levene’s test for homogeneity of variances is F(1,108) = .048, p = .827. Accordingly, the t-test for equal variances not assumed should be used. In that case, the t-test indicates a significant difference in attitude toward community college funding between groups, t(103) = −3.124, p = .002. This result suggests that Maryland state legislators Pre- Obama Community College Initiative (M = 66.67; SD = 15.65) have less favorable attitudes toward community college funding than Maryland state legislators Post-Obama Community Col- lege Initiative (M = 75.89; SD = 15.14). The mean difference (MD) is −9.22. Using Cohen’s d (1992), the size of this effect −.60, which exceeds the convention of a medium effect size (d = 50). In other words, the Obama’s Community College Initia- tive has had a positive and statistically significant influence on Maryland state legislators’ attitude toward community college funding. Demographic Ch ar acteristics Each regression model was estimated using the ordinary least squares SPSS stepwise method. In stepwise regression not all independent variables end up in the equation. In Table 2, the stepwise regression focuses on determining the best combina- tion of demographic characteristics along with President’s Obama’s Community College Initiative (CCI) that predicts legislators’ attitudes toward Community college funding. The demographic characteristics for the legislators comprised of educational attainment (56% had masters, doctorate or profes- sional degrees), years of services (47% serviced more than seven years in the state legislation), age (47% were 51 years or older), gender (46% were female), income (75% earned $75,000 or more), race (62% were minorities), political party (84% were democratic) and occupation (86% work outside of the education field). More than half (55%) of the legislators have serviced since President Obama’s Community College Initiative. Legislators as a whole had an average attitude (M = 71.70; SD = 15.981). Table 2, Model 5 presents the best combination of demo- graphic characteristics that predicts legislators’ attitudes toward Community College Funding. The results indicate a R2 = .925, which implies that 92.5% of legislators’ attitude toward com- munity college funding is explained by the regression model and that percent share explained is statistically significant [(F(5,106) = 261.83, p < .001]. Four of the seven demographic variables are statistically significant and include occupation [β = 23.199, t(106) = 4.555, p < .01], political party [β = 26.357, t(106) = 5.581, p < .01], age [β = 11.489, t(106) = 2.950, p < .01], and income [β = 17.486, t(106) = 2.980, p < .01] Presi- dent Obama’s Community and income College Initiative is also significant [β = 14.341, t(106) = 3.579, p < .01]. The results point out that if legislators are Democrats then their attitude toward community college funding is 26.4 points higher than if they are Republicans or Independents. Similarly, if legislators work in non-educational professions, earn 75,000 or plus, ser- vice more than seven years, or are older 51 than their attitude toward community college funding are 23.2, 17.5, or 11.5 points higher than if legislators work in the educational field, earn less $75,000, or are 50 years old or less, respectively. Bandura (1996) also found demographic characteristics such as ethnicity, age, income level and education (or class), and gen- der as major determinants of politicians behavior. As a final point, President Obama’s Community College Initiative in- creases attitude toward community college funding by 14.3 points. Information Sources In Table 3, the stepwise regression focuses on determining the best combination of information sources that can be used to predict legislators’ attitudes toward community college funding. To help make decision about educational policy, legislators used information from a variety of places including the gover- nor’s office (36% of the time), state higher education agency (62%), constituents & taxpayers (70%), business leaders (42%), other legislators (53%), advisors or experts (70%), media (33%), federal government (25%), national or regional organizations (58%), the state legislative audit, research & review board Open Access 696  D. LINDSEY-TALIEFERO, L. TUCKER Open Access 697 Table 1. Independent samples t-test for equality of mean funding attitudes—pre and post Obama Community College Initiative. Group Stat is tics Year N Mean Std. Deviation Std. Error Mean Pre-Obama’s Community College Initiative 50 66.67 15.649 2.213 Attitude toward Community College Funding (CCF) Post-Obama’s Community College Initiative60 75.89 15.137 1.954 Independent Samples Test Levene’s Test for Equality of Variances t-test for Equality of Means F Sig. t df Sig. (2-tailed)Mean Difference Std. Error Difference Attitude toward Community College Funding (CCF) Equal variances assumed .048 .827 −3.133108.002 −9.222 2.943 Equal variances not assumed −3.124103.002 −9.222 2.952 Table 2. Predicting attitudes toward community college funding with demo- graphic characteristicsa,b. Unstandardized Coefficients Model β Std. Error t Sig. 1 Occupationc 72.404 3.100 23.358 .000 2 Occupationd 39.923 4.515 8.843 .000 Political Party 38.880 4.567 8.513 .000 3 Occupatione 37.360 4.331 8.626 .000 Political Party 33.998 4.523 7.516 .000 Age 15.069 4.091 3.683 .000 4 Occupationf 30.441 4.639 6.562 .000 Political Party 32.853 4.341 7.568 .000 Age 14.206 3.923 3.622 .000 Obama_CCI 13.760 4.147 3.318 .001 5 Occupationg 23.199 5.093 4.555 .000 Political Party 26.357 4.722 5.581 .000 Age 11.489 3.894 2.950 .004 Obama_CCI 14.341 4.007 3.579 .001 Income 17.486 5.867 2.980 .004 Note: aDependent variable: attitude toward community college funding. bLinear regression through the origin. cR2 = .832, SEE = 30.213, F(1,110) = 545.59, p < .001. dR2 = .899, SEE = 23.522, F(2,109) = 486.28, p < .001. eR2 = .910, SEE = 22.274, F(3,108) = 366.08, p < .001. fR2 = .919, SEE = 21.308, F(4,107) = 302.76, p < .001. gR2 = .925, SEE = 20.564, F(5,106) = 261.83, p < .001. (65%) and faculty unions (24%). Table 3, Model 5 presents the best blend of information sources that can be used to predict legislators’ attitudes toward community college funding. The results indicate that R2 = .879 which implies that 87.9% of legislators’ attitude toward com- munity college funding is explained by the regression model and that percent share explained is statistically significant [(F(5,106) = 153.723, p < .001]. Four of the eleven information sources are statistically significant and include advisors or ex- perts [β = 26.333, t(106) = 5.172, p < .01], state higher educa- tion agency [β = 16.287, t(106) = 2.882, p < .01], media [β = Table 3. Predicting attitudes toward community college funding with informa- tion sourcesa,b. Unstandardized Coefficients Model β Std. Error t Sig. 1Advisors or Expertsc 73.336 4.827 15.194.000 2Advisors or Expertsd 51.359 4.361 11.777.000 Obama_CCI 44.445 4.847 9.169 .000 3Advisors or Expertse 35.280 4.868 7.247 .000 Obama_CCI 38.948 4.426 8.799 .000 State Higher_Ed Agency27.847 5.098 5.463 .000 4Advisors or Expertsf 32.093 4.759 6.744 .000 Obama_CCI 37.963 4.247 8.939 .000 State Higher_Ed Agency24.032 5.014 4.793 .000 Media 18.052 5.470 3.300 .001 5Advisors or Expertsg 26.333 5.091 5.172 .000 Obama_CCI 37.472 4.131 9.071 .000 State Higher_Ed Agency16.287 5.652 2.882 .005 Media 17.986 5.316 3.384 .001 State Legislative Audit, Research or Review Board15.405 5.696 2.705 .008 Note: aDependent variable: attitude toward community college funding. bLinear regression through the origin. cR2 = .667, SEE = 41.901, F(1,110) = 230.853, p < .001. dR2 = .818, SEE = 31.627, F(2,109) = 244.643, p < .001. eR2 = .857, SEE = 28.124, F(3,108) = 216.196, p < .001. fR2 = .870, SEE = 26.918, F(4,107) = 179.717, p < .001. gR2 = .879, SEE = 26.158, F(5,106) = 153.723, p < .001. 17.989, t(106) = 3.384, p < .01] and the state legislative audit, research & review board [β = 15.405, t(106) = 2.705, p < .01]. President Obama’s Community College Initiative is also sig- nificant [β = 37.472, t(106) = 9.071, p < .01]. The results show that legislators who obtain their information data from their advisor or experts in the field of education have more favorable attitudes toward community college funding by 26.3 points. Similarly, if legislators used information sources from the state higher education agency, the media or the state legislative audit, the research & review board increases their attitude toward community college funding by 16.287, 17.986, and 15.405 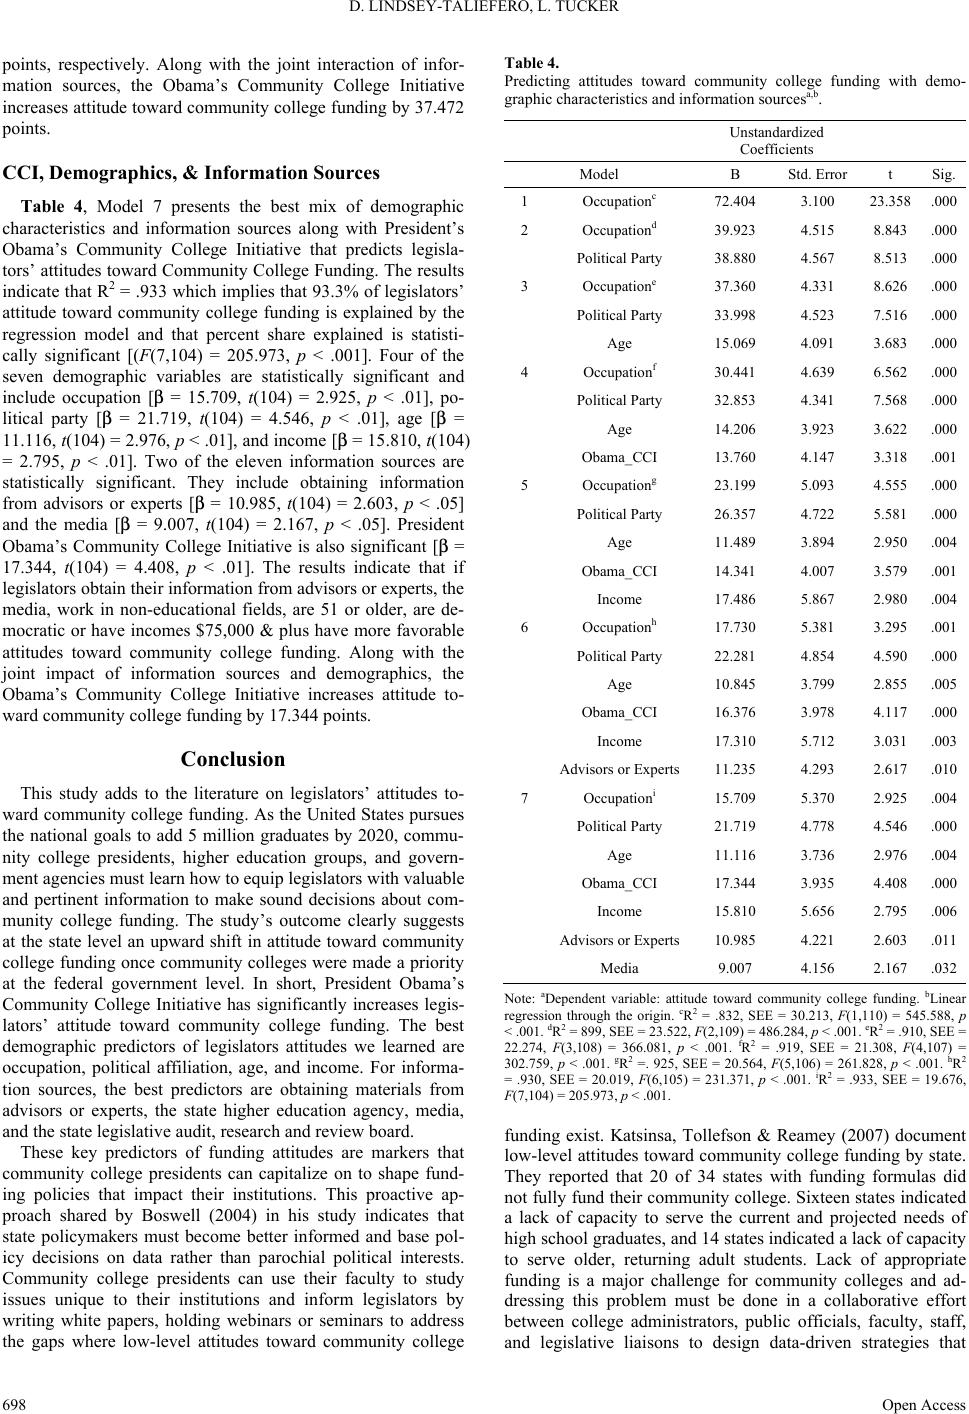 D. LINDSEY-TALIEFERO, L. TUCKER points, respectively. Along with the joint interaction of infor- mation sources, the Obama’s Community College Initiative increases attitude toward community college funding by 37.472 points. CCI, Demographics, & Information Sources Table 4, Model 7 presents the best mix of demographic characteristics and information sources along with President’s Obama’s Community College Initiative that predicts legisla- tors’ attitudes toward Community College Funding. The results indicate that R2 = .933 which implies that 93.3% of legislators’ attitude toward community college funding is explained by the regression model and that percent share explained is statisti- cally significant [(F(7,104) = 205.973, p < .001]. Four of the seven demographic variables are statistically significant and include occupation [β = 15.709, t(104) = 2.925, p < .01], po- litical party [β = 21.719, t(104) = 4.546, p < .01], age [β = 11.116, t(104) = 2.976, p < .01], and income [β = 15.810, t(104) = 2.795, p < .01]. Two of the eleven information sources are statistically significant. They include obtaining information from advisors or experts [β = 10.985, t(104) = 2.603, p < .05] and the media [β = 9.007, t(104) = 2.167, p < .05]. President Obama’s Community College Initiative is also significant [β = 17.344, t(104) = 4.408, p < .01]. The results indicate that if legislators obtain their information from advisors or experts, the media, work in non-educational fields, are 51 or older, are de- mocratic or have incomes $75,000 & plus have more favorable attitudes toward community college funding. Along with the joint impact of information sources and demographics, the Obama’s Community College Initiative increases attitude to- ward community college funding by 17.344 points. Conclusion This study adds to the literature on legislators’ attitudes to- ward community college funding. As the United States pursues the national goals to add 5 million graduates by 2020, commu- nity college presidents, higher education groups, and govern- ment agencies must learn how to equip legislators with valuable and pertinent information to make sound decisions about com- munity college funding. The study’s outcome clearly suggests at the state level an upward shift in attitude toward community college funding once community colleges were made a priority at the federal government level. In short, President Obama’s Community College Initiative has significantly increases legis- lators’ attitude toward community college funding. The best demographic predictors of legislators attitudes we learned are occupation, political affiliation, age, and income. For informa- tion sources, the best predictors are obtaining materials from advisors or experts, the state higher education agency, media, and the state legislative audit, research and review board. These key predictors of funding attitudes are markers that community college presidents can capitalize on to shape fund- ing policies that impact their institutions. This proactive ap- proach shared by Boswell (2004) in his study indicates that state policymakers must become better informed and base pol- icy decisions on data rather than parochial political interests. Community college presidents can use their faculty to study issues unique to their institutions and inform legislators by writing white papers, holding webinars or seminars to address the gaps where low-level attitudes toward community college Table 4. Predicting attitudes toward community college funding with demo- graphic characteristics and information sourcesa,b. Unstandardized Coefficients Model B Std. Error t Sig. 1 Occupationc 72.404 3.100 23.358.000 2 Occupationd 39.923 4.515 8.843.000 Political Party 38.880 4.567 8.513.000 3 Occupatione 37.360 4.331 8.626.000 Political Party 33.998 4.523 7.516.000 Age 15.069 4.091 3.683.000 4 Occupationf 30.441 4.639 6.562.000 Political Party 32.853 4.341 7.568.000 Age 14.206 3.923 3.622.000 Obama_CCI 13.760 4.147 3.318.001 5 Occupationg 23.199 5.093 4.555.000 Political Party 26.357 4.722 5.581.000 Age 11.489 3.894 2.950.004 Obama_CCI 14.341 4.007 3.579.001 Income 17.486 5.867 2.980.004 6 Occupationh 17.730 5.381 3.295.001 Political Party 22.281 4.854 4.590.000 Age 10.845 3.799 2.855.005 Obama_CCI 16.376 3.978 4.117.000 Income 17.310 5.712 3.031.003 Advisors or Experts 11.235 4.293 2.617.010 7 Occupationi 15.709 5.370 2.925.004 Political Party 21.719 4.778 4.546.000 Age 11.116 3.736 2.976.004 Obama_CCI 17.344 3.935 4.408.000 Income 15.810 5.656 2.795.006 Advisors or Experts10.985 4.221 2.603.011 Media 9.007 4.156 2.167.032 Note: aDependent variable: attitude toward community college funding. bLinear regression through the origin. cR2 = .832, SEE = 30.213, F(1,110) = 545.588, p < .001. dR2 = 899, SEE = 23.522, F(2,109) = 486.284, p < .001. eR2 = .910, SEE = 22.274, F(3,108) = 366.081, p < .001. fR2 = .919, SEE = 21.308, F(4,107) = 302.759, p < .001. gR2 =. 925, SEE = 20.564, F(5,106) = 261.828, p < .001. hR2 = .930, SEE = 20.019, F(6,105) = 231.371, p < .001. iR2 = .933, SEE = 19.676, F(7,104) = 205.973, p < .001. funding exist. Katsinsa, Tollefson & Reamey (2007) document low-level attitudes toward community college funding by state. They reported that 20 of 34 states with funding formulas did not fully fund their community college. Sixteen states indicated a lack of capacity to serve the current and projected needs of high school graduates, and 14 states indicated a lack of capacity to serve older, returning adult students. Lack of appropriate funding is a major challenge for community colleges and ad- dressing this problem must be done in a collaborative effort between college administrators, public officials, faculty, staff, and legislative liaisons to design data-driven strategies that Open Access 698  D. LINDSEY-TALIEFERO, L. TUCKER Open Access 699 effectively target key attitude predictors to achieve required funding from their respective state legislators. REFERENCES Bandura, A. (1996). Social cognitive theory of human development. In T. Husen, & T. N. Postlethwaite (Eds.), International encyclopedia of education (2nd ed., pp. 5513-5518). Oxford: Pergamon Press. Boyd, P. C. (2006). By the numbers: A sample size table. Quirk’s. Marketing Research Review. http://www.quirks.com/articles/2006/20061209.aspx Boswell, K., & Wilson, C. D. (2004). Keeping America’s promise: A report on the future of the community college: A joint report of the Education Commission of the States and the League for Innovation in the Community College. Denver, CO: Education Commission of the States. Desrochers, D. M., & Wellman, J. V. (2011). Trends in College Spending 1999-2009. www.deltacostproject.org/resources/pdf/Trends2011_Final_090711.p df? General Assembly of Maryland (2007). Roster and list of committees— 2007. http://msa.maryland.gov/megafile/msa/speccol/sc5300/sc5339/00011 3/013000/013241/unrestricted/20110059e.pdf General Assembly of Maryland (2012). Roster and list of committees— 2012. http://167.102.242.144/smb/mgaleg.maryland.gov/google_docs$/pub s/legislegal/2012rs-roster.pdf Horn, L. (2010). Tracking students to 200 percent of normal time: Effect on institutional graduation rates. Washington, DC: National Center for Education Statistics. http://nces.ed.gov/pubs2011/2011221.pdf Katsinas, S. G., Tollefson, T. A., & Reamey, B. A. (2008). Funding issues in U.S. community colleges: Findings from a 2007 survey of the National State Directors of Community Colleges. Washington, DC: American Association of Community Colleges. http://www.aacc.nche.edu/fundingissues Krejcie, R. V., & Morgan, D. W. (1970). Determining sample size for research activities. Educational and Psychological Measurement, 30, 607-610. Maryland Association of Community Colleges, MACC Board of Di- rectors (2013). 2013 legislative agenda. http://www.mdacc.org/legislation/wrapup.html National Center for Education Statistics (2013) Table 411. Percentage of population enrolled in secondary and postsecondary education, by age group and country. http://nces.ed.gov/programs/digest/d11/tables/dt11_411.asp Organization for Economic Co-Operation and Development (2011). Education at a glance 201 1 : OECD indicators. OECD Publishing. http://www.oecd-ilibrary.org/education/education-at-a-glance-2011_ eag-2011-en Payne, J. L., Woshinsky, O. H., Veblen, E. P., Coogan, W. H., & Bigler, G. E. (1984). The motivation of politicians. Chicago, IL: Nelson-Hall Publishers. Peterman, D. S. (2002). Federal priorities for community colleges: No community college left behind. Community College Journal of Re- search and Practice, 26, 815-821. Peterson, R. E., & Uhi, N. (1979) Community college goals inventory. Princeton, NJ: Educational Testing Service (ETS) & the American Association of Community and Junior Colleges. Rosenberg, M. J. (1960). A structural theory of attitude dynamics. Public Opinion Quarterly (1960), 24, 319-340 http://dx.doi.org/10.1086/266951 Shapiro, D., Dundar, A., Chen, J., Ziskin, M., Park, E., Torres, V., & Chiang, Y. C. (2012). Completing college: A national view of stu- dent attainment rates. http://eab.state.wi.us/resources/performancestandards/Completing_C ollege.pdf Snyder, T. D., & Dillow, S. A. (2011). Digest of education statistics 2010 (NCES 2011-015). Washington, DC: National Center for Edu- cation Statistics. The White House (2009). Remarks by the president on the American graduation initiative. http://www.whitehouse.gov/the_press_office/Remarks-by-the-Presid ent-on-the-American-graduation-initiative-in-Warren-MI/ The White House (2013). Education knowledge remarks by the presi- dent on the American graduation initiative. http://www.whitehouse.gov/the_press_office/Remarks-by-the-Presid ent-on-the-American-graduation-initiative-in-Warren-MI/ US Department of Education (2012). The economics of higher educa- tion, December 2012. http://www.treasury.gov/connect/blog/Documents/20121212_Econo mics%20of%20Higher%20Ed_vFINAL.pdf US Department of Education (2013). Education budget summary and background information fiscal year 2013. http://www2.ed.gov/about/overview/budget/budget13/summary/13su mmary.pdf
|