Engineering, 2013, 5, 297-306
http://dx.doi.org/10.4236/eng.2013.510B061 Published Online Octob er 2013 (http://www.scirp.org/journal/eng)
Copyright © 2013 SciRes. ENG
Study on the Authenticity of Identification Methods in
White Spirit by Infrared Spect rometer
Dekui Bai1,2, Ni Wang2, Quanhong Ying2, Jinhui Lin1
1College of Material & Chemical Engi neering Chengdu University of Technology, Chengdu, China
2Mianyang Product Quality Supervision and Inspection Bureau, Mianyang, China
Email: bdk123123@126.com, wangni0308@126.com
Received July 2013
ABSTRACT
This experiment studie s on the used infrared spectroscopy to establish technology methods for liquor identification me-
thods, as well a s offers the science data for establishment of the fin gerp rint in white spirit. The results have s hown tha t
usin g near-infrared spectroscopy analysis of liquor has t he ob vious feat ures suc h as stro ng specificity, good reproduci-
bility, simple operation, and finally confirmed that it is an authentic and ideal method for identifica tion in white spirit.
Keywords: Infrared Spectrometer (IR); White Spirit; Authenticity Identification
1. Introduction
Near-infrared light was bet ween visib le light a nd in frared
light and electromagnetic waves, the American Society
for Testing Materials (ASTM) defines that nearly infra-
red spectral region is a wavele ngt h ran ge fro m 78 0 n m to
526 nm. Almost customary divisions are divided into
short-wavelength near-infrareds (780 - 1100 nm) and
long wave near infrareds (1100 - 2526 nm) [1,2].
Since in the 1950s of the 20th century, near infrared
spectroscopy was applied in analysis of agricultural and
sideline products, but it was limited by technology and
slow pace of development in the next 30 years. While
after the 1980s o f the 20 th centur y, with t he rap id devel-
opment of computer technology and chemical methods in
the context of spectral information extraction and eli mi-
nation, the background interference achieved good re-
sults, as well as near-infrared spectroscopy in testing te-
chnical characteristics that are unique and the under-
standing of near-infrared spectroscopy for its wide range
of applications [2-7].
Thr ough the stud y of near-infrared technology, we un-
derstand that currently most applications of near-infrared
technology in Chinese herbal medicines, as well as indi-
cations of food analysis and studies have reported the use
of near-infrared spectrum detection models, as well as
Chinese medicinal materials for the identification of
Chinese medicinal materials [8-10] . Therefore, we will
use IR to analyze the liquor, to further develop the liquor
fingerprint spectrum database in order to id entify method
and provide technical support to establish authenticity of
liquor.
2. Experimental Method
2.1. Instrument
FOSS Company’s NIR Analyzer (NIRS DS 2500), In-
strument acq uis ition parameter s listed in Table 1.
2.2. Experiment Subject
In accordance with the production lot, year of production,
the production month difference, choice the maotai-la-
vor liquor as a test sample. Experiment on the production
of 2009-2012 years month 16 sets of samples, plus the
control sample 1 group (No.17), details are shown in
Table 2.
2.3. Exp erimenta l Pro ces s
Select th e param eters a n d
capture spectrum
Sam ple exper iments
Data pretreatment
of spectral
Format ion model
Validate th e model
Practical ap pl ication
Select samples
D. K. BAI ET AL.
Copyright © 2013 SciRes. ENG
Table 1. Instrument acquisition parameters.
Item Param eter
Signal Energy 5V
Resolution 2 cm1
Scanning Frequency 32
Spectral Range 400 - 2500 cm1
Referenc e Air
Spectrum Format Absorbance
Table 2. Sample information sheet.
NO. Manuf a c t ur i ng Codes NO. Manufactur ing Co des
1 20090803 10 20110823
2 20091022 11 20111015
3 20091223 12 20111217
4 20100405 13 20120108
5 20100611 14 20120327
6 20101106 15 20120704
7 20101214 16 20121024
8 20110105 17 20121218
9 20110129
3. Results and Discussion
3.1. Spectrum Pretr eatment
Pretre atment to the original s pectrums aim is to use ma-
thematical methods to minimize the impact of noise sig-
nals, thereby increasing the accuracy and reliability of
the model, spectral pretreatment mainly to solve the
noise filtering, data filtering, optimization of the spectral
range and eliminate the effects of other factors to the
light spectr um infor matio n, cor rectio n of la ying the foun -
dations for modeling and prediction of unknown samples
[11-13].
Noise Remove
Noise mainly comes from the high frequency random
noise and baseline drift, the sample is not uniform, light
scattering, etc. Because of the influence of the noise, the
useful infor matio n of the component under test is hard to
stand out, and the model precision, the near infrared
spectral analysis of the original spectrum can use the
following method s to remove.
1) Smooth processi ng. Smoo thi ng is a co mmo n way to
filter out noise, and its main function is to improve the
signal-to-noise ratio, the spectrum of removing high fre-
quency noise interference of the signal. Currently used
Savitzky-Golay smoothing function on near-infrared
spectroscopy, as a result of smoothing, high frequency
noise is reduced, spectrum of random scattered, but it
cannot be completely eliminated by Fourier transform
filtering, analysis of optical Fourier transform spectrum
signal before dropping the transformed frequency, in-
verse tran sfor m b ack to the s ta tus quo a nte, a nd the n p ar-
ticipate in the r e turn calculation.
2) Wavelet transforms. Spectrum denoising method
based on wavelet transform: wavelet transforms the
original spectrum, by wavelet coefficients ω, according
to Min value method will certainly factor ω small coeffi-
cients in weakened or removed, be ωden» under the re-
const ruction when the noise filtering o f signa l s .
3) Baseline correction treatment of the most common
method is to first order differential a nd second order dif-
ferential. Differential spectroscopy can enhance the ori-
ginal signal spectrum, so that will help in complex in
peak shape to better identify exactly where the peak, so
as to achieve the purpose of the differential spectra. First
order differential can eliminate baseline shift, second-
order differential can eliminate baseline drift, and this is
because the second derivative of the line is zero.
First derivative:
'
iig ig
yy y
+−
= −
Second derivative:
'22
2
iigi ig
yy yy
+−
= −+
g was spectral interval, size can be set accor ding t o the
circumstances.
3.2. Standard-Normalized
Near-infrared spectroscopy, sample homogeneity, par-
ticle size and length of the lig ht path also often affect the
shape of the spectrum, the spectrum standard normaliza-
tion proce ss is the most id eal s oluti on meas uri ng cha nges
in the optical path used to remove light change or speci-
men dilution effects, such as changes to the light spec-
trum produced. Spectrum under a of method has three
species: minimum/maximum under a of, and vector un-
der a of, and back zero correction, which common of is
vector under a of it is first calculation out spectrum of
sucking photometric average, again runs out spectrum
minus the average, such spectrum of in the value for zero,
calculate all of sucking photometric of sq and, then runs
out spectrum divided by the sq and of sq root, results
spectrum of vector under a of is l. Back to the zero cali-
bration is run out of the absorbance spectrum minus the
minimum makes smallest absorbance reaches zero.
3.3. Multiple Scatter Correction
Transmission spectral measurements of multiple scatter-
ing correction not only fixes errors in the optical path,
but also can eliminate reflection spectroscopy and diffu-
sion in the transmission spectra of light scattering effect,
multiple scattering correc tion algorithm is as follows:
D. K. BAI ET AL.
Copyright © 2013 SciRes. ENG
a) Calculate the average of all sa mple spectra:
,
1
1n
jij
i
AA
n
=
=
(1)
b) Calculation of each sample spectra with an average
spectrum to the linear regression, regression coefficient
is obtained mi, bi:
ii i
AmA b
= +
(2)
c) Calculate calibration spectra:
()
()
ii
i MSCi
Ab
Am
=
(3)
Formula, i = 1,2···n. As the number of samples; j
represents the number of j-wave.
3.4. Modeli ng
Basic principles and methods of near-infrared spectros-
copy technology development at the same time, chemical
metrology research in the 1970s of the 20th century,
combining knowledge of mathematics, statistics and
computer science. Study on extract information from
data, one of the most important developments is the use
of factor analysis, that is, with a large amount of data for
coordinate transformation in order to achieve the objec-
tive of reduced dimensions, which is to eliminate the
overlapping information coexistence. Typical applica-
tions such as principal component analysis: spectral data
by principal component analysis, again and find the cor-
rection factor dependent variable regression, principal
component regression based on partial least-squares re-
gression of development, the matrix for dimension re-
duction methods in light spectrum while introducing va-
riable information.
Thus, near-infr ared spectroscopy, including near-in-
frared spectrometry and chemical software and applica-
tion model of three-part, three combination to meet the
technical requirements for the rapid analysis, mathemat-
ical modeling methods are the main research focuses.
3.5. Data-Processing Software
1) TQ Analystv6 software. The software is United
States heat with high power company a definitive spec-
tral analysis software, offers a variety of quantitative and
qualitative analyses for spectral analyses and modeling
methods. T he soft war e pro vides qua ntitat ive mode ling o f
progressive multiple linear regression, principal compo-
nent regression and partial least squares regression. Qua-
litative modeling method matches the distance discrimi-
nate analysis, discriminate partial least squares. When
modeling, fir st select the algorithms, soft ware will appea r
in the window with the algorithm parameters and asso-
ciated information, in accordance with the requirements
set, and to establish the appropriate quantitative or qua-
litative models.
2) MAT LAB. MATLAB is the Math works company
that has developed a set of calculations, graph visualiza-
tion and editing functions in one powerful, easy math
application software. The software supports the quantita-
tive and qualitative modeling analysis and 3D graphics
dra wing, etc.
3.6. Orienta tion Analysis Result s
To test samples for infrared spectrometry, results are
detailed in Figures 1 - 17.
Experimental sample (Figu r es 1 - 16) test results
compared to the control sample (Figure 17(e)) results
concluded that: although with a response at the same
wavelength of Infrared Spectra, control sample peak
height is significantly below the peak of authenticity. In
Figure 1. No.20100611 sample spectra.
D. K. BAI ET AL.
Copyright © 2013 SciRes. ENG
Figure 2. No. 200910 22 sample spectra.
Figure 3. No. 20101214 sample spectra.
Figure 4. No. 20091223 sample spectra.
D. K. BAI ET AL.
Copyright © 2013 SciRes. ENG
Figure 5. No. 20110105 sample spectra.
Figure 6. No. 20100405 sample spectra.
Figure 7. No. 20110823 sample spectru m.
D. K. BAI ET AL.
Copyright © 2013 SciRes. ENG
Figure 8. No. 20101106 sample spectra.
Figure 9. No. 20111015 sample spectra.
Figure 10. No. 20111217 sample spectra.
D. K. BAI ET AL.
Copyright © 2013 SciRes. ENG
Figure 11. No. 20120327 sample spectra.
Figure 12. No. 20120108 sample spectra.
Figure 13. No. 20090803 sample spectrum.
D. K. BAI ET AL.
Copyright © 2013 SciRes. ENG
Figure 14. No. 20120704 sample spectra.
Figure 15. No. 20110129 sample spectra.
Figure 16. No. 20121024 sample spectra.
D. K. BAI ET AL.
Copyright © 2013 SciRes. ENG
Figure 17. The comparison sample spectra.
addition, according to the experimental sample analyzed
by IR spectra, IR spectra of all samples appro ximate over -
lapping, has certain regularity, so completely to the mod-
eling and identi fication of authenticity of liquor de gre e s.
3.7. Quantitative Analysis
With reference to the current liquor class national stan-
dard method, selected ethyl caproate, alcohol, methanol,
ethyl acetate four parameters for quantitative analysis,
detailed in Ta b l e 3 and Figures 18 to 21.
Figures 18-21, with sample number in Table 3 as ab-
scissa, experimental results to ordinate to draw. Sample
number 1 - 16 for the experimental samples of authentic,
17t h for the c ontrol s ample, and aver age as shown i n the
figure to the arithmetic mean of the sample of authentic-
ity. Quantitative experimental results indicate that all
experimental contents of the para meters in the sample the
real thing is a certain range of fluctuations, overall
changed little, however the control sample the obvious
deviation from the true value (Average value).
4. Conclusions
In this article, infrared spectroscopy applied to liquor of
ident ifying t he authe nticit y of d egrees ha ve succeeded in
establishing analysis model, and carrying out a qualita-
tive and quantitative analysis of the simple. Research
results show that used infrared spectroscopy to establish
authenticit y liquor identifica tion data models is practical,
real simple, and fast. Successful application of this tech-
nology for the supervision of government departments,
manufacturers provide strong technical support.
We should bear in mind that the technical key points
in the process are: 1) The stability of the sample. Liquor
volatile volatilize at room temperature, so on the choice
of experimental study to comprehensive consideration of
Table 3. Quantitative analy sis result s.
Manufacturing
Codes
Ethyl caproate
(g /L)
Alcohol
(%vol)
Methanol
(g /L)
Ethyl Acetate
(g /L)
20100611 2.12 53.77 0.15 0.87
20100405 2.15 54.12 0.15 0.87
20101214 2.18 54.12 0.15 0.87
20101106 2.21 54.00 0.16 0.87
20110105 2.18 53.26 0.13 0.86
20120108 2.17 53.31 0.13 0.86
20110823 2.28 54.12 0.16 0.87
20120704 2.26 54.11 0.16 0.87
20111015 2.20 53.78 0.16 0.86
20121024 2.24 54.14 0.16 0.87
20120327 2.20 53.92 0.16 0.87
20091022 2.23 53.96 0.16 0.86
20090803 2.25 54.23 0.18 0.87
20091223 2.28 54.03 0.18 0.87
20110129 2.19 54.35 0.14 0.87
20111217 2.23 54.27 0.14 0.87
Compare Sample 2.10 51.56 0.18 0.90
Figure 18. Ethyl caproate content trend s.
D. K. BAI ET AL.
Copyright © 2013 SciRes. ENG
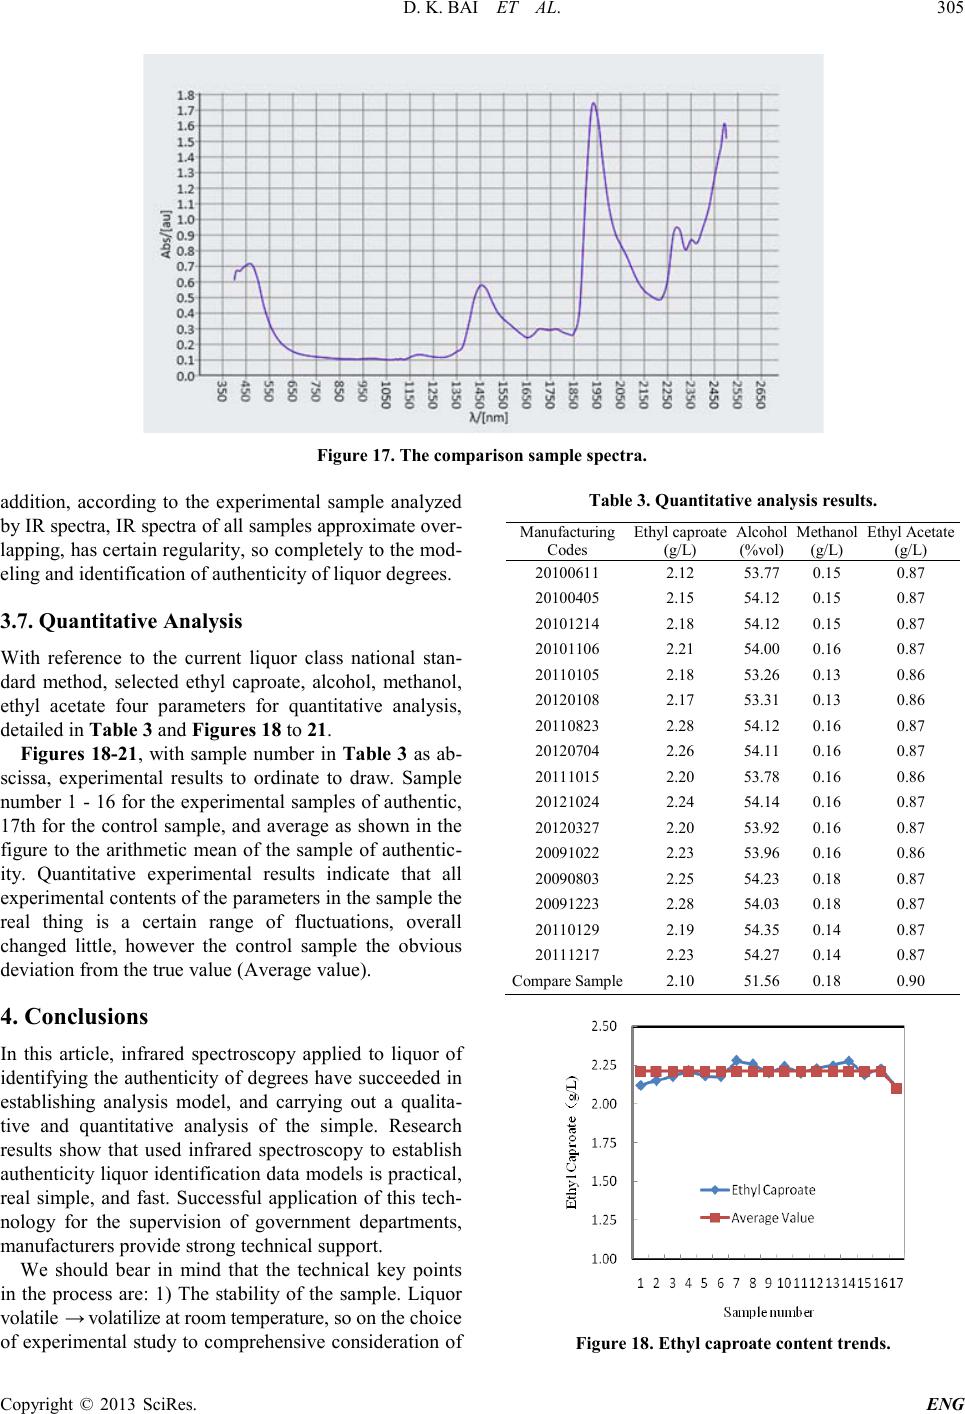
Figure 19. Alcohol co ntent trends.
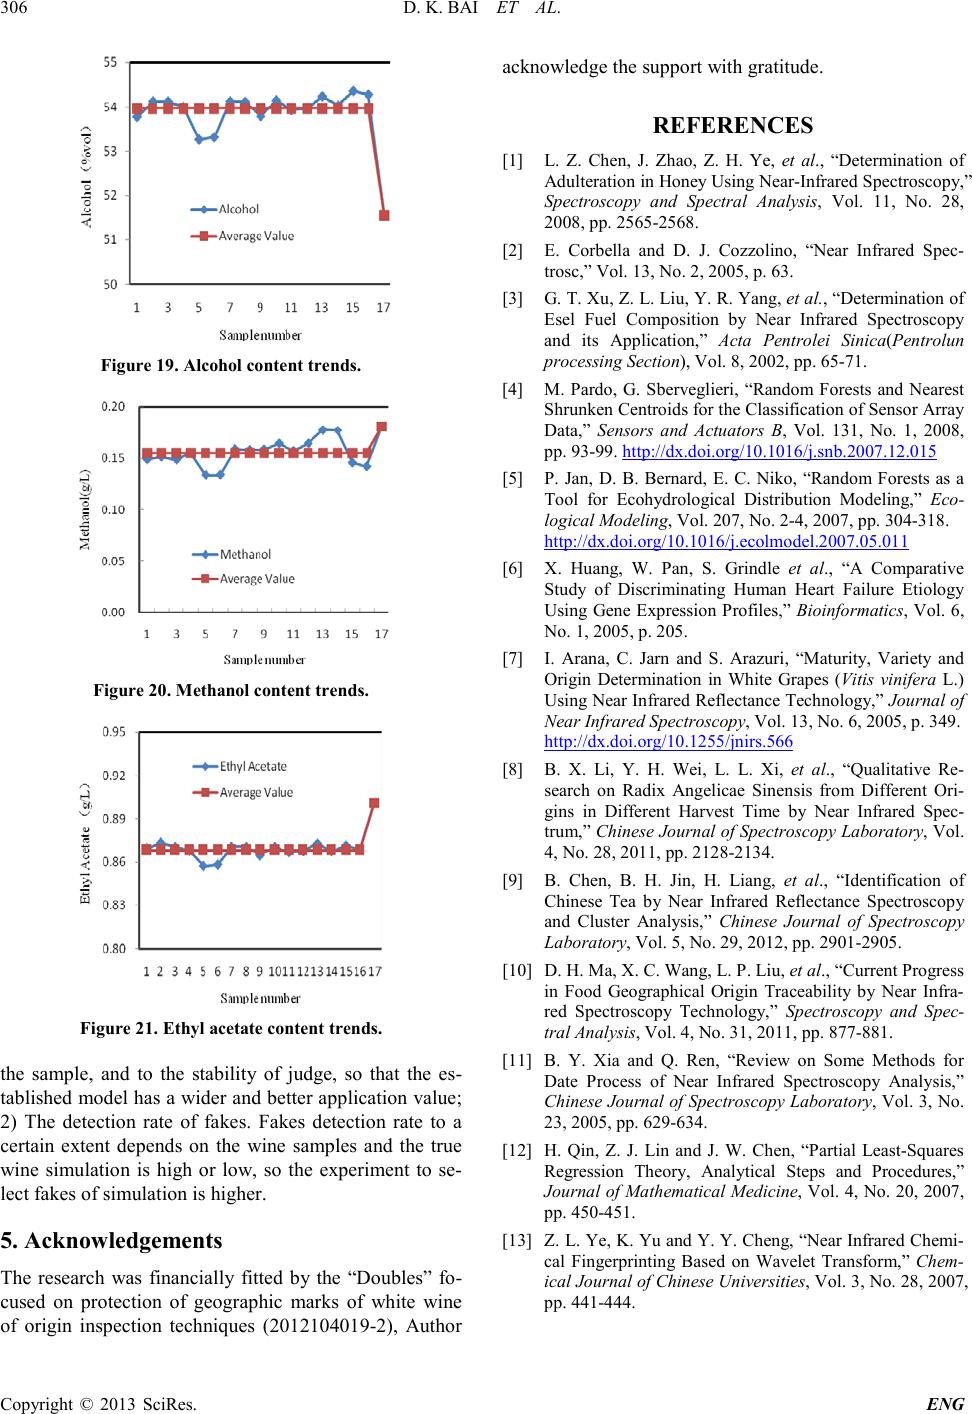
Figure 20. Me thanol c ontent tre nds.
Figure 21. Ethyl acetate c onte nt tre nds.
the sample, and to the stability of judge, so that the es-
tablished mod el has a wider a nd better ap plication value ;
2) The detection rate of fakes. Fakes detection rate to a
certain extent depends on the wine samples and the true
wine simulation is high or low, so the experiment to se-
lect fakes of simul ation is higher .
5. Acknowledgements
The research was financially fitted by the “Doubles” fo-
cused on protection of geographic marks of white wine
of origin inspection techniques (2012104019-2), Author
acknowledge the suppo rt with gratitude .
REFERENCES
[1] L. Z. Chen, J. Zhao, Z. H. Ye, et al., “Determination of
Adulteration in Honey Using Near-Infrared Spectroscopy,”
Spectroscopy and Spectral Analysis, Vol. 11, No. 28,
2008, pp. 2565-2568.
[2] E. Corbella and D. J. Cozzo lino, “Near Infrared Spec-
trosc,” Vol. 13, No. 2, 2005, p. 63.
[3] G. T. Xu, Z. L. Liu, Y. R. Yang, et al., Determination of
Esel Fuel Composition by Near Infrared Spectroscopy
and its Application,” Acta Pentrolei Sinica(Pentrolun
proce s s ing Se c t ion), Vol. 8, 2002, pp. 65-71.
[4] M. Pa rdo , G. Sberveglieri , “Random Forests and Nearest
Shrunken Centroids for the Classification of Sensor Array
Data,” Sensors and Actuators B, Vol. 131, No. 1, 2008,
pp. 93-99. http://dx.doi.org/10.1016/j.snb.2007.12.015
[5] P. Jan, D. B. Bernard, E. C. Niko, “Random Forests as a
Tool for Ecohydrological Distribution Modeling,” Eco-
logical Modeling, Vol. 207, No. 2-4, 2007, pp. 304-318.
http://dx.doi.org/10.1016/j.ecolmodel.2007.05.011
[6] X. Huang, W. Pan, S. Grindle et al., “A Comparative
Study of Discriminating Human Heart Failure Etiology
Using Gene Expression Profiles,” Bioinformatics, Vol. 6,
No. 1, 2005, p. 205.
[7] I. Arana, C. Jarn and S. Arazuri, “Maturity, Variety and
Origin Determination in White Grapes (Vitis vinifera L.)
Using Near I nfrared Refl ectance Technol ogy,” Journal of
Near Infr ar e d Spe c t r os c o py, Vol. 13, No. 6, 2005, p. 349.
http://dx.doi.org/10.1255/jnirs.566
[8] B. X. Li, Y. H. Wei, L. L. Xi, et al., “Qualitative Re-
search on Radix Angelicae Sinensis from Different Ori-
gins in Different Harvest Time by Near Infrared Spec-
trum,” Chinese Journal of Spectroscopy Laboratory, Vol.
4, No. 28, 2011, pp. 2128-2134.
[9] B. Chen, B. H. Jin, H. Li ang, et al., “Identification of
Chinese Tea by Near Infrared Reflectance Spectroscopy
and Cluster Analysis,” Chinese Journal of Spectroscopy
Laboratory, Vol. 5, No. 29, 2012, pp. 2901-2905.
[10] D. H. Ma, X. C. Wang , L. P. Liu, et al., “Current Progress
in Food Geographical Origin Traceability by Near Infra-
red Spectroscopy Technology,” Spectroscopy and Spec-
tral Analysis, Vol. 4, No. 31, 2011, pp. 877-881.
[11] B. Y. Xia and Q. Ren, “Review on Some Methods for
Date Process of Near Infrared Spectroscopy Analysis,”
Chinese Journal of Spectroscopy Laboratory, Vol. 3, No .
23, 2005, pp. 629-634.
[12] H. Qin, Z. J. Lin and J. W. Chen, “Partial Least-Squares
Regression Theory, Analytical Steps and Procedures,”
Journal of Mathematical Medicine, Vol. 4, No. 20, 2007,
pp. 450-451.
[13] Z. L. Ye, K. Yu and Y. Y. Cheng, “Near Infrared Chemi-
cal Fingerprinting Based on Wavelet Transform,” Chem-
ical Journal of Chinese Un iversi ties, Vol. 3, No. 28, 2007,
pp. 441-444.