Paper Menu >>
Journal Menu >>
 Engineering, 2 http://dx.doi.or g Copyright © 2 0 Fa t ABSTRA C In order to a n accordance w Models of th e software for s t obtained. The was found th a ble to suffer f r Keywords: P e 1. Introdu c Instrumented p rovide inter m accomplished modeling ex p for up to 12 screw techni q quickly spre a rection and r e treatment, an d though many biomechanic a search has b e thoracolumba r alloys have g r biomaterials f their radiogra p [5,6]. This p a ture of thorac o 2. Fixed St r 2.1. Thorac o The titanium a TC4 p late ha s good fatigue p chloride, hyd r terial propert i MPa of Elast i 013, 5, 292-29 6 g /10.4236/eng. 2 0 13 SciRes. t igue L i Scho o C T n alyze the fati g w ith the anti-f a e fixed structu r t atic analysis. fatigue life w a t the stress at r o m fatigue. e dicle Screw; c tion spinal fusio n m ediate stabil . The natural p oses t he met a months post o q ue was first u a d to trauma, e construction d many othe r studies have a l aspects of p e en seen wor k r fixed struct u r adually repla c f or lumbar s p p hic safety an d a per analyzed t o lumba r p edic r ucture an d o lumbar Fi x a lloy TC4 p la t s such featur e p erformance. I r oxide and s u i es of titaniu m i c Modulus, 0 . 6 2 013.510B060 P i fe Ana l Thor a T o o l of Mechanica l g ue life of th e a tigue test re q r e with two b a The maximu m as then calcul a the middle of Stress; Fatigu e n constructs a l ity until biol o rate of bone a llic construc t o perative p er i u sed in spond y degeneration, after resectio r disease trea t been done f p edicle screw s k ing on the fa t u re. Recently, c ed stainless s t p inal applicati d better p hysi c t he fatigue of le screw usin g d Static M o x ed Structur e t e was chosen e s as lightnes s I t is also corro u lfide enviro n m alloy TC4 a . 3 of Poisson R P ublished Onlin e l ysis of a colum b o ng Yang, K l Engineering, H Email: k Rece e posterior th o q uirements sp e a rs and four b a m and minimu m a ted using rel e the crossbea m e Life a re designed t o gical fusion healing and r t to duty cycl e i od [1]. Pedic y lolisthesis, a n deformity c o n of the tum o t ments [2]. A f ocusing on t h s [3,4], few r t igue life of t h t itanium and i t eel as preferr e ons because o c al performan c the fixed stru g FEM metho d o del e for calculatio s , high strengt sion resistant i n ment. The m a a re: 1.13 × 1 0 R atio, 875 M P e October 2013 Fixed S b ar Pe d K ai Chen, Y o H angzhou Dian z k chen@hdu.edu . ive d July 2013 o racolumbar fi x e cified by A S a rs were built m stresses of r e vant mathem a m between the t o is e- e s c le n d or - o r A l- h e e- h e i ts e d o f c e c- d . n. t h, in a - 0 5 P a of Yie l the fix e 1 cons i p endic u of the usuall y lumbar structu r fixed c o 2.2. S t Thorac spine t throug h Some r p atient s [7,8]. I p edicl e as an i dimen s The structu r is first made o thylen e inserte d b lock w terial t e thorac o (http://www.sc i S truct u d icle Sc r o nggui Lv z i University, H a . cn x ed structure, S TM Standar d by 3D softw a r isk nodes und e a tical formula o two bars is la r l d Stress, 925 e d structure o f i sts of two be u lar ba r , and w beam is 6 m y used in the t r fixation sur g r e can be ext e o nnections fo r t atic Model olumbar fixe d t hrough pedic l h the fixed st r r esearches de m s is higher if I n order to m e e screws and t h i ntegral p art i n s ional model i s normal fatig u r e is as follo w screwed into o f UHMWPE e module), sh o d into the U H w ith the chuc k e sting machi n o lumbar fixed rp.org/journal/ e u re of P o r ew a ngzhou, China a loading mo d F1717-04. T a re (UG), and i e r different lo a o f S-N curve a r ger than the s u MPa of Yiel d f the pedicle s c e a m s that are w ith screws at t m m and its le n r eatment of th e g ery. If need e e nded to less t r wider applic a d structure is p l e screws. Th r ucture to pro m onstrated tha t the spinal in t e sh and calc u h eir host stru c n this model. s shown in Fi g u e test for th e w s: the thoraco the prepared (ultra high m o o wn in Fi g ure H MWPE mo d k of the fixin g n e. The UHM W structure ne e e ng) o sterio r del was estab l T wo three-di m i mported into a ds and mom e a nd Goodman u rroundings a n d Limit. In th i c rew shown i n connected wi t t he ends. The d n gth is 105 m e two or three e d, the lengt h t han 410 mm a tions. p unctured int o e force is tra n tect the brok e t the fusion r a t ernal fixatio n u late convenie n c ture are char a The simplifi e g ure 2. e thoracolum b lumbar fixed s plate fixatio n o lecular weig h 3. A pair of m d ule connects g apparatus on W PE module e d to be repl a ENG r l ished in m ensional ANSYS e nts were curve. It n d is lia- i s pape r , n Figure t h a per- d iameter mm . It is thoraco- h of the through o human n smitted e n spine. a te of the n is used n tly, the a cterized e d three- b ar fixed s tructure n module h t polye- m etal bar the test the ma- and the a ced for  T. YANG ET AL. Copyright © 2013 SciRes. ENG 293 Figure 1. A typical thoracolumbar fixed structure. Figure 2. Simplified 3-D model with beam and bar structure. Figure 3. Fatigue test apparatus for thoracolumbar fixed structure. each fatigue test. According to the above described prototype of the fa- tigue test and the actual behavior of human vertebral body bending and lateral bending movement, a compres- sive load, a tensile load, a bending moment and a lateral load were added respectively for FEM analyses, as shown in Figure 4. Compressive loads and tensile loads of 100 N, 140 N, 180 N, 200 N and 220 N were used for the first run of calculation, bending moments of 200 Nmm, 300 Nmm, 400 Nmm and 500 Nmm were used for the second run of calculation, and lateral loads of 20 N, 40 N, 60 N and 80 N, were used for the third run of cal- culation. Figure 4. Four loading methods: (a) Compressive load; (b) Tensile load; (c) Bending moment; (d) Lateral load. 3. FEA and Fatigue Calculation The finite element analysis (FEA) by ANSYS software was carried out for the type of thoracolumbar fixed struc- ture with four corresponding loads. The fatigue lives of each load type were then calculated and listed in tables for comparison. 3.1. The Finite Element Mesh Model The simplified three-dimensional model was created us- ing the 3-D solid-building software UG (Version 6.0). Then the 3-D model was imported into Workbench stat- ics analysis module of ANSYS. The whole-size control method was used for grid partition. The mesh unit sol- id185 is a small, six-degree freedom tetrahedron. The two beams and one bar were controlled with 1 mm unit size and the rest was controlled with 1.2 mm unit size. Automatic grid partition with same solid185 unit was applied on two UHMWPE holding blocks, screws, bar and beams. The meshing result was shown in Figur e 5. 3.2. FEA Results Four different loading methods were applied for cal- cu- lation after grid generation: a pair of compressive loads, a pair of tensile loads, a pair of bending moments and a single lateral load were added on UHMWPE holding blocks respectively, as shown in Figure 3. Some results of the calculated stress clouds for the four loading types were shown in Figures 6-9. From Figures 6, 7 and 9, it can be seen that higher stress is distributed in the connection area of the beam and bar when the structure is loaded with compressive force, tensile force and lateral force. When the structure is loaded with bending moment, higher stress locates in the area of the middle of the beam, as shown in Figure 8. 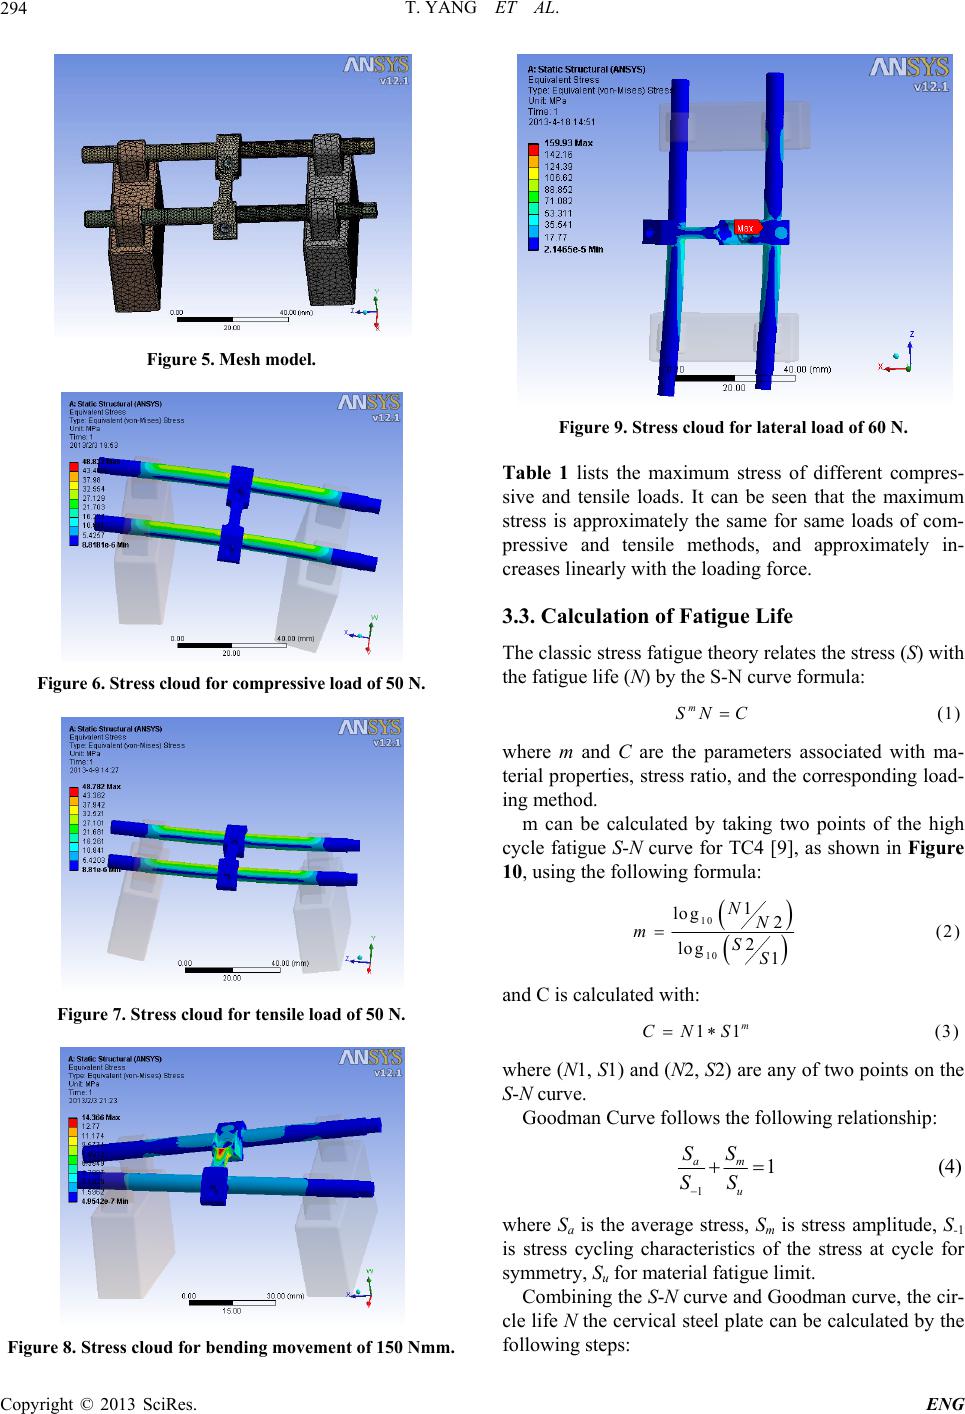 T. YANG ET AL. Copyright © 2013 SciRes. ENG 294 Figure 5. Mesh model. Figure 6. Stress cloud for compressive load of 50 N. Figure 7. Stress cloud for tensile load of 50 N. Figure 8. Stress cloud for bending movement of 150 Nmm. Figure 9. Stress cloud for lateral load of 60 N. Table 1 lists the maximum stress of different compres- sive and tensile loads. It can be seen that the maximum stress is approximately the same for same loads of com- pressive and tensile methods, and approximately in- creases linearly with the loading force. 3.3. Calculation of Fatigue Life The classic stress fatigue theory relates the stress (S) with the fatigue life (N) by the S-N curve formula: m SN C where m and C are the parameters associated with ma- terial properties, stress ratio, and the corresponding load- ing method. m can be calculated by taking two points of the high cycle fatigue S-N curve for TC4 [9], as shown in Figure 10, using the following formula: 10 10 1 log2 2 log1 NN mSS and C is calculated with: 11 m CNS where (N1, S1) and (N2, S2) are any of two points on the S-N curve. Goodman Curve follows the following relationship: 1 1 am u SS SS where Sa is the average stress, Sm is stress amplitude, S-1 is stress cycling characteristics of the stress at cycle for symmetry, Su for material fatigue limit. Combining the S-N curve and Goodman curve, the cir- cle life N the cervical steel plate can be calculated by the following steps: 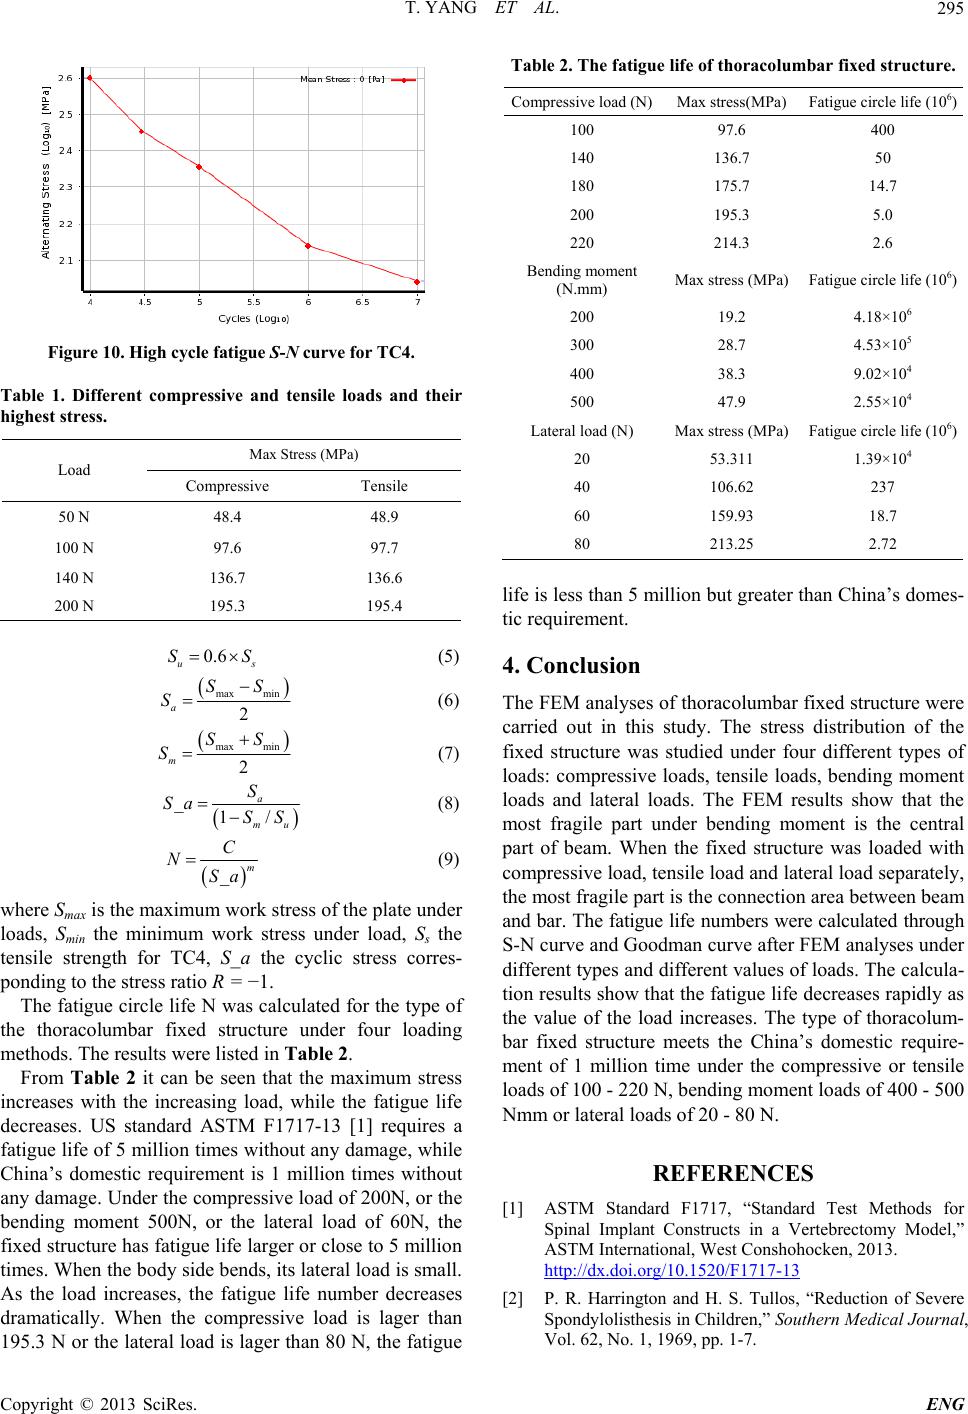 T. YANG ET AL. Copyright © 2013 SciRes. ENG 295 Figure 10. High cycle fatigue S-N curve for TC4. Table 1. Different compressive and tensile loads and their highest stress. Load Max Stress (MPa) Compressive Tensile 50 N 48.4 48.9 100 N 97.6 97.7 140 N 136.7 136.6 200 N 195.3 195.4 max min max min 0.6 2 2 1/ us a m a mu m SS SS S SS S S Sa SS C NSa where Smax is the maximum work stress of the plate under loads, Smin the minimum work stress under load, Ss the tensile strength for TC4, S_a the cyclic stress corres- ponding to the stress ratio R = −1. The fatigue circle life N was calculated for the type of the thoracolumbar fixed structure under four loading methods. The results were listed in Table 2. From Table 2 it can be seen that the maximum stress increases with the increasing load, while the fatigue life decreases. US standard ASTM F1717-13 [1] requires a fatigue life of 5 million times without any damage, while China’s domestic requirement is 1 million times without any damage. Under the compressive load of 200N, or the bending moment 500N, or the lateral load of 60N, the fixed structure has fatigue life larger or close to 5 million times. When the body side bends, its lateral load is small. As the load increases, the fatigue life number decreases dramatically. When the compressive load is lager than 195.3 N or the lateral load is lager than 80 N, the fatigue Table 2. The fatigue life of thoracolumbar fixed structure. Compressive load (N)Max stress(MPa) Fatigue circle life (106) 100 97.6 400 140 136.7 50 180 175.7 14.7 200 195.3 5.0 220 214.3 2.6 Bending moment (N.mm) Max stress (MPa) Fatigue circle life (106) 200 19.2 4.18×10⁶ 300 28.7 4.53×10⁵ 400 38.3 9.02×10⁴ 500 47.9 2.55×10⁴ Lateral load (N) Max stress (MPa) Fatigue circle life (106) 20 53.311 1.39×10⁴ 40 106.62 237 60 159.93 18.7 80 213.25 2.72 life is less than 5 million but greater than China’s domes- tic requirement. 4. Conclusion The FEM analyses of thoracolumbar fixed structure were carried out in this study. The stress distribution of the fixed structure was studied under four different types of loads: compressive loads, tensile loads, bending moment loads and lateral loads. The FEM results show that the most fragile part under bending moment is the central part of beam. When the fixed structure was loaded with compressive load, tensile load and lateral load separately, the most fragile part is the connection area between beam and bar. The fatigue life numbers were calculated through S-N curve and Goodman curve after FEM analyses under different types and different values of loads. The calcula- tion results show that the fatigue life decreases rapidly as the value of the load increases. The type of thoracolum- bar fixed structure meets the China’s domestic require- ment of 1 million time under the compressive or tensile loads of 100 - 220 N, bending moment loads of 400 - 500 Nmm or lateral loads of 20 - 80 N. REFERENCES [1] ASTM Standard F1717, “Standard Test Methods for Spinal Implant Constructs in a Vertebrectomy Model,” ASTM International, West Conshohocken, 2013. http://dx.doi.org/10.1520/F1717-13 [2] P. R. Harrington and H. S. Tullos, “Reduction of Severe Spondylolisthesis in Children,” Southern Medical Journal, Vol. 62, No. 1, 1969, pp. 1-7. 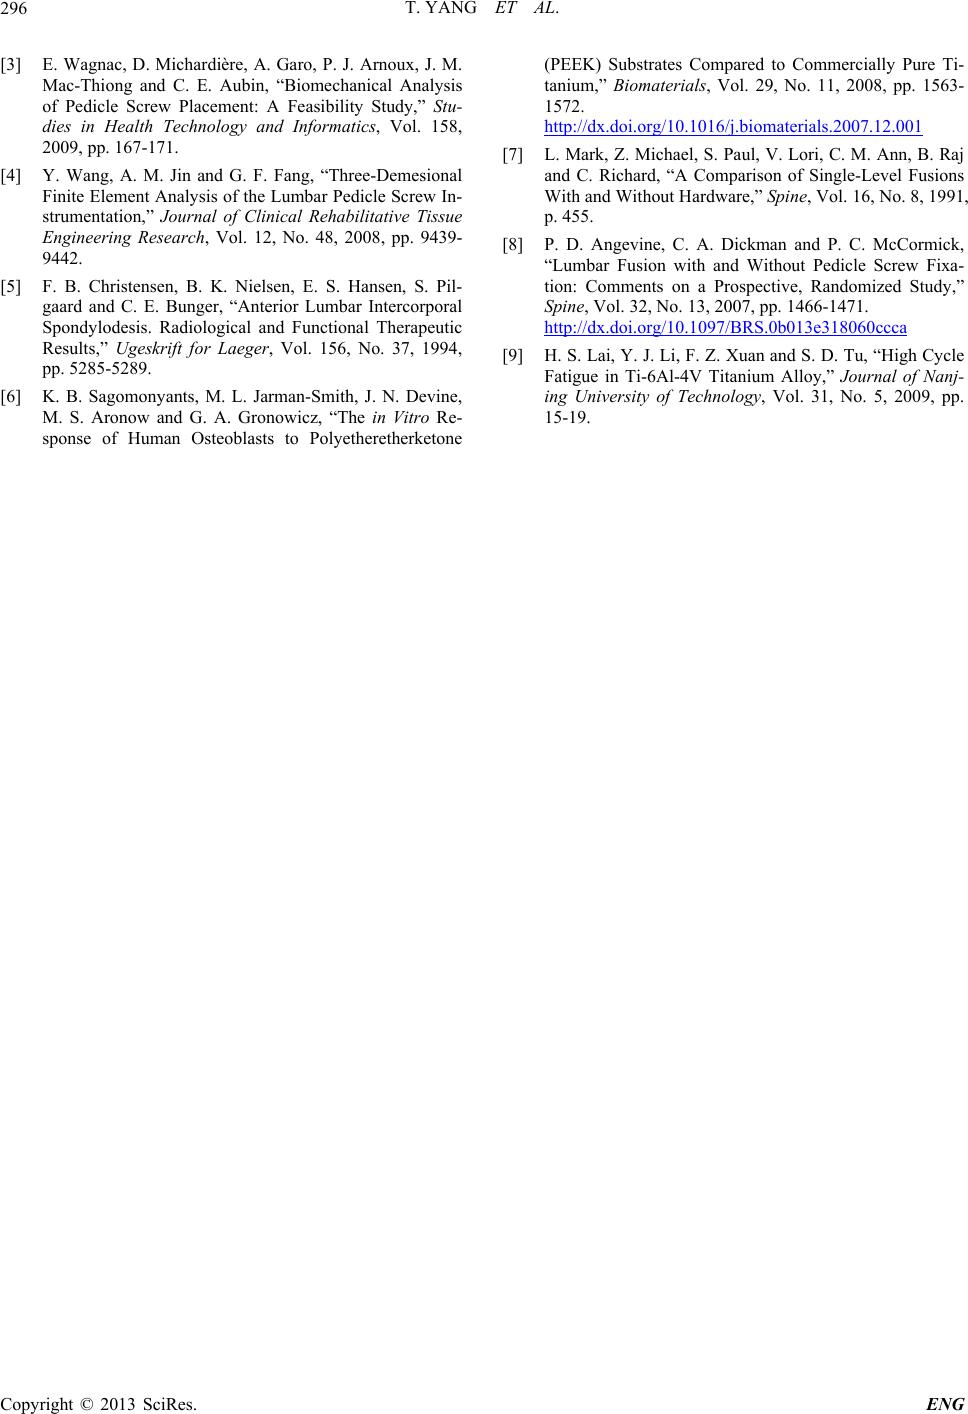 T. YANG ET AL. Copyright © 2013 SciRes. ENG 296 [3] E. Wagnac, D. Michardière, A. Garo, P. J. Arnoux, J. M. Mac-Thiong and C. E. Aubin, “Biomechanical Analysis of Pedicle Screw Placement: A Feasibility Study,” Stu- dies in Health Technology and Informatics, Vol. 158, 2009, pp. 167-171. [4] Y. Wang, A. M. Jin and G. F. Fang, “Three-Demesional Finite Element Analysis of the Lumbar Pedicle Screw In- strumentation,” Journal of Clinical Rehabilitative Tissue Engineering Research, Vol. 12, No. 48, 2008, pp. 9439- 9442. [5] F. B. Christensen, B. K. Nielsen, E. S. Hansen, S. Pil- gaard and C. E. Bunger, “Anterior Lumbar Intercorporal Spondylodesis. Radiological and Functional Therapeutic Results,” Ugeskrift for Laeger, Vol. 156, No. 37, 1994, pp. 5285-5289. [6] K. B. Sagomonyants, M. L. Jarman-Smith, J. N. Devine, M. S. Aronow and G. A. Gronowicz, “The in Vitro Re- sponse of Human Osteoblasts to Polyetheretherketone (PEEK) Substrates Compared to Commercially Pure Ti- tanium,” Biomaterials, Vol. 29, No. 11, 2008, pp. 1563- 1572. http://dx.doi.org/10.1016/j.biomaterials.2007.12.001 [7] L. Mark, Z. Michael, S. Paul, V. Lori, C. M. Ann, B. Raj and C. Richard, “A Comparison of Single-Level Fusions With and Without Hardware,” Spine , Vol. 16, No. 8, 1991, p. 455. [8] P. D. Angevine, C. A. Dickman and P. C. McCormick, “Lumbar Fusion with and Without Pedicle Screw Fixa- tion: Comments on a Prospective, Randomized Study,” Spine, Vol. 32, No. 13, 2007, pp. 1466-1471. http://dx.doi.org/10.1097/BRS.0b013e318060ccca [9] H. S. Lai, Y. J. Li, F. Z. Xuan and S. D. Tu, “High Cycle Fatigue in Ti-6Al-4V Titanium Alloy,” Journal of Nanj- ing University of Technology, Vol. 31, No. 5, 2009, pp. 15-19. |