Paper Menu >>
Journal Menu >>
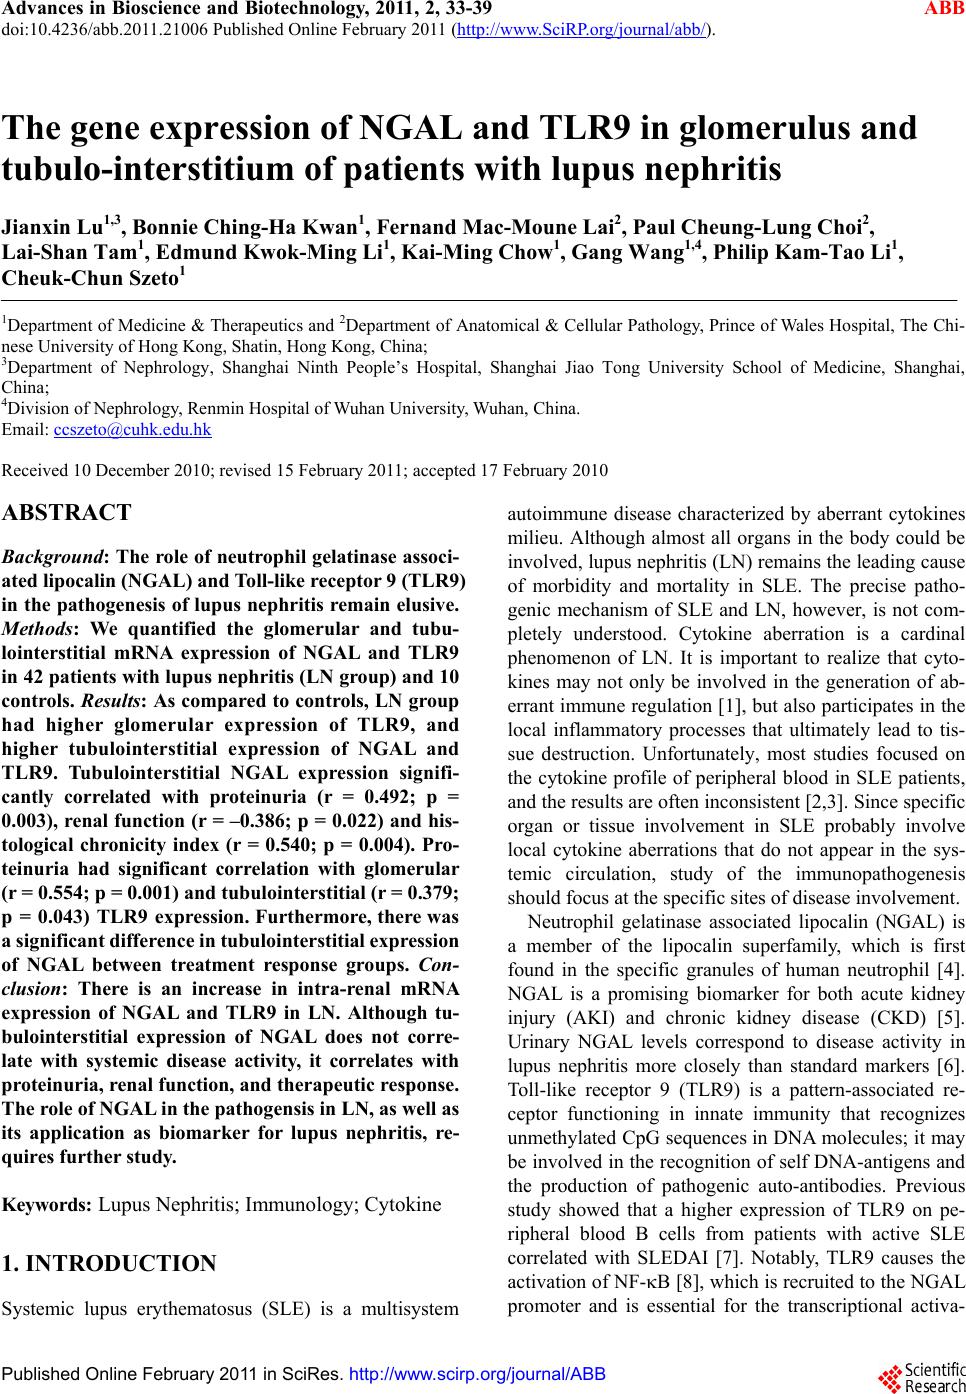 Advances in Bioscience and Biotechnology, 2011, 2, 33-39 ABB doi:10.4236/abb.2011.21006 Published Online February 2011 (http://www.SciRP.org/journal/abb/). Published Online February 2011 in SciRes. http://www.scirp.org/journal/ABB The gene expression of NGAL and TLR9 in glomerulus and tubulo-interstitium of patients with lupus nephritis Jianxin Lu1,3, Bonnie Ching-Ha Kwan1, Fernand Mac-Moune Lai2, Paul Cheung-Lung Choi2, Lai-Shan Tam1, Edmund Kwok-Ming Li1, Kai-Ming Chow1, Gang Wang1,4, Philip Kam-Tao Li1, Cheuk-Chun Szeto1 1Department of Medicine & Therapeutics and 2Department of Anatomical & Cellular Pathology, Prince of Wales Hospital, The Chi- nese University of Hong Kong, Shatin, Hong Kong, China; 3Department of Nephrology, Shanghai Ninth People’s Hospital, Shanghai Jiao Tong University School of Medicine, Shanghai, China; 4Division of Nephrology, Renmin Hospital of Wuhan University, Wuhan, China. Email: ccszeto@cuhk.edu.hk Received 10 December 2010; revised 15 February 2011; accepted 17 February 2010 ABSTRACT Background: The role of neutrophil gelatinase associ- ated lipocalin (NGAL) and Toll-like receptor 9 (TLR9) in the pathogenesis of lupus nephritis remain elusive. Methods: We quantified the glomerular and tubu- lointerstitial mRNA expression of NGAL and TLR9 in 42 patients with lupus nephritis (LN group) and 10 controls. Results: As compared to controls, LN group had higher glomerular expression of TLR9, and higher tubulointerstitial expression of NGAL and TLR9. Tubulointerstitial NGAL expression signifi- cantly correlated with proteinuria (r = 0.492; p = 0.003), renal function (r = –0.386; p = 0.022) and his- tological chronicity index (r = 0.540; p = 0.004). Pro- teinuria had significant correlation with glomerular (r = 0.554; p = 0.001) and tubulointerstitial (r = 0.379; p = 0.043) TLR9 expression. Furthermore, there was a signific ant diff er ence in t ubuloin terstiti al expr e ssion of NGAL between treatment response groups. Con- clusion: There is an increase in intra-renal mRNA expression of NGAL and TLR9 in LN. Although tu- bulointerstitial expression of NGAL does not corre- late with systemic disease activity, it correlates with proteinuria, renal function, and therapeutic response. The role of NGAL in the pathogensis in LN, as well as its application as biomarker for lupus nephritis, re- quires further study. Keywords: Lupus Nephritis; Immunology; Cytokine 1. INTRODUCTION Systemic lupus erythematosus (SLE) is a multisystem autoimmune disease characterized by aberrant cytokines milieu. Although almost all organs in the body could be involved, lupus nephritis (LN) remains the leading cause of morbidity and mortality in SLE. The precise patho- genic mechanism of SLE and LN, however, is not com- pletely understood. Cytokine aberration is a cardinal phenomenon of LN. It is important to realize that cyto- kines may not only be involved in the generation of ab- errant immune regulation [1], but also participates in the local inflammatory processes that ultimately lead to tis- sue destruction. Unfortunately, most studies focused on the cytokine profile of peripheral blood in SLE patients, and the results are often inconsistent [2,3]. Since specific organ or tissue involvement in SLE probably involve local cytokine aberrations that do not appear in the sys- temic circulation, study of the immunopathogenesis should focus at the specific sites of disease involvement. Neutrophil gelatinase associated lipocalin (NGAL) is a member of the lipocalin superfamily, which is first found in the specific granules of human neutrophil [4]. NGAL is a promising biomarker for both acute kidney injury (AKI) and chronic kidney disease (CKD) [5]. Urinary NGAL levels correspond to disease activity in lupus nephritis more closely than standard markers [6]. Toll-like receptor 9 (TLR9) is a pattern-associated re- ceptor functioning in innate immunity that recognizes unmethylated CpG sequences in DNA molecules; it may be involved in the recognition of self DNA-antigens and the production of pathogenic auto-antibodies. Previous study showed that a higher expression of TLR9 on pe- ripheral blood B cells from patients with active SLE correlated with SLEDAI [7]. Notably, TLR9 causes the activation of NF-B [8], which is recruited to the NGAL promoter and is essential for the transcriptional activa- 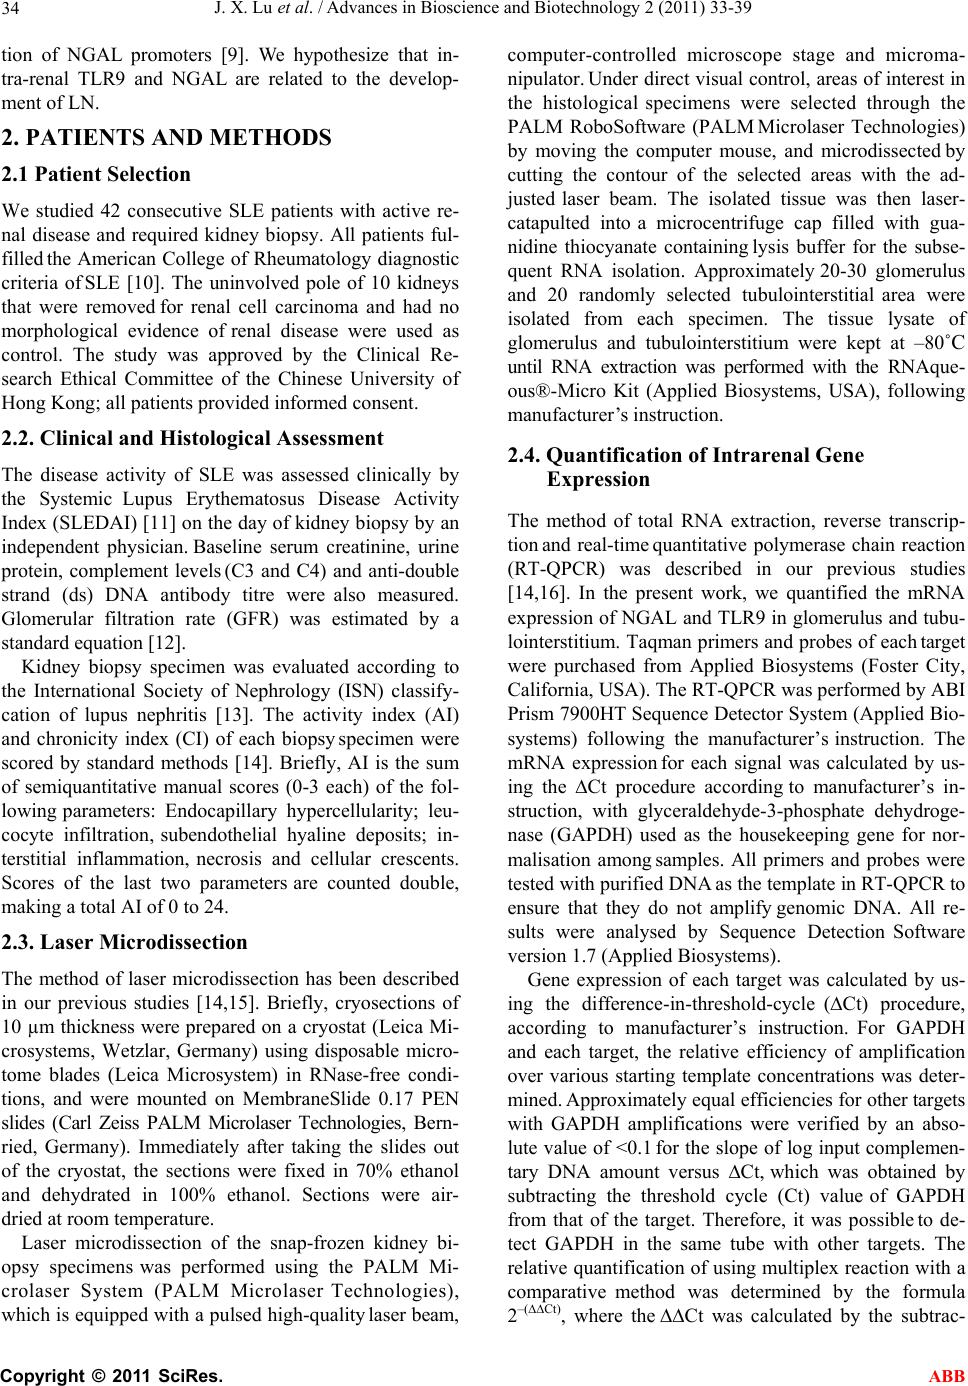 J. X. Lu et al. / Advances in Bioscience and Biotechnology 2 (2011) 33-39 Copyright © 2011 SciRes. ABB 34 tion of NGAL promoters [9]. We hypothesize that in- tra-renal TLR9 and NGAL are related to the develop- ment of LN. 2. PATIENTS AND METHODS 2.1 Patient Selection We studied 42 consecutive SLE patients with active re- nal disease and required kidney biopsy. All patients ful- filled the American College of Rheumatology diagnostic criteria of SLE [10]. The uninvolved pole of 10 kidneys that were removed for renal cell carcinoma and had no morphological evidence of renal disease were used as control. The study was approved by the Clinical Re- search Ethical Committee of the Chinese University of Hong Kong; all patients provided informed consent. 2.2. Clinical and Histological Assessment The disease activity of SLE was assessed clinically by the Systemic Lupus Erythematosus Disease Activity Index (SLEDAI) [11] on the day of kidney biopsy by an independent physician. Baseline serum creatinine, urine protein, complement levels (C3 and C4) and anti-double strand (ds) DNA antibody titre were also measured. Glomerular filtration rate (GFR) was estimated by a standard equation [12]. Kidney biopsy specimen was evaluated according to the International Society of Nephrology (ISN) classify- cation of lupus nephritis [13]. The activity index (AI) and chronicity index (CI) of each biopsy specimen were scored by standard methods [14]. Briefly, AI is the sum of semiquantitative manual scores (0-3 each) of the fol- lowing parameters: Endocapillary hypercellularity; leu- cocyte infiltration, subendothelial hyaline deposits; in- terstitial inflammation, necrosis and cellular crescents. Scores of the last two parameters are counted double, making a total AI of 0 to 24. 2.3. Laser Microdissection The method of laser microdissection has been described in our previous studies [14,15]. Briefly, cryosections of 10 µm thickness were prepared on a cryostat (Leica Mi- crosystems, Wetzlar, Germany) using disposable micro- tome blades (Leica Microsystem) in RNase-free condi- tions, and were mounted on MembraneSlide 0.17 PEN slides (Carl Zeiss PALM Microlaser Technologies, Bern- ried, Germany). Immediately after taking the slides out of the cryostat, the sections were fixed in 70% ethanol and dehydrated in 100% ethanol. Sections were air- dried at room temperature. Laser microdissection of the snap-frozen kidney bi- opsy specimens was performed using the PALM Mi- crolaser System (PALM Microlaser Technologies), which is equipped with a pulsed high-quality laser beam, computer-controlled microscope stage and microma- nipulator. Under direct visual control, areas of interest in the histological specimens were selected through the PALM RoboSoftware (PALM Microlaser Technologies) by moving the computer mouse, and microdissected by cutting the contour of the selected areas with the ad- justed laser beam. The isolated tissue was then laser- catapulted into a microcentrifuge cap filled with gua- nidine thiocyanate containing lysis buffer for the subse- quent RNA isolation. Approximately 20-30 glomerulus and 20 randomly selected tubulointerstitial area were isolated from each specimen. The tissue lysate of glomerulus and tubulointerstitium were kept at –80˚C until RNA extraction was performed with the RNAque- ous®-Micro Kit (Applied Biosystems, USA), following manufacturer’s instruction. 2.4. Quantification of Intrarenal Gene Expression The method of total RNA extraction, reverse transcrip- tion and real-time quantitative polymerase chain reaction (RT-QPCR) was described in our previous studies [14,16]. In the present work, we quantified the mRNA expression of NGAL and TLR9 in glomerulus and tubu- lointerstitium. Taqman primers and probes of each target were purchased from Applied Biosystems (Foster City, California, USA). The RT-QPCR was performed by ABI Prism 7900HT Sequence Detector System (Applied Bio- systems) following the manufacturer’s instruction. The mRNA expression for each signal was calculated by us- ing the Ct procedure according to manufacturer’s in- struction, with glyceraldehyde-3-phosphate dehydroge- nase (GAPDH) used as the housekeeping gene for nor- malisation among samples. All primers and probes were tested with purified DNA as the template in RT-QPCR to ensure that they do not amplify genomic DNA. All re- sults were analysed by Sequence Detection Software version 1.7 (Applied Biosystems). Gene expression of each target was calculated by us- ing the difference-in-threshold-cycle (Ct) procedure, according to manufacturer’s instruction. For GAPDH and each target, the relative efficiency of amplification over various starting template concentrations was deter- mined. Approximately equal efficiencies for other targets with GAPDH amplifications were verified by an abso- lute value of <0.1 for the slope of log input complemen- tary DNA amount versus Ct, which was obtained by subtracting the threshold cycle (Ct) value of GAPDH from that of the target. Therefore, it was possible to de- tect GAPDH in the same tube with other targets. The relative quantification of using multiplex reaction with a comparative method was determined by the formula 2–(Ct), where the Ct was calculated by the subtrac- 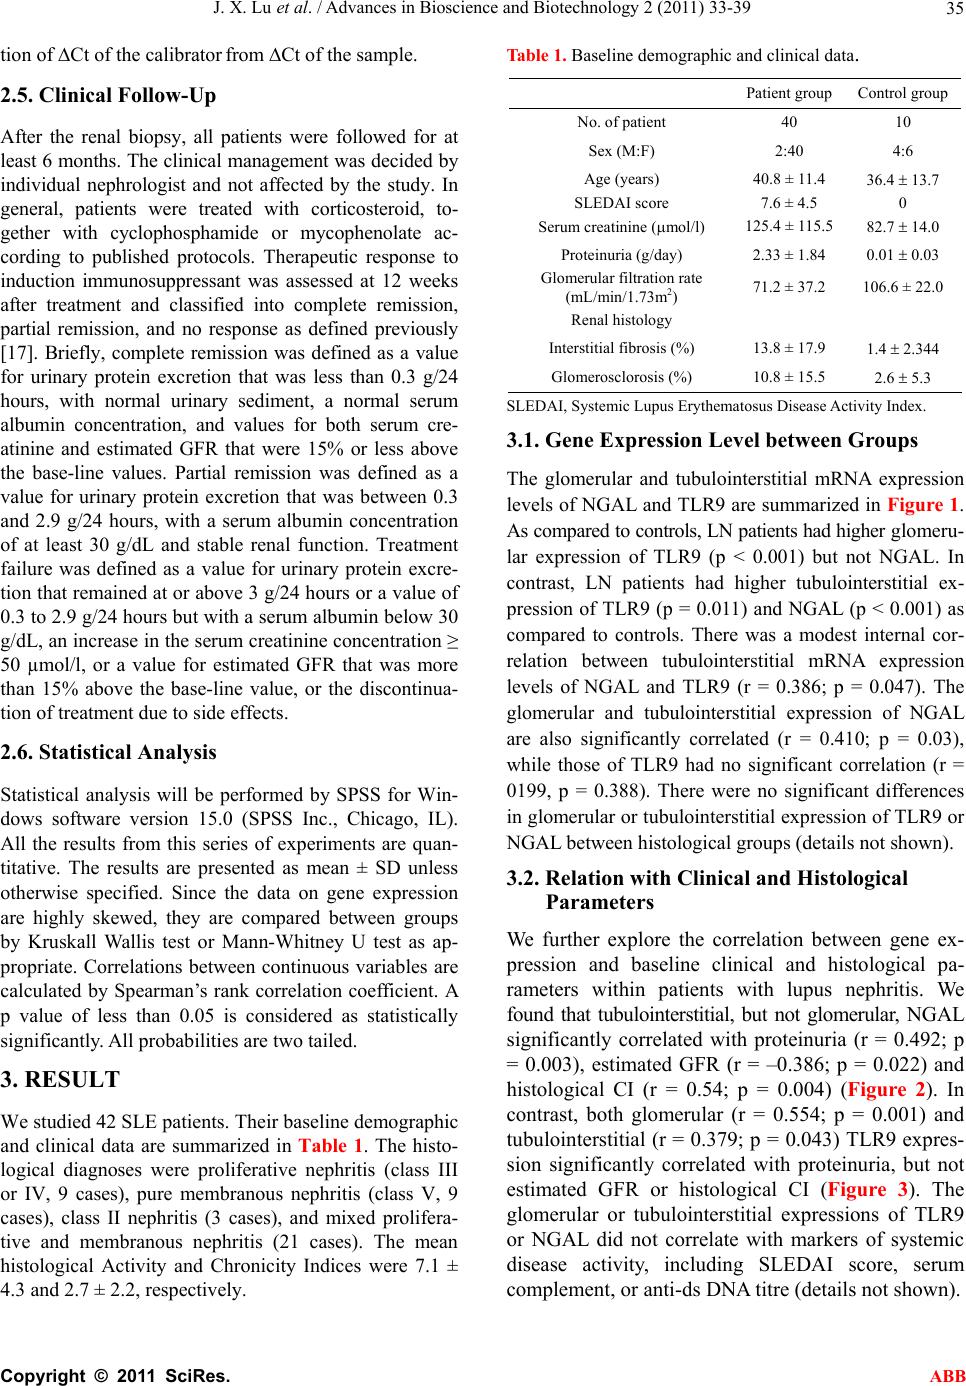 J. X. Lu et al. / Advances in Bioscience and Biotechnology 2 (2011) 33-39 Copyright © 2011 SciRes. ABB 35 tion of Ct of the calibrator from Ct of the sample. 2.5. Clinical Follow-Up After the renal biopsy, all patients were followed for at least 6 months. The clinical management was decided by individual nephrologist and not affected by the study. In general, patients were treated with corticosteroid, to- gether with cyclophosphamide or mycophenolate ac- cording to published protocols. Therapeutic response to induction immunosuppressant was assessed at 12 weeks after treatment and classified into complete remission, partial remission, and no response as defined previously [17]. Briefly, complete remission was defined as a value for urinary protein excretion that was less than 0.3 g/24 hours, with normal urinary sediment, a normal serum albumin concentration, and values for both serum cre- atinine and estimated GFR that were 15% or less above the base-line values. Partial remission was defined as a value for urinary protein excretion that was between 0.3 and 2.9 g/24 hours, with a serum albumin concentration of at least 30 g/dL and stable renal function. Treatment failure was defined as a value for urinary protein excre- tion that remained at or above 3 g/24 hours or a value of 0.3 to 2.9 g/24 hours but with a serum albumin below 30 g/dL, an increase in the serum creatinine concentration ≥ 50 µmol/l, or a value for estimated GFR that was more than 15% above the base-line value, or the discontinua- tion of treatment due to side effects. 2.6. Statistical Analysis Statistical analysis will be performed by SPSS for Win- dows software version 15.0 (SPSS Inc., Chicago, IL). All the results from this series of experiments are quan- titative. The results are presented as mean ± SD unless otherwise specified. Since the data on gene expression are highly skewed, they are compared between groups by Kruskall Wallis test or Mann-Whitney U test as ap- propriate. Correlations between continuous variables are calculated by Spearman’s rank correlation coefficient. A p value of less than 0.05 is considered as statistically significantly. All probabilities are two tailed. 3. RESULT We studied 42 SLE patients. Their baseline demographic and clinical data are summarized in Table 1. The histo- logical diagnoses were proliferative nephritis (class III or IV, 9 cases), pure membranous nephritis (class V, 9 cases), class II nephritis (3 cases), and mixed prolifera- tive and membranous nephritis (21 cases). The mean histological Activity and Chronicity Indices were 7.1 ± 4.3 and 2.7 ± 2.2, respectively. Table 1. Baseline demographic and clinical data. Patient group Control group No. of patient 40 10 Sex (M:F) 2:40 4:6 Age (years) 40.8 ± 11.4 36.4 13.7 SLEDAI score 7.6 ± 4.5 0 Serum creatinine (mol/l) 125.4 ± 115.5 82.7 14.0 Proteinuria (g/day) 2.33 ± 1.84 0.01 0.03 Glomerular filtration rate (mL/min/1.73m2) 71.2 ± 37.2 106.6 ± 22.0 Renal histology Interstitial fibrosis (%) 13.8 ± 17.9 1.4 2.344 Glomerosclorosis (%) 10.8 ± 15.5 2.6 5.3 SLEDAI, Systemic Lupus Erythematosus Disease Activity Index. 3.1. Gene Expression Level between Groups The glomerular and tubulointerstitial mRNA expression levels of NGAL and TLR9 are summarized in Figure 1. As compared to controls, LN patients had higher glomeru- lar expression of TLR9 (p < 0.001) but not NGAL. In contrast, LN patients had higher tubulointerstitial ex- pression of TLR9 (p = 0.011) and NGAL (p < 0.001) as compared to controls. There was a modest internal cor- relation between tubulointerstitial mRNA expression levels of NGAL and TLR9 (r = 0.386; p = 0.047). The glomerular and tubulointerstitial expression of NGAL are also significantly correlated (r = 0.410; p = 0.03), while those of TLR9 had no significant correlation (r = 0199, p = 0.388). There were no significant differences in glomerular or tubulointerstitial expression of TLR9 or NGAL between histological groups (details not shown). 3.2. Relation with Clinical and Histological Parameters We further explore the correlation between gene ex- pression and baseline clinical and histological pa- rameters within patients with lupus nephritis. We found that tubulointerstitial, but not glomerular, NGAL significantly correlated with proteinuria (r = 0.492; p = 0.003), estimated GFR (r = –0.386; p = 0.022) and histological CI (r = 0.54; p = 0.004) (Figure 2). In contrast, both glomerular (r = 0.554; p = 0.001) and tubulointerstitial (r = 0.379; p = 0.043) TLR9 expres- sion significantly correlated with proteinuria, but not estimated GFR or histological CI (Figure 3). The glomerular or tubulointerstitial expressions of TLR9 or NGAL did not correlate with markers of systemic disease activity, including SLEDAI score, serum complement, or anti-ds DNA titre (details not shown). 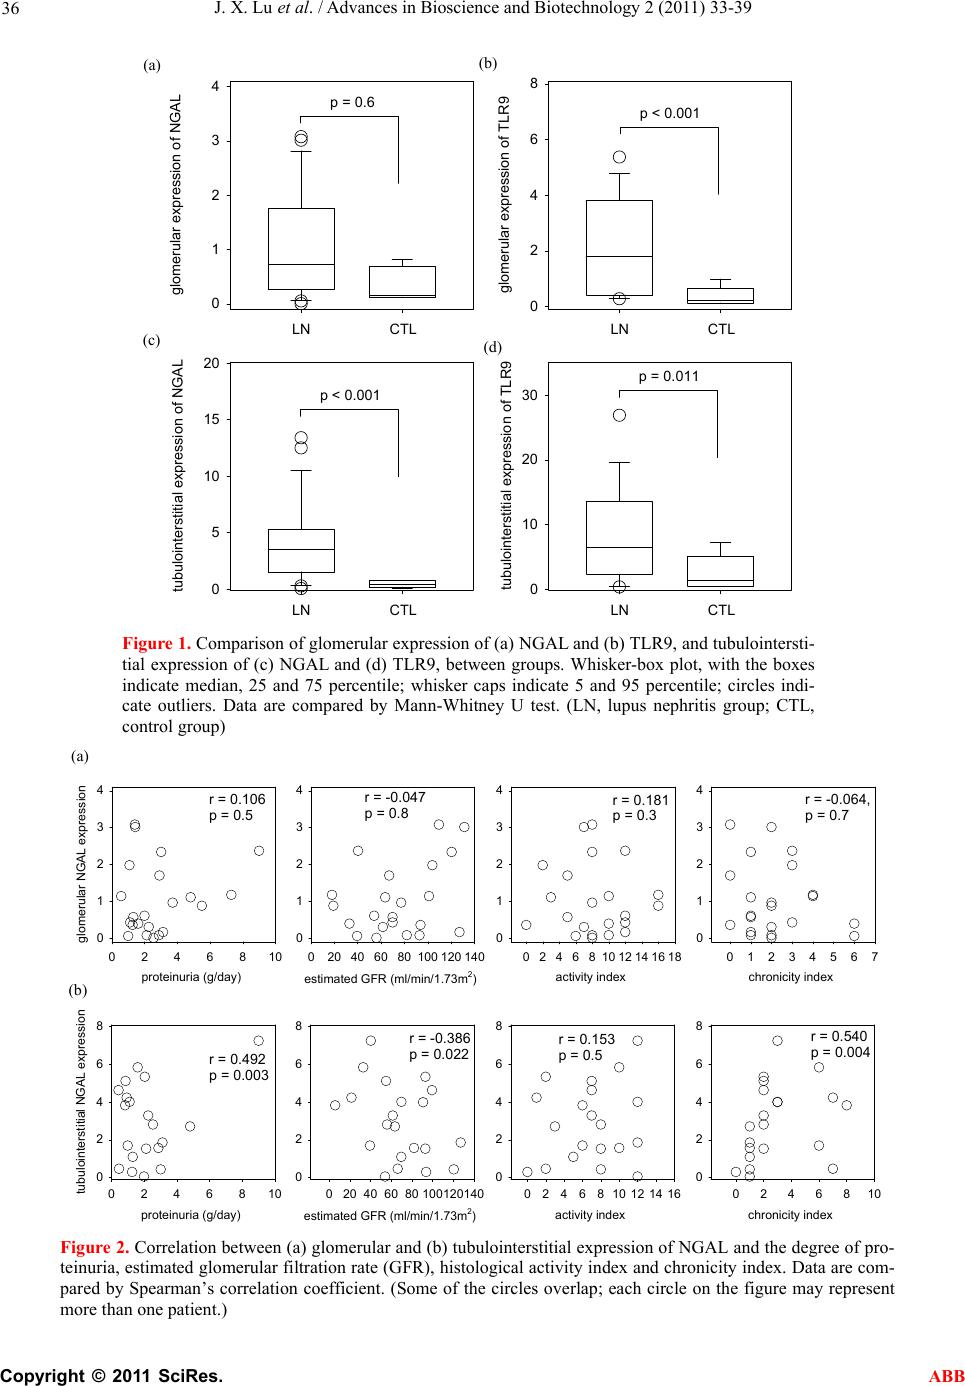 J. X. Lu et al. / Advances in Bioscience and Biotechnology 2 (2011) 33-39 Copyright © 2011 SciRes. ABB 36 glomerular expression of NGAL 0 1 2 3 4 LN CTL glomerular express ion of TLR9 0 2 4 6 8 LN CTL tubulointerstitial expression of NGAL 0 5 10 15 20 LN CTL tubulointerstitial expression of TLR9 0 10 20 30 LN CTL p = 0.6p < 0.001 p = 0.011 p < 0.001 (A) (B) (C) (D) Figure 1. Comparison of glomerular expression of (a) NGAL and (b) TLR9, and tubulointersti- tial expression of (c) NGAL and (d) TLR9, between groups. Whisker-box plot, with the boxes indicate median, 25 and 75 percentile; whisker caps indicate 5 and 95 percentile; circles indi- cate outliers. Data are compared by Mann-Whitney U test. (LN, lupus nephritis group; CTL, control group) proteinuria (g/day) 0246810 glomerular NGAL e x p r e ssio n 0 1 2 3 4 estimated GFR (ml/ mi n/1.73m2) 020406080100 120 140 0 1 2 3 4 activity index 0 2 4 6 81012141618 0 1 2 3 4 chronicity index 01234567 0 1 2 3 4 proteinuria (g/d a y) 0246810 tubulointerstitial NGAL expression 0 2 4 6 8 estimated GFR (ml/min/1.73m2) 020 4060 80100120140 0 2 4 6 8 activity ind e x 0246810121416 0 2 4 6 8 chronicity index 0246810 0 2 4 6 8 r = 0.106 p = 0.5r = -0.047 p = 0.8r = 0.181 p = 0.3r = -0.064, p = 0.7 r = 0.492 p = 0.003 r = -0.386 p = 0.022r = 0.153 p = 0.5r = 0.540 p = 0.004 (A) (B) Figure 2. Correlation between (a) glomerular and (b) tubulointerstitial expression of NGAL and the degree of pro- teinuria, estimated glomerular filtration rate (GFR), histological activity index and chronicity index. Data are com- pared by Spearman’s correlation coefficient. (Some of the circles overlap; each circle on the figure may represent more than one patient.) (a) (b) (c) (d) (a) (b) 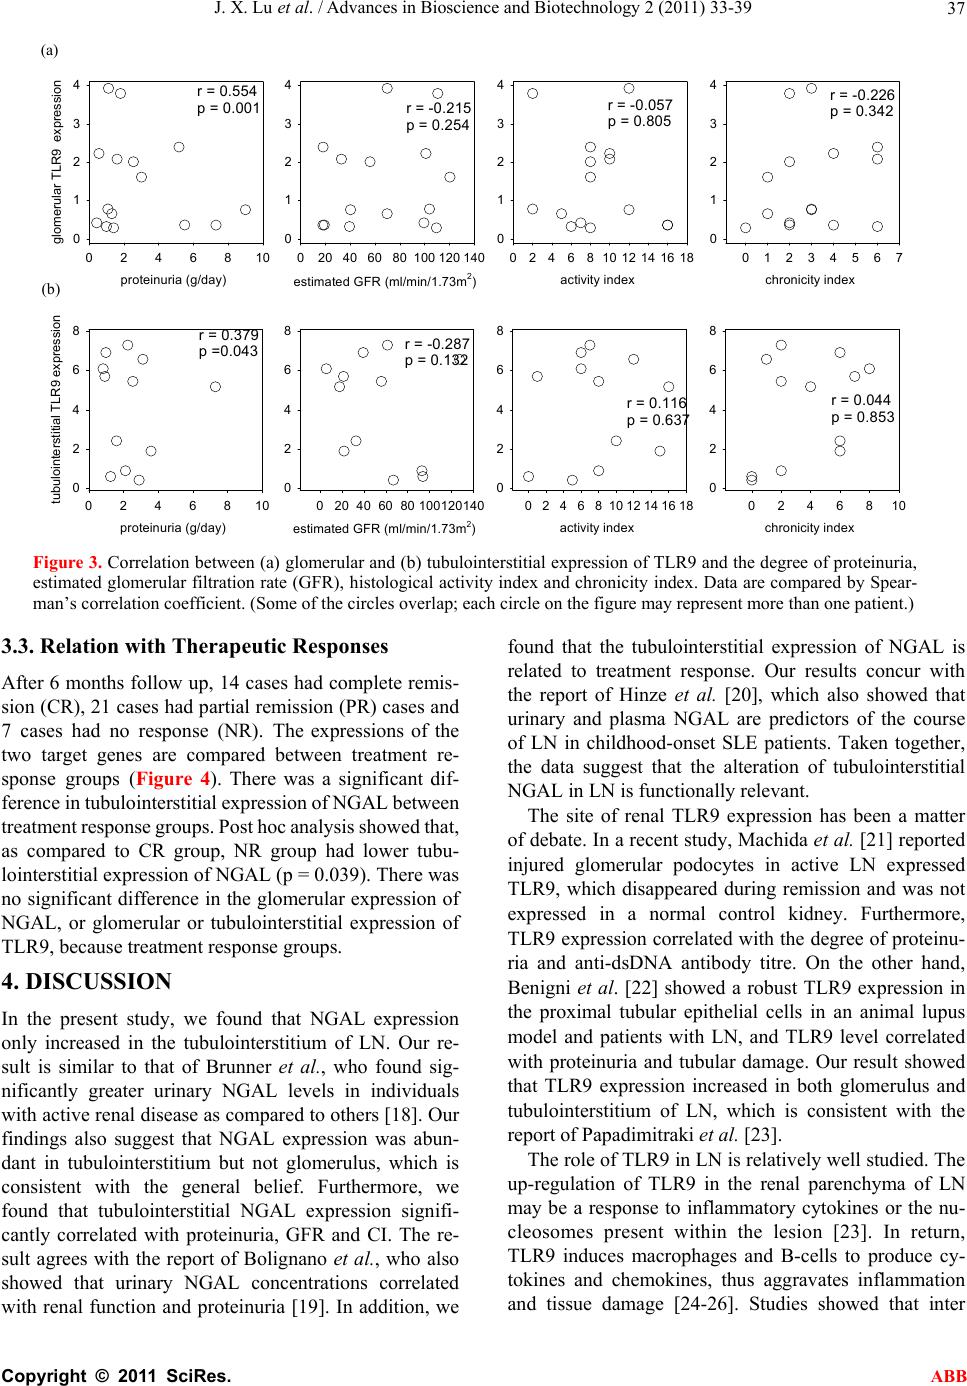 J. X. Lu et al. / Advances in Bioscience and Biotechnology 2 (2011) 33-39 Copyright © 2011 SciRes. ABB 37 proteinuria (g/day) 0246810 glomerular TLR9 expression 0 1 2 3 4 estimated GFR (ml/min/1.73m2) 0 20406080100120140 0 1 2 3 4 activity index 024681012141618 0 1 2 3 4 chronicity index 01234567 0 1 2 3 4 proteinuria (g/day) 0246810 tubulointerstitial TLR9 expression 0 2 4 6 8 estimated GFR (ml/min/1.73m2) 0 20406080100120140 0 2 4 6 8 activity index 024681012141618 0 2 4 6 8 chronicity index 0246810 0 2 4 6 8 r = 0.554 p = 0.001r = -0.215 p = 0.254 r = -0.057 p = 0.805 r = -0.226 p = 0.342 r = 0.379 p =0.043r = -0.287 p = 0.132 r = 0.116 p = 0.637r = 0.044 p = 0.853 (A) (B) Figure 3. Correlation between (a) glomerular and (b) tubulointerstitial expression of TLR9 and the degree of proteinuria, estimated glomerular filtration rate (GFR), histological activity index and chronicity index. Data are compared by Spear- man’s correlation coefficient. (Some of the circles overlap; each circle on the figure may represent more than one patient.) 3.3. Relation with Therapeutic Responses After 6 months follow up, 14 cases had complete remis- sion (CR), 21 cases had partial remission (PR) cases and 7 cases had no response (NR). The expressions of the two target genes are compared between treatment re- sponse groups (Figure 4). There was a significant dif- ference in tubulointerstitial expression of NGAL between treatment response groups. Post hoc analysis showed that, as compared to CR group, NR group had lower tubu- lointerstitial expression of NGAL (p = 0.039). There was no significant difference in the glomerular expression of NGAL, or glomerular or tubulointerstitial expression of TLR9, because treatment response groups. 4. DISCUSSION In the present study, we found that NGAL expression only increased in the tubulointerstitium of LN. Our re- sult is similar to that of Brunner et al., who found sig- nificantly greater urinary NGAL levels in individuals with active renal disease as compared to others [18]. Our findings also suggest that NGAL expression was abun- dant in tubulointerstitium but not glomerulus, which is consistent with the general belief. Furthermore, we found that tubulointerstitial NGAL expression signifi- cantly correlated with proteinuria, GFR and CI. The re- sult agrees with the report of Bolignano et al., who also showed that urinary NGAL concentrations correlated with renal function and proteinuria [19]. In addition, we found that the tubulointerstitial expression of NGAL is related to treatment response. Our results concur with the report of Hinze et al. [20], which also showed that urinary and plasma NGAL are predictors of the course of LN in childhood-onset SLE patients. Taken together, the data suggest that the alteration of tubulointerstitial NGAL in LN is functionally relevant. The site of renal TLR9 expression has been a matter of debate. In a recent study, Machida et al. [21] reported injured glomerular podocytes in active LN expressed TLR9, which disappeared during remission and was not expressed in a normal control kidney. Furthermore, TLR9 expression correlated with the degree of proteinu- ria and anti-dsDNA antibody titre. On the other hand, Benigni et al. [22] showed a robust TLR9 expression in the proximal tubular epithelial cells in an animal lupus model and patients with LN, and TLR9 level correlated with proteinuria and tubular damage. Our result showed that TLR9 expression increased in both glomerulus and tubulointerstitium of LN, which is consistent with the report of Papadimitraki et al. [23]. The role of TLR9 in LN is relatively well studied. The up-regulation of TLR9 in the renal parenchyma of LN may be a response to inflammatory cytokines or the nu- cleosomes present within the lesion [23]. In return, TLR9 induces macrophages and B-cells to produce cy- tokines and chemokines, thus aggravates inflammation and tissue damage [24-26]. Studies showed that inter (a) (b)  J. X. Lu et al. / Advances in Bioscience and Biotechnology 2 (2011) 33-39 Copyright © 2011 SciRes. ABB 38 glomerular expression of NGAL 0 1 2 3 CRPR NR glomerular expression of TLR9 0 1 2 3 4 CRPR NR tubulointerstitial expression of NGAL 0 5 10 15 20 25 30 CRPR NR tubulointerstitial expression of TLR9 0 5 10 15 20 25 CRPR NR (A) (B) (D) (C) P=0.53 P=0.045 P=0.99 P=0.16 P=0.141P=0.077 P=0.039 Figure 4. Comparison of glomerular expression of (a) NGAL and (b) TLR9, and tubu lointer- stitial expression of (c) NGAL and (d) TLR9, between treatment response groups. Data are compared by Kruskal Wallis test. The box indicates median, 25 and 75 percentile; whisker caps indicate 5 and 95 percentile; outliers are represented as closed circles. (Key for response groups: CR, complete remission; PR, partial remission; NR, no response.) nalization of SLE immune complexes into subcellular lysosomes containing TLR9 induced a signaling cascade that led to the activation of dendritic cells and produc- tion of cytokines and chemokines [27], suggesting that TLR9 may have a role in the onset and progression of LN. In the present study, we found a modest, although statistically significant, correlation between tubulointer- stitial expression of NGAL and TLR9. Our result indi- cates that tubulointerstitial NGAL expression is gov- erned by factors other than TLR9. Several limitations of the current study need to be ad- dressed. First, the sample size of our study was small, so that subgroup comparison of gene expression between different histological classes of lupus nephritis may not be reliable. Because of the limitated amount of patho- logical specimen available, we did not quantify intra- renal TLR9 or NGAL at protein level by immunohisto- chemistry or western blotting. In addition, we could not examine renal tissue of lupus patients without kidney problem as the control group. Furthermore, we do not examine the longitudinal change of intra-renal gene ex- pression or the response to immunosuppressive therapy by serial renal biopsy. Further experiments are necessary to solve these limitations and confirm our findings. In summary, we found an increase in intra-renal mRNA expression of NGAL and TLR9 in LN. Although tubulointerstitial expression of NGAL does not correlate with systemic disease activity, it correlates with protein- uria, renal function, and therapeutic response. The role of NGAL in the pathogensis in LN, as well as its appli- cation as biomarker for lupus nephritis, require further study. 5. ACKNOWLEDGEMENT This study was supported in part by the CUHK research account 6901031. All authors declare no conflict of interest. The results pre- sented in this paper have not been published previously in whole or part, except in abstract format. REFERENCES [1] Lauwerys, B. and Houssiau, F. (1998) Cytokines: Clues to the pathogenesis of SLE. Lupus, 7, 211-213. doi:10.1191/096120398678920136 [2] Karonitsch, T., Feierl, E., Steiner, C., et al. (2009) Activation of the interferon-gamma signaling pathway in systemic lupus erythematosus peripheral blood mono- (c) (a) (d) (b)  J. X. Lu et al. / Advances in Bioscience and Biotechnology 2 (2011) 33-39 Copyright © 2011 SciRes. ABB 39 nuclear cells. Arthritis Rheum, 60, 1463-1471. doi:10.1002/art.24449 [3] Lee, H., Mima, T., Sugino, H., et al. (2009) Interactions among type I and type II interferon, tumor necrosis factor, and beta-estradiol in the regulation of immune response- related gene expressions in systemic lupus erythematosus. Arthritis Res Ther, 11, 1. [4] Kjeldsen, L., Bainton, D., Sengeløv, H., et al. (1994) Identification of neutrophil gelatinase-associated lipocalin as a novel matrix protein of specific granules in human neutrophils. Blood, 83, 799-807. doi:10.1080/00365510802150158 [5] Devarajan, P. (2008) Neutrophil gelatinase-associated lipocalin (NGAL): A new marker of kidney disease. Scandinavian journal of clinical a nd laboratory investigation, 241, 89-94. [6] Pitashny, M., Schwartz, N., Qing, X., et al. (2007) Urinary lipocalin-2 is associated with renal disease activity in human lupus nephritis. Arthritis Rheum, 56, 1894-1903. [7] Nakano, S., Morimoto, S., Suzuki, J., et al. (2008) Role of pathogenic auto-antibody production by Toll-like receptor 9 of B cells in active systemic lupus erythe- matosus. Rheumatology, 47, 145-149. [8] Hemmi, H., Takeuchi, O., Kawai, T., et al. (2000) A Toll-like receptor recognizes bacterial DNA. Nature, 408, 740-745. doi:10.1038/35047123 [9] Matsuo, S., Yamazaki, S., Takeshige, K., et al. (2007) Crucial roles of binding sites for NF-kappaB and C/EBPs in IkappaB-zeta-mediated transcriptional activation. Bio- chemical Journa l, 405, 605-615. doi:10.1042/BJ20061797 [10] Hochberg, M. (1997) Updating the American college of rheumatology revised criteria for the classification of systemic lupus erythematosus. Arthritis Rheum, 40, 1725. doi:10.1002/art.1780400928 [11] Bombardier, C., Gladman, D., Urowitz, M., et al. (1992) Derivation of the SLEDAI. A disease activity index for lupus patients. The Committee on Prognosis Studies in SLE. Arthritis Rheum, 35, 630-640. [12] Levey, A., Bosch, J., Lewis, J., et al. (1999) A more accurate method to estimate glomerular filtration rate from serum creatinine: A new prediction equation. Modification of diet in renal disease study group. Annals of Internal Medicine, 130, 461-470. [13] Weening, J., D'Agati, V., Schwartz, M., et al. (2004) The classification of glomerulonephritis in systemic lupus erythematosus revisited. Kidney International, 65, 521- 530. doi:10.1111/j.1523-1755.2004.00443.x [14] Chan, R., Lai, F., Li, E., et al. (2007) Intrarenal cytokine gene expression in lupus nephritis. Annals of the Rheumatic Diseases, 66, 886-892. [15] Wang, G., Lai, F., Lai, K., et al. (2009) Discrepancy between intrarenal messenger RNA and protein expression of ACE and ACE2 in human diabetic nephropathy. American Journal of Nephrology, 29, 524- 531. doi:10.1159/000185629 [16] Chan, R., Lai, F., Li, E., et al. (2004) Expression of chemokine and fibrosing factor messenger RNA in the urinary sediment of patients with lupus nephritis. Arthritis Rheum, 50, 2882-2890. [17] Chan, T., Li, F., Tang, C., et al. (2000) Efficacy of mycophenolate mofetil in patients with diffuse proliferative lupus nephritis. Hong Kong-Guangzhou nephrology study group. The New England Journal of Medicine, 343, 1156-1162. doi:10.1056/NEJM200010193431604 [18] Brunner, H., Mueller, M., Rutherford, C., et al. (2006) Urinary neutrophil gelatinase-associated lipocalin as a biomarker of nephritis in childhood-onset systemic lupus erythematosus. Arthritis Rheum, 54, 2577-2584. doi:10.1002/art.22008 [19] Bolignano, D., Coppolino, G., Campo, S., et al. (2008) Urinary neutrophil gelatinase-associated lipocalin (NGAL) is associated with severity of renal disease in proteinuric patients. Nephrol Dial Transplant, 23, 414-416. [20] Hinze, C., Suzuki, M., Klein-Gitelman, M., et al. (2009) Neutrophil gelatinase-associated lipocalin is a predictor of the course of global and renal childhood-onset sys- temic lupus erythematosus disease activity. Arthritis Rheum, 60, 2772-2781. doi:10.1002/art.24751 [21] Machida, H., Ito, S., Hirose, T., et al. (2010) Expression of Toll-like receptor 9 in renal podocytes in child- hood-onset active and inactive lupus nephritis. Nephrol Dial Transplant, 25, 2430-2537. [22] Benigni, A., Caroli, C., Longaretti, L., et al. (2007) Involvement of renal tubular Toll-like receptor 9 in the development of tubulointerstitial injury in systemic lupus. Arthritis Rheum, 56, 1569-1578. [23] Papadimitraki, E., Tzardi, M., Bertsias, G., et al. (2009) Glomerular expression of toll-like receptor-9 in lupus nephritis but not in normal kidneys: implications for the amplification of the inflammatory response. Lupus, 18, 831-835. doi:10.1177/0961203309103054 [24] Leadbetter, E., Rifkin, I., Hohlbaum, A., et al. (2002) Chromatin-IgG complexes activate B cells by dual engagement of IgM and Toll-like receptors. Nature, 416, 603-607. doi:10.1038/416603a [25] Mortensen, E., Fenton, K. and Rekvig, O. (2008) Lupus nephritis: the central role of nucleosomes revealed. American Journal of Pathology, 172, 275-283. [26] Patole, P., Pawar, R., Lech, M., et al. (2006) Expression and regulation of Toll-like receptors in lupus-like immune complex glomerulonephritis of MRL-Fas(lpr) mice. Nephrol Dial Transplant, 21, 3062-3073. doi:10.1093/ndt/gfl336 [27] Means, T., Latz, E., Hayashi, F., et al. (2005) Human lupus autoantibody-DNA complexes activate DCs through cooperation of CD32 and TLR9. Journal of Clinical Investigation, 115, 407-417. |