Paper Menu >>
Journal Menu >>
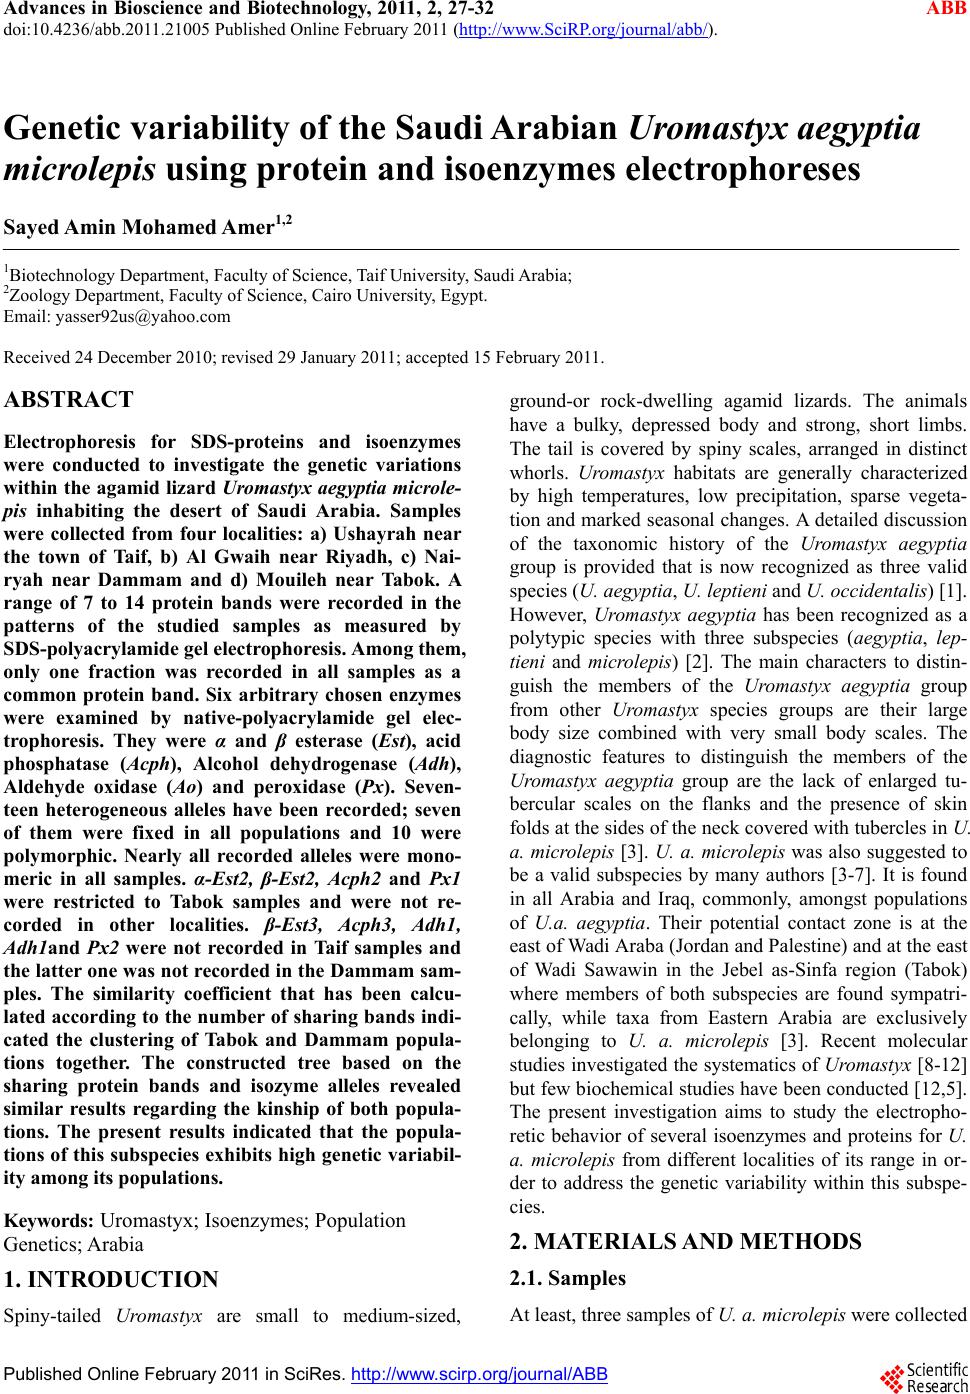 Advances in Bioscience and Biotechnology, 2011, 2, 27-32 ABB doi:10.4236/abb.2011.21005 Published Online February 2011 (http://www.SciRP.org/journal/abb/). Published Online February 2011 in SciRes. http://www.scirp.org/journal/ABB Genetic variability of the Saudi Arabian Uromastyx aegyptia microlepis using protein and isoenzymes electrophoreses Sayed Amin Mohamed Amer1,2 1Biotechnology Department, Faculty of Science, Taif University, Saudi Arabia; 2Zoology Department, Faculty of Science, Cairo University, Egypt. Email: yasser92us@yahoo.com Received 24 December 2010; revised 29 January 2011; accepted 15 February 2011. ABSTRACT Electrophoresis for SDS-proteins and isoenzymes were conducted to investigate the genetic variations within the agamid lizard Uromastyx aegyptia microle- pis inhabiting the desert of Saudi Arabia. Samples were collected from four localities: a) Ushayrah near the town of Taif, b) Al Gwaih near Riyadh, c) Nai- ryah near Dammam and d) Mouileh near Tabok. A range of 7 to 14 protein bands were recorded in the patterns of the studied samples as measured by SDS-polyacrylamide gel electrophoresis. Among them, only one fraction was recorded in all samples as a common protein band. Six arbitrary chosen enzymes were examined by native-polyacrylamide gel elec- trophoresis. They were α and β esterase (Est), acid phosphatase (Acph), Alcohol dehydrogenase (Adh), Aldehyde oxidase (Ao) and peroxidase (Px). Seven- teen heterogeneous alleles have been recorded; seven of them were fixed in all populations and 10 were polymorphic. Nearly all recorded alleles were mono- meric in all samples. α-Est2, β-Est2, Acph2 and Px1 were restricted to Tabok samples and were not re- corded in other localities. β-Est3, Acph3, Adh1, Adh1and Px2 were not recorded in Taif samples and the latter one was not recorded in the Dammam sam- ples. The similarity coefficient that has been calcu- lated according to the number of sharing bands indi- cated the clustering of Tabok and Dammam popula- tions together. The constructed tree based on the sharing protein bands and isozyme alleles revealed similar results regarding the kinship of both popula- tions. The present results indicated that the popula- tions of this subspecies exhibits high genetic variabil- ity among its populati ons . Keywords: Uromastyx; Isoenzymes; Population Genetics; Arabia 1. INTRODUCTION Spiny-tailed Uromastyx are small to medium-sized, ground-or rock-dwelling agamid lizards. The animals have a bulky, depressed body and strong, short limbs. The tail is covered by spiny scales, arranged in distinct whorls. Uromastyx habitats are generally characterized by high temperatures, low precipitation, sparse vegeta- tion and marked seasonal changes. A detailed discussion of the taxonomic history of the Uromastyx aegyptia group is provided that is now recognized as three valid species (U. aegyptia, U. leptieni and U. occidentalis) [1]. However, Uromastyx aegyptia has been recognized as a polytypic species with three subspecies (aegyptia, lep- tieni and microlepis) [2]. The main characters to distin- guish the members of the Uromastyx aegyptia group from other Uromastyx species groups are their large body size combined with very small body scales. The diagnostic features to distinguish the members of the Uromastyx aegyptia group are the lack of enlarged tu- bercular scales on the flanks and the presence of skin folds at the sides of the neck covered with tubercles in U. a. microlepis [3]. U. a. microlepis was also suggested to be a valid subspecies by many authors [3-7]. It is found in all Arabia and Iraq, commonly, amongst populations of U.a. aegyptia. Their potential contact zone is at the east of Wadi Araba (Jordan and Palestine) and at the east of Wadi Sawawin in the Jebel as-Sinfa region (Tabok) where members of both subspecies are found sympatri- cally, while taxa from Eastern Arabia are exclusively belonging to U. a. microlepis [3]. Recent molecular studies investigated the systematics of Uromastyx [8-12] but few biochemical studies have been conducted [12,5]. The present investigation aims to study the electropho- retic behavior of several isoenzymes and proteins for U. a. microlepis from different localities of its range in or- der to address the genetic variability within this subspe- cies. 2. MATERIALS AND METHODS 2.1. Samples At least, three samples of U. a. microlepis were collected  S. A. M. Amer / Advances in Bioscience and Biotechnology 2 (2011) 27-32 Copyright © 2011 SciRes. ABB 28 from each of four localities encompassing the different ecological habitats of the Saudi Arabian desert (Figure 1). These localities were Ushayrah, 70 km northeast to Taif, AlGwaih 200 km west to Riyadh, Nairyah 200 km west to Dammam and Mouileh 250 km Southwest to Tabok. Animals were taken to the lab, killed and dissected. Samples of blood and muscle tissues were taken and immediately frozen at - 80ºC. 2.2. SDS-Protein SDS-polyacrylamide gel electrophoresis was performed in 14 % acrylamide slab gels following the system of [13]. Protein extraction was conducted by homogenizing 1.0 g of tissue in 2 ml saline solution NaCl (0.9%) using a manual homogenizer. Samples were centrifuged at 5000 rpm for 10 min. The supernatants that contain pro- tein extract were kept deep-frozen until use for electro- phoresis analysis. A volume of 20 L protein extract was added to 10 L of treatment buffer. 20 L of the mixture was loaded in the gel. After electrophoresis, the gel was stained by commassie brilliant blue. The gel was de- stained after the appearance of bands and photographed. 2.3. Isoenzymes Six isoenzymes were used in this study: α and β-esterase (Est), acid phosphatase (Acph), alcohol dehydrogenase (Adh), aldehyde oxidase (Ao) and peroxidase (Px). Isoenzymes were electrophoresed in 10% native-poly- acrylamide gel as described by Stegemann et al. [14]. For isoenzyme extraction, 1.0 g of tissue was homoge- nized in 2 mL saline solution NaCl (0.9%) using a man- ual homogenizer. The homogenates were centrifuged Figure 1. A map with sample sites indicated (stars) and the entire distribution (circled area) of Uromastyx aegyptia micro- lepis. at 5000 rpm for 10 minutes and the supernatants were kept at -20ºC until use. For electrophoresis, 30 μL of the extract was mixed with 10 L of treatment bufferand 35 μL of this mixture was applied to the well. In gel stain- ing, protocols published for and -Est, Ao and Acph, Adh and Px were used [15-18]. Gels were washed two or three times with tap water; fixed in ethanol/ 20% glacial acetic acid (9:11 v/v) for 24 hours and photographed. 2.4. Statistics All gels of protein and isozyme electrophoresis were scanned using Gel Doc-2001 Bio-Rad system. For isoenzymes, the bands of enzyme activity were desig- nated using the known system of nomenclature [19]. An abbreviation which corresponds to the name of the en- zyme designated each locus. When multiple loci were involved, the fastest anodal protein band was designated as locus one, the next as locus two and so on. A similar- ity matrix of allele presence (1) and absence (0) was constructed and the dendrogram was obtained by the UPGMA method from NTSYS-pc package [20]. The similarity coefficient was calculated [21,22] as follows: 2 (number of sharing bands)/ number of bands in popu- lation A + number of bands in population B. 3. RESULTS AND DISCUSSION The number of protein bands that were obtained from this study varied between and within populations. A range of 7 to 14 bands were recognized in the pattern of the studied populations with minimum numbers in the samples of Taif and Riyadh and maximum numbers in Tabok (12 bands) and Dammam populations (12 bands) as measured by SDS-polyacrylamide electrophoresis (Table 1). The molecular weights of these bands showed a wide range between a maximum of 89 kDa and a minimum of 14 kDa. All samples studied recorded one shared band with a molecular weight of 33.534 kDa. There were no shared bands between populations at the extremes of the protein profile. The number of shared bands were 4, 9, 5 and 11 within Taif, Dammam, Riyadh and Tabok populations, respectively. When the different localities were compared, the number of shared bands were 3 between Taif and Dammam populations, 2 be- tween Taif and Riyadh populations, 4 between Taif and Tabok populations, 4 between Dammam and Riyadh populations, 9 between Dammam and Tabok populations and 5 between Riyadh and Tabok populations. Three unique bands were found in the Taif population at the molecular weight of 89, 88 and 60 kDa and two unique bands were shown in the Dammam population at 68 and 14 kDa. The electrophoretic banding of proteins indi- cated that the populations of the present study have sim- ilar bands within the molecular weight of the range be- 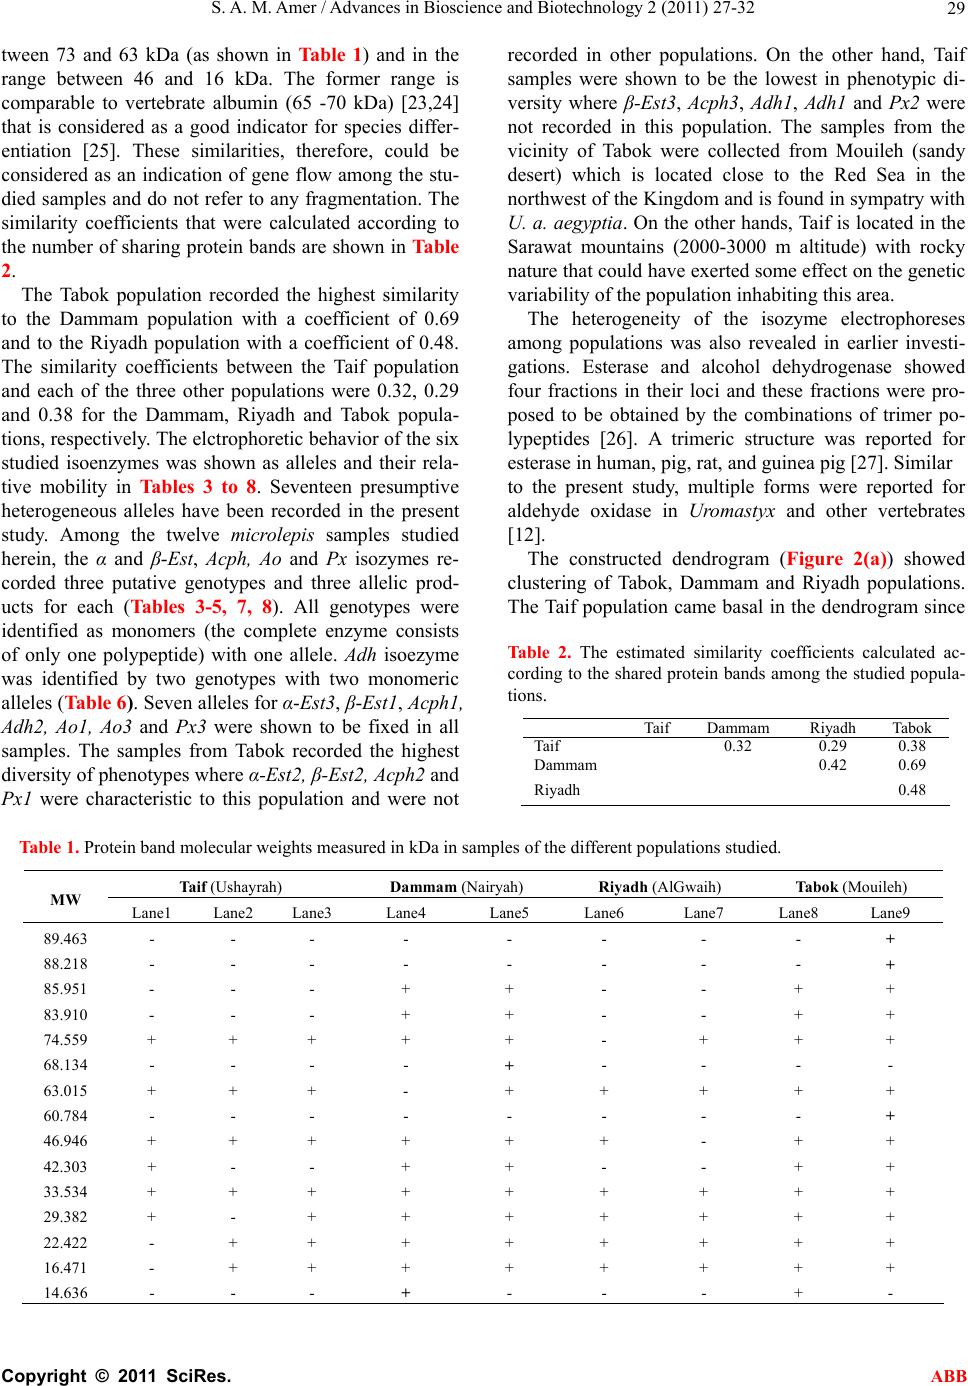 S. A. M. Amer / Advances in Bioscience and Biotechnology 2 (2011) 27-32 Copyright © 2011 SciRes. ABB 29 tween 73 and 63 kDa (as shown in Tab l e 1 ) and in the range between 46 and 16 kDa. The former range is comparable to vertebrate albumin (65 -70 kDa) [23,24] that is considered as a good indicator for species differ- entiation [25]. These similarities, therefore, could be considered as an indication of gene flow among the stu- died samples and do not refer to any fragmentation. The similarity coefficients that were calculated according to the number of sharing protein bands are shown in Table 2. The Tabok population recorded the highest similarity to the Dammam population with a coefficient of 0.69 and to the Riyadh population with a coefficient of 0.48. The similarity coefficients between the Taif population and each of the three other populations were 0.32, 0.29 and 0.38 for the Dammam, Riyadh and Tabok popula- tions, respectively. The elctrophoretic behavior of the six studied isoenzymes was shown as alleles and their rela- tive mobility in Tables 3 to 8. Seventeen presumptive heterogeneous alleles have been recorded in the present study. Among the twelve microlepis samples studied herein, the α and β-Est, Acph, Ao and Px isozymes re- corded three putative genotypes and three allelic prod- ucts for each (Tables 3-5, 7, 8). All genotypes were identified as monomers (the complete enzyme consists of only one polypeptide) with one allele. Ad h isoezyme was identified by two genotypes with two monomeric alleles (Table 6). Seven alleles for α-Est3, β-Est1, Acph1, Adh2, Ao1, Ao3 and Px3 were shown to be fixed in all samples. The samples from Tabok recorded the highest diversity of phenotypes where α-Est2, β-Est2, Acph2 and Px1 were characteristic to this population and were not recorded in other populations. On the other hand, Taif samples were shown to be the lowest in phenotypic di- versity where β-Est3, Acph3, Adh1, Adh1 and Px2 were not recorded in this population. The samples from the vicinity of Tabok were collected from Mouileh (sandy desert) which is located close to the Red Sea in the northwest of the Kingdom and is found in sympatry with U. a. aegyptia. On the other hands, Taif is located in the Sarawat mountains (2000-3000 m altitude) with rocky nature that could have exerted some effect on the genetic variability of the population inhabiting this area. The heterogeneity of the isozyme electrophoreses among populations was also revealed in earlier investi- gations. Esterase and alcohol dehydrogenase showed four fractions in their loci and these fractions were pro- posed to be obtained by the combinations of trimer po- lypeptides [26]. A trimeric structure was reported for esterase in human, pig, rat, and guinea pig [27]. Similar to the present study, multiple forms were reported for aldehyde oxidase in Uromastyx and other vertebrates [12]. The constructed dendrogram (Figure 2(a)) showed clustering of Tabok, Dammam and Riyadh populations. The Taif population came basal in the dendrogram since Table 2. The estimated similarity coefficients calculated ac- cording to the shared protein bands among the studied popula- tions. TaifDammam Riyadh Tabok Taif 0.32 0.29 0.38 Dammam 0.42 0.69 Riyadh 0.48 Table 1. Protein band molecular weights measured in kDa in samples of the different populations studied. Taif (Ushayrah) Dammam (Nairyah) Riyadh (AlGwaih) Tabok (Mouileh) MW Lane1 Lane2 Lane3 Lane4 Lane5 Lane6 Lane7 Lane8 Lane9 89.463 - - - - - - - - + 88.218 - - - - - - - - + 85.951 - - - + + - - + + 83.910 - - - + + - - + + 74.559 + + + + + - + + + 68.134 - - - - + - - - - 63.015 + + + - + + + + + 60.784 - - - - - - - - + 46.946 + + + + + + - + + 42.303 + - - + + - - + + 33.534 + + + + + + + + + 29.382 + - + + + + + + + 22.422 - + + + + + + + + 16.471 - + + + + + + + + 14.636 - - - + - - - + - 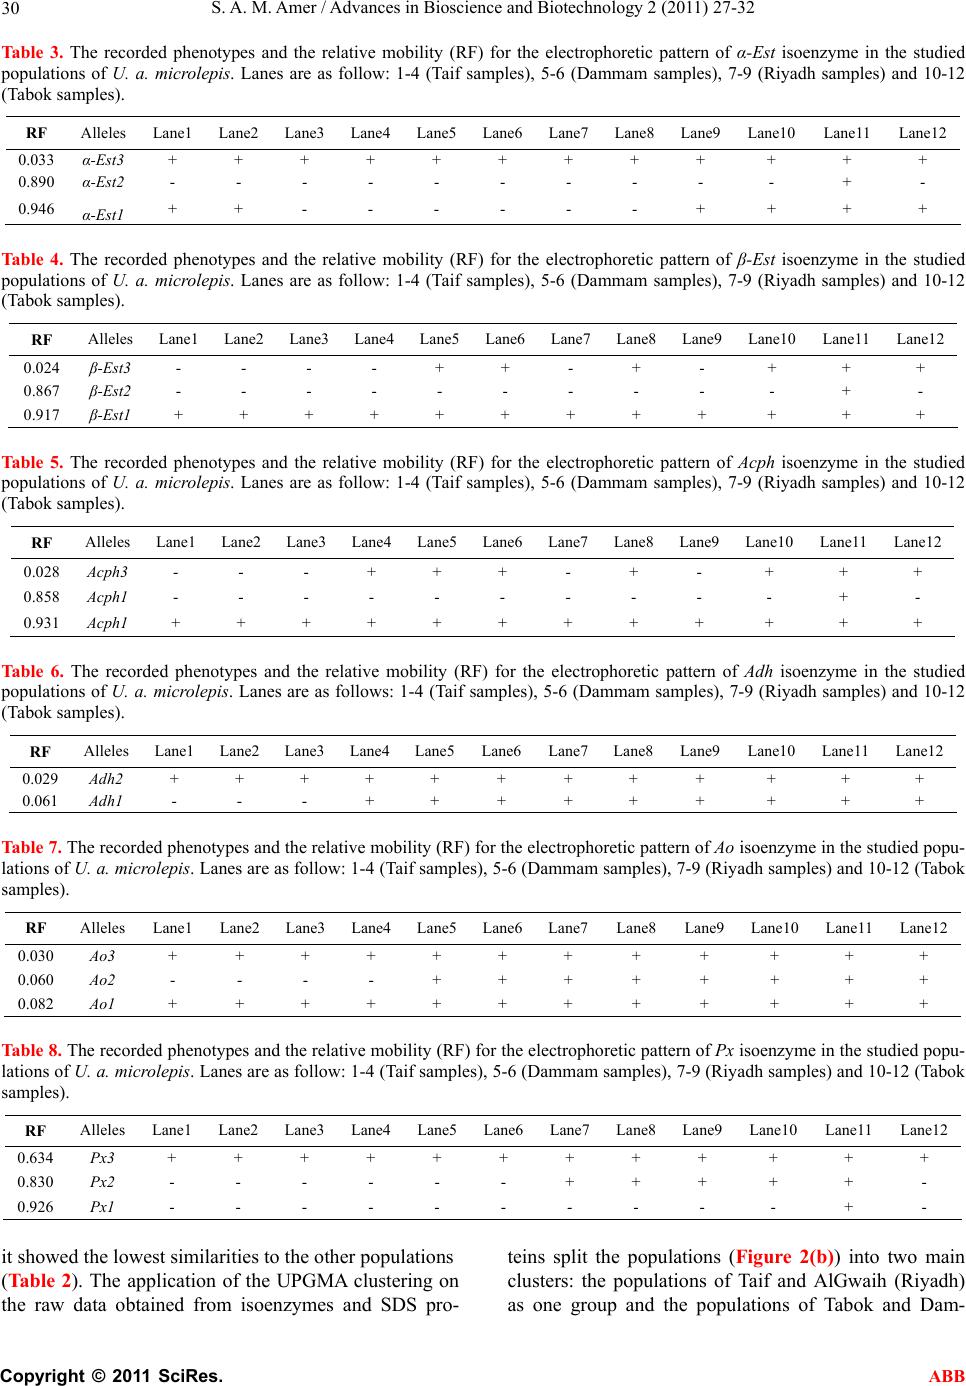 S. A. M. Amer / Advances in Bioscience and Biotechnology 2 (2011) 27-32 Copyright © 2011 SciRes. ABB 30 Ta b le 3. The recorded phenotypes and the relative mobility (RF) for the electrophoretic pattern of α-Est isoenzyme in the studied populations of U. a. microlepis. Lanes are as follow: 1-4 (Taif samples), 5-6 (Dammam samples), 7-9 (Riyadh samples) and 10-12 (Tabok samples). RF Alleles Lane1 Lane2 Lane3 Lane4 Lane5 Lane6Lane7Lane8Lane9Lane10 Lane11 Lane12 0.033 α-Est3 + + + + + + + + + + + + 0.890 α-Est2 - - - - - - - - - - + - 0.946 α-Est1 + + - - - - - - + + + + Table 4. The recorded phenotypes and the relative mobility (RF) for the electrophoretic pattern of β-Est isoenzyme in the studied populations of U. a. microlepis. Lanes are as follow: 1-4 (Taif samples), 5-6 (Dammam samples), 7-9 (Riyadh samples) and 10-12 (Tabok samples). RF Alleles Lane1 Lane2 Lane3 Lane4 Lane5 Lane6Lane7Lane8Lane9 Lane10 Lane11 Lane12 0.024 β-Est3 - - - - + + - + - + + + 0.867 β-Est2 - - - - - - - - - - + - 0.917 β-Est1 + + + + + + + + + + + + Ta ble 5. The recorded phenotypes and the relative mobility (RF) for the electrophoretic pattern of Acph isoenzyme in the studied populations of U. a. microlepis. Lanes are as follow: 1-4 (Taif samples), 5-6 (Dammam samples), 7-9 (Riyadh samples) and 10-12 (Tabok samples). RF Alleles Lane1 Lane2 Lane3 Lane4 Lane5 Lane6Lane7Lane8Lane9 Lane10 Lane11 Lane12 0.028 Acph3 - - - + + + - + - + + + 0.858 Acph1 - - - - - - - - - - + - 0.931 Acph1 + + + + + + + + + + + + Table 6. The recorded phenotypes and the relative mobility (RF) for the electrophoretic pattern of Adh isoenzyme in the studied populations of U. a. microlepis. Lanes are as follows: 1-4 (Taif samples), 5-6 (Dammam samples), 7-9 (Riyadh samples) and 10-12 (Tabok samples). RF Alleles Lane1 Lane2 Lane3 Lane4 Lane5Lane6 Lane7Lane8 Lane9Lane10 Lane11 Lane12 0.029 Adh2 + + + + + + + + + + + + 0.061 Adh1 - - - + + + + + + + + + Table 7. The recorded phenotypes and the relative mobility (RF) for the electrophoretic pattern of Ao isoenzyme in the studied popu- lations of U. a. microlepis. Lanes are as follow: 1-4 (Taif samples), 5-6 (Dammam samples), 7-9 (Riyadh samples) and 10-12 (Tabok samples). RF Alleles Lane1 Lane2 Lane3 Lane4Lane5Lane6Lane7Lane8Lane9 Lane10 Lane11 Lane12 0.030 Ao 3 + + + + + + + + + + + + 0.060 Ao 2 - - - - + + + + + + + + 0.082 Ao 1 + + + + + + + + + + + + Table 8. The recorded phenotypes and the relative mobility (RF) for the electrophoretic pattern of Px isoenzyme in the studied popu- lations of U. a. microlepis. Lanes are as follow: 1-4 (Taif samples), 5-6 (Dammam samples), 7-9 (Riyadh samples) and 10-12 (Tabok samples). RF Alleles Lane1 Lane2 Lane3 Lane4 Lane5 Lane6Lane7Lane8Lane9Lane10 Lane11 Lane12 0.634 Px3 + + + + + + + + + + + + 0.830 Px2 - - - - - - + + + + + - 0.926 Px1 - - - - - - - - - - + - it showed the lowest similarities to the other populations (Ta bl e 2). The application of the UPGMA clustering on the raw data obtained from isoenzymes and SDS pro- teins split the populations (Figure 2(b)) into two main clusters: the populations of Taif and AlGwaih (Riyadh) as one group and the populations of Tabok and Dam- 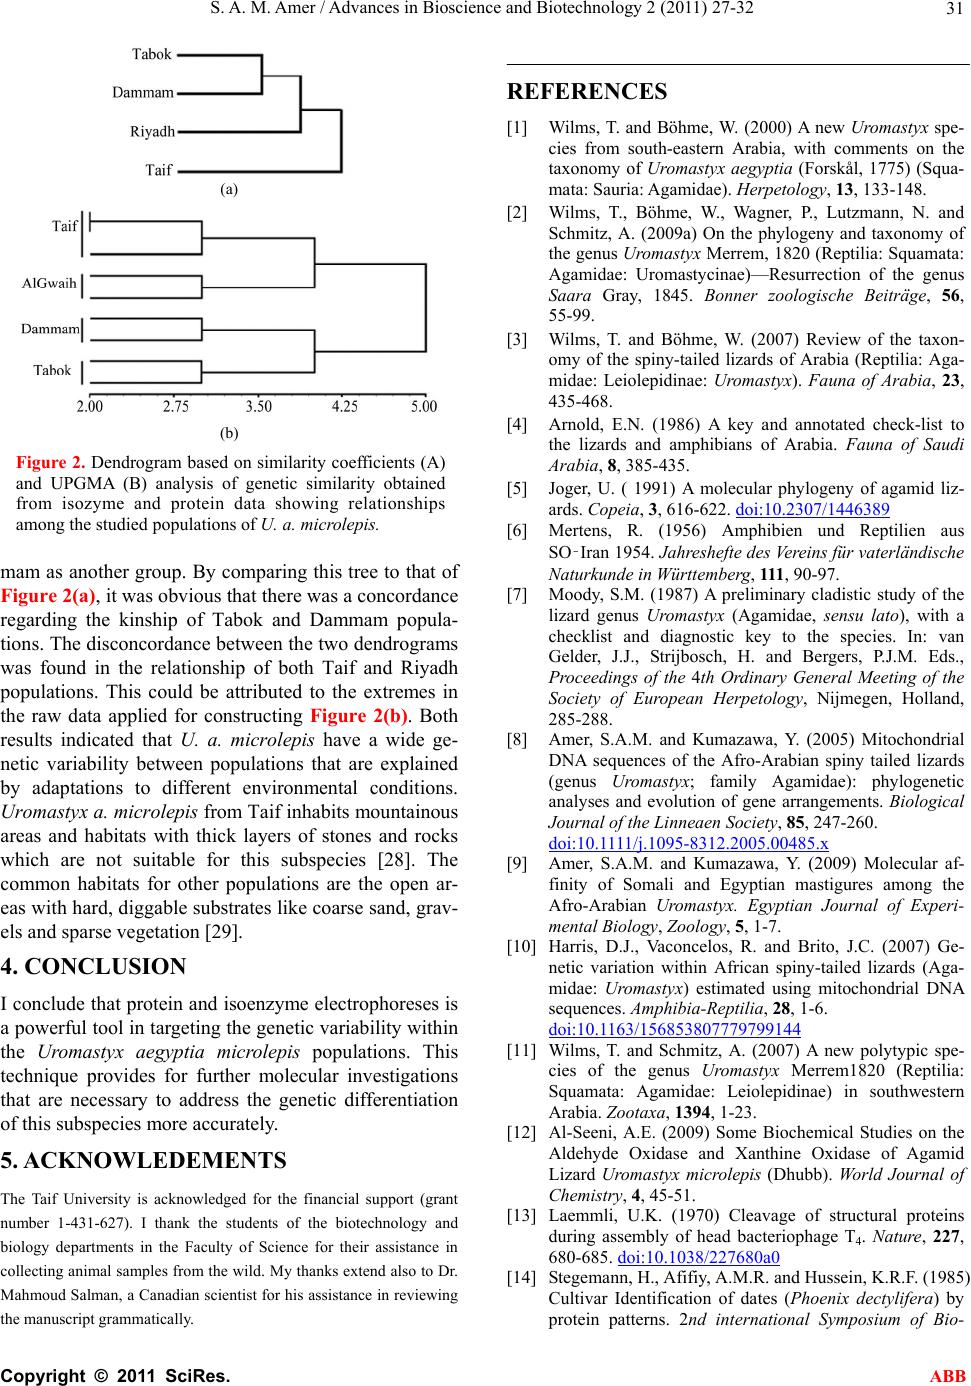 S. A. M. Amer / Advances in Bioscience and Biotechnology 2 (2011) 27-32 Copyright © 2011 SciRes. ABB 31 (a) (b) Figure 2. Dendrogram based on similarity coefficients (A) and UPGMA (B) analysis of genetic similarity obtained from isozyme and protein data showing relationships among the studied populations of U. a. microlepis. mam as another group. By comparing this tree to that of Figure 2(a), it was obvious that there was a concordance regarding the kinship of Tabok and Dammam popula- tions. The disconcordance between the two dendrograms was found in the relationship of both Taif and Riyadh populations. This could be attributed to the extremes in the raw data applied for constructing Figure 2(b). Both results indicated that U. a. microlepis have a wide ge- netic variability between populations that are explained by adaptations to different environmental conditions. Uromastyx a. microlepis from Taif inhabits mountainous areas and habitats with thick layers of stones and rocks which are not suitable for this subspecies [28]. The common habitats for other populations are the open ar- eas with hard, diggable substrates like coarse sand, grav- els and sparse vegetation [29]. 4. CONCLUSION I conclude that protein and isoenzyme electrophoreses is a powerful tool in targeting the genetic variability within the Uromastyx aegyptia microlepis populations. This technique provides for further molecular investigations that are necessary to address the genetic differentiation of this subspecies more accurately. 5. ACKNOWLEDEMENTS The Taif University is acknowledged for the financial support (grant number 1-431-627). I thank the students of the biotechnology and biology departments in the Faculty of Science for their assistance in collecting animal samples from the wild. My thanks extend also to Dr. Mahmoud Salman, a Canadian scientist for his assistance in reviewing the manuscript grammatically. REFERENCES [1] Wilms, T. and Böhme, W. (2000) A new Uromastyx spe- cies from south-eastern Arabia, with comments on the taxonomy of Uromastyx aegyptia (Forskål, 1775) (Squa- mata: Sauria: Agamidae). Herpetology, 13, 133-148. [2] Wilms, T., Böhme, W., Wagner, P., Lutzmann, N. and Schmitz, A. (2009a) On the phylogeny and taxonomy of the genus Uromastyx Merrem, 1820 (Reptilia: Squamata: Agamidae: Uromastycinae)—Resurrection of the genus Saara Gray, 1845. Bonner zoologische Beiträge, 56, 55-99. [3] Wilms, T. and Böhme, W. (2007) Review of the taxon- omy of the spiny-tailed lizards of Arabia (Reptilia: Aga- midae: Leiolepidinae: Uromastyx). Fauna of Arabia, 23, 435-468. [4] Arnold, E.N. (1986) A key and annotated check-list to the lizards and amphibians of Arabia. Fauna of Saudi Arabia, 8, 385-435. [5] Joger, U. ( 1991) A molecular phylogeny of agamid liz- ards. Copeia, 3, 616-622. doi:10.2307/1446389 [6] Mertens, R. (1956) Amphibien und Reptilien aus SO‑Iran 1954. Jahreshefte des Vereins für vaterländische Naturkunde in Württemberg, 111, 90-97. [7] Moody, S.M. (1987) A preliminary cladistic study of the lizard genus Uromastyx (Agamidae, sensu lato), with a checklist and diagnostic key to the species. In: van Gelder, J.J., Strijbosch, H. and Bergers, P.J.M. Eds., Proceedings of the 4th Ordinary General Meeting of the Society of European Herpetology, Nijmegen, Holland, 285-288. [8] Amer, S.A.M. and Kumazawa, Y. (2005) Mitochondrial DNA sequences of the Afro-Arabian spiny tailed lizards (genus Uromastyx; family Agamidae): phylogenetic analyses and evolution of gene arrangements. Biological Journal of the Linneaen Society, 85, 247-260. doi:10.1111/j.1095-8312.2005.00485.x [9] Amer, S.A.M. and Kumazawa, Y. (2009) Molecular af- finity of Somali and Egyptian mastigures among the Afro-Arabian Uromastyx. Egyptian Journal of Experi- mental Biology, Zoology, 5, 1-7. [10] Harris, D.J., Vaconcelos, R. and Brito, J.C. (2007) Ge- netic variation within African spiny-tailed lizards (Aga- midae: Uromastyx) estimated using mitochondrial DNA sequences. Amphibia-Reptilia, 28, 1-6. doi:10.1163/156853807779799144 [11] Wilms, T. and Schmitz, A. (2007) A new polytypic spe- cies of the genus Uromastyx Merrem1820 (Reptilia: Squamata: Agamidae: Leiolepidinae) in southwestern Arabia. Zootaxa, 1394, 1-23. [12] Al-Seeni, A.E. (2009) Some Biochemical Studies on the Aldehyde Oxidase and Xanthine Oxidase of Agamid Lizard Uromastyx microlepis (Dhubb). World Journal of Chemistry, 4, 45-51. [13] Laemmli, U.K. (1970) Cleavage of structural proteins during assembly of head bacteriophage T4. Nature, 227, 680-685. doi:10.1038/227680a0 [14] Stegemann, H., Afifiy, A.M.R. and Hussein, K.R.F. (1985) Cultivar Identification of dates (Phoenix dectylifera) by protein patterns. 2nd international Symposium of Bio-  S. A. M. Amer / Advances in Bioscience and Biotechnology 2 (2011) 27-32 Copyright © 2011 SciRes. ABB 32 chemical Approaches to Identification of Cultivars. Braunschweig, West Germany, 44 pp. [15] Scandalios, J.G. (1964) Tissue specific isozyme variation in maize. Journal of Heredity, 5, 281-285. [16] Wendel, J.F. and Weeden, N.F. (1989) Visualization and interpretation of plant isozymes. In: Soltis, D.E. and Soltis, P.S. Eds., Isozymes in Plant Biology, Chapman and Hall, London, 18. [17] Weeden, N.F. and Wendel, J.F. (1990) Genetics of plant isozymes. In: Soltis, D.E. and Soltis, P.S. Eds., Isozymes in plant biology, Chapman and Hall, London, 46-72. [18] Vallejos, C.E. (1983) Enzyme activity staining. In: Tanksley, S.D. and Orton, T.S., Eds., Isozymes in Plant Genetics and Breeding, Elsevier, Amsterdam, 469-516. [19] Allendorf, F.W. and Utter, F.M. (1978) Population genet- ics of fish. In: Hoar, W.S. and Randall, D.J., Eds., Fish Physiology, Academic Press, New York, 407-454. [20] Rohlf, F.J. (2000) NTSYS-pc numerical taxonomy and multivariate analysis system. Version 2.1. [21] Nei, M. and Li, W.H. (1979) Mathematical models for studying genetic variation in terms of restriction endonu- cleases. Proceeding of Natural Academy of Science, USA, 76, 5269-5273. doi:10.1073/pnas.76.10.5269 [22] Lynch, M. (1990) The similarity index and DNA finger- printing. Molecular Biology and Evolution, 5, 584-599. [23] Peters, T.J.R. (1996) In All about Albumin. Biochemistry, genetics and medical applications. Academic Press, San Diego, 1-166. [24] Metcalf, V.J., Bernnan, S.O., Chambers, G.K. and George, P.M. (1998) The albumin of the brown trout (Salmo trutta) is a glycoprotein. Biochemica et Bio- physica Acta, 1386, 90-96. [25] Ferguson, A. (1980) Biochemical systematics and evolu- tion. Glasgow and London, Blakie. [26] Junge, W. and Heymann, E. (1979) Characterization of the Isoenzymes of Pig-Liver Esterase.2-Kinetic studies. European Journal of Biochemistry, 95, 519-525. doi:10.1111/j.1432-1033.1979.tb12992.x [27] E. Heymann, E. (1980) Carboxylesterases and amidases. In: Jakoby, W.B., Eds., Enzymatic Basis of Detoxication, Academic press, New York, 2, 291-323. [28] Arnold, E.N. (1980) The Reptiles and Amphibians of Dhofar, Southern Arabia. Journal of Oman Studies, Spe- cial Report, 2, 273-332. [29] Wilms, T.M., Wagner, P., Shobrak, M. and Böhme, W. (2009b) Activity profiles, habitat selection and seasonal- ity of body weight in a population of Arabian spiny-tailed lizards (Uromastyx aegyptia microlepis Blanford, 1875; Sauria: Agamidae) in Saudi Arabia. Bonner zoologische Beiträge, 56, 259-272. |