Engineering, 2013, 5, 233-236
http://dx.doi.org/10.4236/eng.2013.510B048 Published Online October 2013 (http://www.scirp.org/journal/eng)
Copyright © 2013 SciRes. ENG
Data Fusion with Optimized Block Kernels in LS-SVM
for Protein Classification
Li Liao
Department of Computer and Information Sciences, University of Delaware, Newark, USA
Email: liliao@udel.edu
Received June 2013
ABSTRACT
In this work, we developed a method to efficiently optimize the kernel function for combined data of various different
sources with their corresponding kernels being already available. The vectorization of the combined data is achieved by
a weighted concatenation of the existing data vectors. This induces a kernel matrix composed of the existing kernels as
blocks along the main diagonal, weighted according to the corresponding the subspaces span by the data. The induced
block kernel matrix is optimized in the platform of least-squares support vector machines simultaneously as the
LS-SVM is being trained, by solving an extended set of linear equations, other than a quadratically constrained qua-
dratic programming as in a previous method. The method is tested on a benchmark dataset, and the performance is sig-
nificantly improved from the highest ROC score 0.84 using individual data source to ROC score 0.92 with data fusion.
Keywords: Data Fusion; Kernel Method; Support Vector Machines; Protein Classification
1. Introduction
Bioinformatics studies often involve analyzing large
amount of data from various sources. Data fusion, in
other words, how to combine various data sources in a
meaningful way, is crucial to the success of extracting
and selecting useful information and features for classi-
fication and prediction. Recent advances in kernel based
methods have made them a tool of choice for many bio-
informatics tasks. Although the latest developments show
that kernel based methods can be amicable to combining
data in straightforward ways, optimized data fusion in a
kernel ba s e d f r amework re mains cha llengi ng .
In [1], a statistical framework is presented for genomic
data fusion. Specifically, the method is based on the al-
gebra of kernels [2] to form a linear combination of indi-
vidual kernels that characterize pairwise relationship of
proteins from different data sources, such as sequence
similarity, hydropathy profile, and protein interactions.
These data sources contain different and thus partly in-
dependent and complementary information about pro-
teins, and combining them is expected to further enhance
the total information. Kernel method offers a very con-
venient way to resolve one key issue in data fusion: how
to deal with heterogeneous data in various formats. As
pointed out in [1], despite of various different formats
expression data as vectors or time series, sequence data
as strings of 20 alphabet, and pr otein-protein interactions
expressed as graphsevaluating the kernel on all pairs
of data points yields asymmetric, positive semi-definite
matrix known as the kernel matrix or the Gram matrix.
Intuitively, a kernel matrix can be regarded as a matrix of
generalized similarity measures among the data points.
Ref. [1] shows that a linear combination of kernel matric-
es, each derived from a different data source, offers an
effective way for data fusion, formalizing the meta-
learning task for the optimal weights as a quadratically
constrained quadratic programming problem. Like Ref.
[1], Ref. [3] uses weighted averaging to combine mul-
tiple kernels but develops faster algorithms relying on
quadratically constrained linear programming. Ref. [4 ]
treats a mix of base kernels as transformation learning
from a mixture of transformations and solves the result-
ing non-convex with a semidefinite relaxation for an ap-
proximate global solution.
In this work, we developed an alternative approach to
data fusion by forming an integrated kernel as a weighted
direct sum of the individual kernels in the framework of
Least-Square Support Vector Machine (LS-SVM), with
the advantage of combining the model training and
weight optimization altogether as solving a set of linear
equations. Tested on a benchmark dataset of transmem-
brane proteins, we demonstrate that our novel method
improves the classification performance significantly
from individual kernels, up to a ROC score 0.92, compa-
rable to what is reported in [1], and yet with the capa-
bility of removing the constraint requiring all individual
kernel matrices to have the same dimension.
L. LIAO
Copyright © 2013 SciRes. ENG
234
2. Method
As mentioned in the introduction, work in [1] bases its
method on the fact that basic algebraic operations such as
addition, multiplication and exponentiation preserve the
key property of po sitiv e s emi-definiteness for kernels [2].
Therefore, for a given set of kernels K1, K2, ..., Km, the
linear combination
(1)
also forms a kernel.
The authors in [1] show that this kernel can be opti-
mized by minimizing with respect to
µ
i under additional
trace and positive semi-definiteness constraints:
1
min max 2()()()
i
m
TT i
i
ediag yKdiag y
i
µαααµ α
=
(2)
subject to 0
α
C,
α
T y = 0, and
11
( ),0
mm
ii ii
ii
traceK cK
µµ
= =
= ≥
∑∑
In this work, we develop an alternative approach by
forming an integrated kernel as a weighted direct sum of
the individual kernels in the framework of Least-Square
Support Vector Machine, with the advantage of combin-
ing the model training and weight optimization altogether
as solving a set of linear equations. Another benefit is
that, unlike Equation (1), direct sum does not require all
individua l kerne l s to ha ve the same dimens ion.
Suppose there are n examples with a binary clas sifica-
tion,
k
x
, yk for k = 1,..., n, whe re yk, which can be +1 or
1, is the label for example k, and
k
x
is an
m
-dim
vector of attributes characterizing the example. The sup-
port vector machines (SVM) method solve the classifica-
tion problem with a linear model,
1
()( )
mi
i
i
h xwxbwxb
=
=+= ⋅+
 
(3)
where wi are the weights and b is the bias, the x is classi-
fied as the sign of
()hx
.
In least-squares SVMs [5], the weights and bias are
fixed by optimizing the margin
2
1
11
min[ ],
22
n
k
k
ww e
γ
=
⋅+

(4)
subject to the equality constraints for the training exam-
ples:
(5 )
where ek is the slack variable and
γ
is a parameter regula-
rizing the contribution from the marg in term and the
errorterm in Equation (4).
The optimization can be solved by introducing the
following Lagrangian
2
11
11
min[{[] 1},
22
nn
kkk kk
kk
wwey wxbe
γα
= =
⋅ +−⋅+−+
∑∑
 
(6)
where
α
k are Lagrangian multipliers. The conditions for
optimality can be derived from the stationary of the La-
grangian as the following.
0
k kk
k
Lw yx
w
α
=→=

00
kkk
Ly
b
σα
=→=
0,
kk
k
L
e
α γα
=→=
for k = 1 to n
0[] 10,
kk k
k
Lyw b e
α
α
= →⋅+−+=
for k = 1 to n
Now suppose the vector for example k is a weighted
direct sum of m vectors characterizing the example from
m different data sources:
12
12
12
1
m
kkk k
m
k kmk
mi
ik
i
xxx x
xx x
x
ββ β
β
=
= ⊕ ⊕⊕
= ⊕⊕⊕
= ⊕
 
 
(6)
where
β
i, for i = 1 to m, are the weights. Note that these
m vectors do not have to have the same dimension. Let di,
for i = 1 to m, are the dimensions for these m vector
spaces,
m
=
Σ
i=1 to m di. An d the d ot pro duct in the d irect
sum vector space is thus induced as direct product
2
1
1
()
()
mii
klikl
i
mii
iik l
i
xx xx
Kx x
β
µ
=
=
⋅= ⋅
= ⋅
 

(7)
we replace the dot product in each of the m vector spaces
with its corresponding kernel function Ki, and we intro-
duce the weights
2
ii
µβ
=
for summation of the individ-
ual kernels. Therefore, the final kernel matrix K is com-
posed of kernel matrices from individual sub vector
spaces in diagonal blocks, as vector components from
different data sources do not mix with one another in the
direct product. A schematic illustration for the block
kernel is shown in Figure 1. It is worth noting that al-
though direct sum, as a way of data integration, is fre-
quently used as concatenation of vectors from various
data sources, a kernel defined directly on the total vector
space is different from the block kernel, where it may
include non-zero values for off-diagonal blocks, which
indicate how “similar” the vectors from data sources
compare to one another. The block kernel introduced
here instead does not prescribe how to directly compare
data from different sources for integration.
1
m
ii
i
KK
µ
=
=
L. LIAO
Copyright © 2013 SciRes. ENG
235
Figure 1. Schematic illustration of blocked kernel induced
from direct sum of sub vector spaces.
By plugging the above two equations back into the La-
grangian, we o bt ai n the fol lowing set of li nea r equations.
1
[ ]1
n
kkllkl
l
kl
ybyyx x
δ
αγ
=
+⋅+ =

(8)
11
11 1
11
[ ((, ))] 1
[ ((,))()] 1
[(, ))]1
nm kl
kk lliikl
li
nm m
ii kl
kk lliikli
li i
nm ii kl
kkliklli
li
ybyyK xx
ybyyK xx
ybyyKxx
δ
αµ γ
δ
αµ µ
γ
δαµ
γ
= =
= ==
= =
+ +=
+ +=
+ +=
∑∑
∑∑ ∑
∑∑



(9)
These linear equations are solved using standard pro-
cedures such as QR decomposition; the solution opti-
mizes both the weights in the data fusion kernel and the
α
s, which together give rise to the maximum margin in
the support vector machine. Note that, in Craig and Liao
(2007) [6], an adaptive kernel is learned from weighted
dot product, namely, each component of the vector is
individually weighted. Here, instead, all components
from the sub vector space receive the same weight.
3. Results
The method is tested with a benchmark dataset as used in
[1], primarily for the sake of convenient comparison. The
dataset comprises proteins from the MIPS Comprehen-
sive Yeast Genome Database (CYGD) [7]. The CYGD
assigns 1125 yeast proteins to particular complexes, of
which 138 participate in the ribosome. The remaining
approximately 5000 yeast proteins are unlabeled. Simi-
larly, CYGD assigns subcellular locations to 2318 yeast
proteins, of which 497 belong to various membrane pro-
tein classes, leaving 4000 yeast proteins with uncertain
location. The data sources include sequence similarity
from BLAST, sequence similarity fr om Smith-Waterman,
Pfam domains, Hydropathy profile with FFT, PPI with
linear kernel, PPI with Diffusion kernel, and gene ex-
pression with radial basis kernel. The individual kernels,
which are centrally normalized by a procedure used in
[1], are listed in Table 1.
Table 1. Kernels and data sou rces.
Kernel Data Similarity measure
Ksw Protein sequences Smith-Waterman
KB Protein sequences BLAST
KPfam Protein sequences Pfam HMM
KFTT Hydropathy profile FFT
KD Protein interactions Diffusion kernel
KE Gene expression Radial basis kernel
The sequence-based kernel matrices are generated us-
ing the BLAST [8] and Smith-Waterman (SW) [9] pair-
wise sequence comparison algorithms, as first described
Liao and Noble [10]. Both algorithms use gap opening
and extension penalties of 11 and 1, and the BLOSUM
62 matrix. Because matrices of BLAST or Smith-Wa-
terman scores are not necessarily positive semi-definite,
we represent each protein as a vector of scores against all
other proteins. The similarity between proteins is then
computed as the inner product between the score vectors.
The Gram matrix thus obtained for a set of n proteins is
proved to be a valid kernel matrix [11]. The Pfam kernel
matrix KPfam is defined similarly as the KB and KSW but
by replacing the pairwise similarity scores with expecta-
tion values derived from hidden Markov models (HMMs)
in the Pfam database [12]. Details about these kernels
and other kernels can be found in [1]. Each data source is
first used individually for training a LS-SVM using their
corresponding kernel functions and then used in data
fusion mode as described above, namely, forming a
block kernel matrix. All trained models are tested with a
ten-fold cross validation scheme. The performance is
measured by the receiver optical characteristics (ROC)
score, which is the normalized area under a curve that
plots the number of the true positives as the number of
false positives as predicted by the trained LS-SVM when
a moving cutoff score scans from 1 to +1 [13]. The
ROC score is 1 for a perfect performance, whereas a
random predictor, which will uniformly mix up positives
and negatives, is expected to get a ROC score of 0.5.
Table 2 shows the ROC scores for classifying mem-
brane protein category using the various data sources and
the corresponding kernels, individually versus when all
are combined together by data fusion (ALL). It is easy to
see that the data fusion increases the performance,
achieving a ROC score 0.917, which is a significant jump
from the best ROC 0.835 using only one data source
Pfam domain. This performance is very close to the best
performance ROC 0.926 reported in [1]. Note that the
ROC score varies from individual data sources, and some
of them are significantly lower than their counterparts in
[1]. While the exact causes for such discrepancies are not
L. LIAO
Copyright © 2013 SciRes. ENG
236
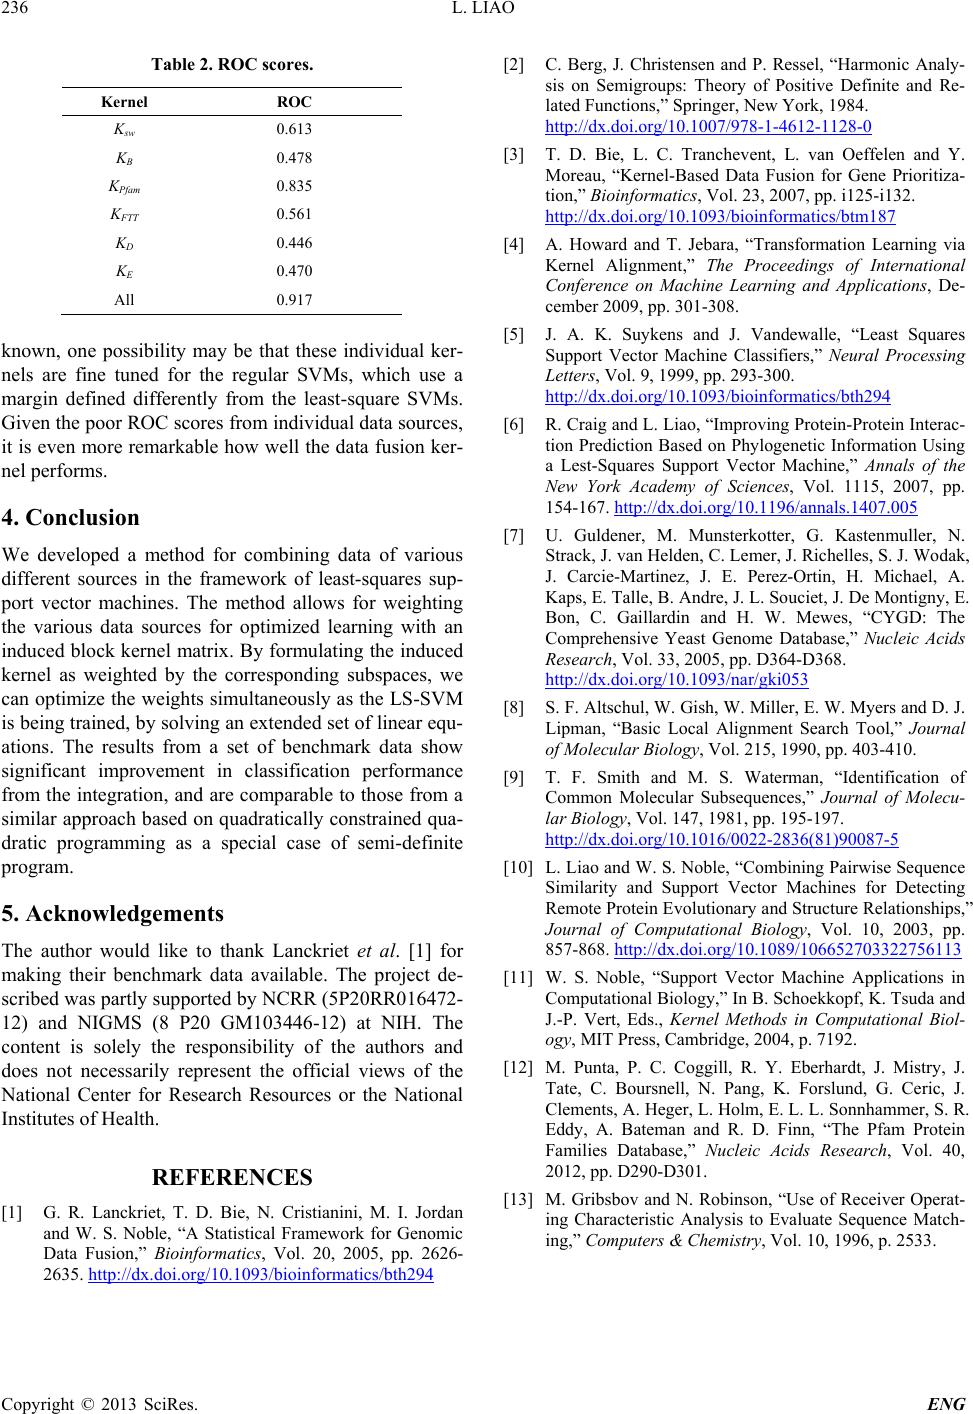
Table 2. ROC scores.
Kernel ROC
Ksw 0.613
KB 0.478
KPfam 0.835
KFTT 0.561
KD 0.446
KE 0.470
All 0.917
known, one possibility may be that these individual ker-
nels are fine tuned for the regular SVMs, which use a
margin defined differently from the least-square SVMs.
Given the poor ROC scores from individual data sources,
it is even more remarkable how well the data fusion ker-
nel performs.
4. Conclusion
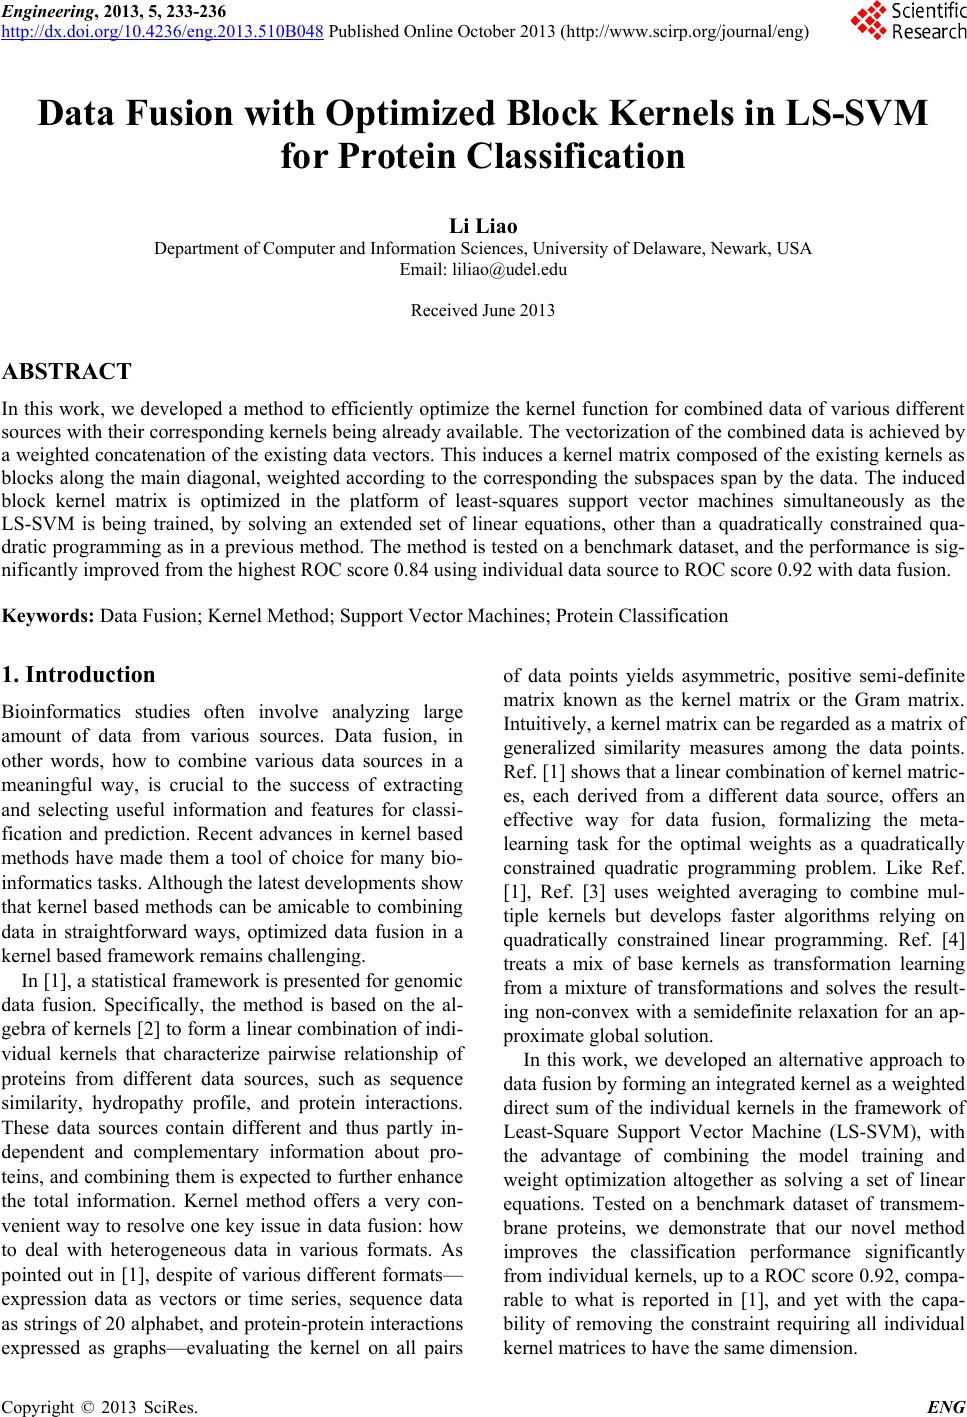
We developed a method for combining data of various
different sources in the framework of least-squares sup-
port vector machines. The method allows for weighting
the various data sources for optimized learning with an
induced block kernel matrix. By formulating the induced
kernel as weighted by the corresponding subspaces, we
can optimize the weights simultaneously as the LS-SVM
is being trained, by solving an extended set of linear equ-
ations. The results from a set of benchmark data show
significant improvement in classification performance
from the integration, and are comparable to those from a
similar appr oach based on quadratica lly constrained qua -
dratic programming as a special case of semi-definite
program.
5. Acknowledgements
The author would like to thank Lanckriet et al. [1] for
making their benchmark data available. The project de-
scribed was partly supported b y NCRR (5P2 0RR0164 72-
12) and NIGMS (8 P20 GM103446-12) at NIH. The
content is solely the responsibility of the authors and
does not necessarily represent the official views of the
National Center for Research Resources or the National
Institutes of Health.
REFERENCES
[1] G. R. Lanckriet, T. D. Bie, N. Cristianini, M. I. Jordan
and W. S. Noble, “A Statistical Framework for Genomic
Data Fusion,” Bioinformatics, Vol. 20, 2005, pp. 2626-
2635. http://dx.doi.org/10.1093/bioinformatics/bth294
[2] C. Berg, J. Christensen and P. Ressel, “Harmonic Analy-
sis on Semigroups: Theory of Positive Definite and Re-
lated Functions,” Springer, New York, 1984.
http://dx.doi.org/10.1007/978-1-4612-1128-0
[3] T. D. Bie, L. C. Tranchevent, L. van Oeffelen and Y.
Moreau, “Kernel-Based Data Fusion for Gene Prioritiza-
tion,” Bioinformatics, Vol. 23, 2007, pp. i125-i132.
http://dx.doi.org/10.1093/bioinformatics/btm187
[4] A. Howard and T. Jebara, “Transformation Learning via
Kernel Alignment,” The Proceedings of International
Conference on Machine Learning and Applications, De-
cember 2009, pp. 301-308.
[5] J. A. K. Suykens and J. Vandewalle, “Least Squares
Support Vector Machine Classifiers,” Neural Processing
Letters, Vol. 9, 1999, pp. 293-300.
http://dx.doi.org/10.1093/bioinformatics/bth294
[6] R. Craig and L. Liao, “Improving Protein-Protein Interac-
tion Prediction Based on Phylogenetic Information Using
a Lest-Squares Support Vector Machine,” Annals of the
New York Academy of Sciences, Vol. 1115, 2007, pp.
154-167. http://dx.doi.org/10.1196/annals.1407.005
[7] U. Guldener, M. Munsterkotter, G. Kastenmuller, N.
Strack, J. van Helden, C. Lemer, J. Richelles, S. J. Wodak,
J. Carcie-Martinez, J. E. Perez-Ortin, H. Michael, A.
Kaps, E. Talle, B. Andre, J. L. Souciet, J. De Montigny, E.
Bon, C. Gaillardin and H. W. Mewes, “CYGD: The
Comprehensive Yeast Genome Database,” Nucleic Acids
Research, Vol. 33, 2005, pp. D364-D368.
http://dx.doi.org/10.1093/nar/gki053
[8] S. F. Altsc hul, W. Gish, W. Miller, E. W. My ers and D. J .
Lipman, “Basic Local Alignment Search Tool,” Journal
of Molecular Biology, Vol. 215, 1990, pp. 403-410.
[9] T. F. Smith and M. S. Waterman, “Identification of
Common Molecular Subsequences,” Journal of Molecu-
lar Biology, Vol. 147, 1981, pp. 195-197.
http://dx.doi.org/10.1016/0022-2836(81)90087-5
[10] L. Liao and W. S. Noble, “Combining Pairwise Sequence
Similarity and Support Vector Machines for Detecting
Remote Protein Evolutionary and Structure Relationships,”
Journal of Computational Biology, Vol. 10, 2003, pp.
857-868. http://dx.doi.org/10.1089/106652703322756113
[11] W. S. Noble, “Support Vector Machine Applications in
Computational Biology,” In B. Schoekkopf, K. Tsuda and
J.-P. Vert, Eds., Kernel Methods in Computational Biol-
ogy, MIT Press, Cambridge, 2004, p. 7192.
[12] M. Punta, P. C. Coggill, R. Y. Eberhardt, J. Mistry, J.
Tate, C. Boursnell, N. Pang, K. Forslund, G. Ceric, J.
Clements, A. Heger, L. Hol m, E . L. L. Sonnhammer, S. R.
Eddy, A. Bateman and R. D. Finn, “The Pfam Protein
Families Database,Nucleic Acids Research, Vol. 40,
2012, pp. D290-D301.
[13] M. Gribsbov and N. Robinson, “Use of Receiver Operat-
ing Characteristic Analysis to Evaluate Sequence Match-
ing,” Computers & Chemistry, Vol. 10, 1996, p. 2533.