Paper Menu >>
Journal Menu >>
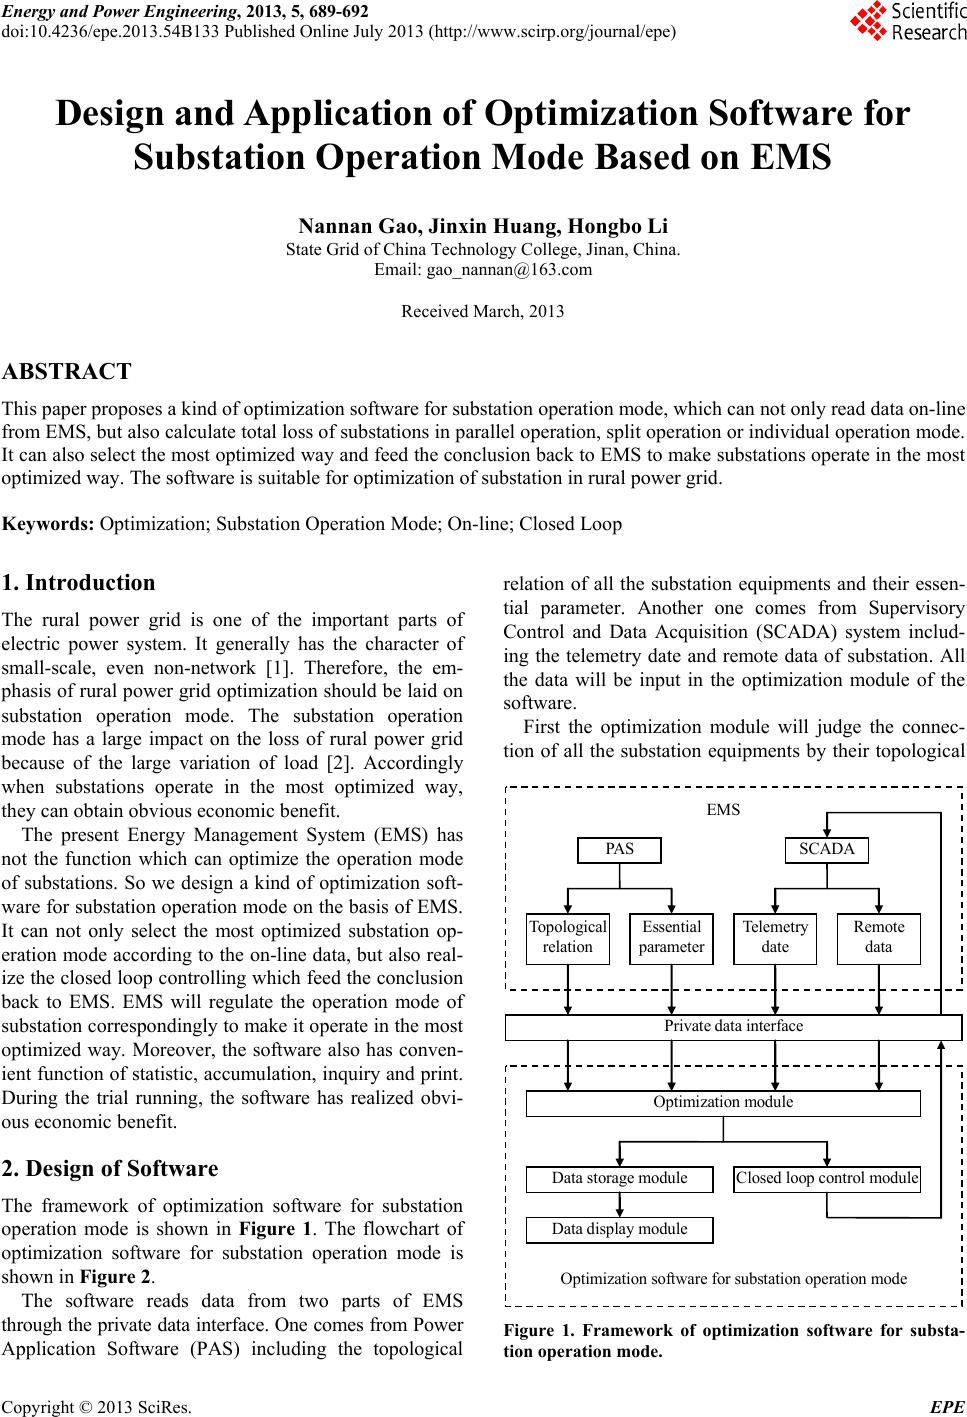 Energy and Power Engineering, 2013, 5, 689-692 doi:10.4236/epe.2013.54B133 Published Online July 2013 (http://www.scirp.org/journal/epe) Design and Application of Optimization Software for Substation Operation Mode Based on EMS Nannan Gao, Jinxin Huang, Hongbo Li State Grid of China Technology College, Jinan, China. Email: gao_nannan@163.com Received March, 2013 ABSTRACT This paper proposes a kind of optimization software for substation operation mode, which can not only read data on-line from EMS, but also calculate total loss of substatio ns in parallel op eration, split op eration or individua l operation mode. It can also select the most optimized way and feed the conclusion back to EMS to make substations operate in the most optimized way. The software is suitable for optimization of substation in rural power grid. Keywords: Optimization; Substation Operation Mode; On-line; Closed Loop 1. Introduction The rural power grid is one of the important parts of electric power system. It generally has the character of small-scale, even non-network [1]. Therefore, the em- phasis of rural power grid optimization should be laid on substation operation mode. The substation operation mode has a large impact on the loss of rural power grid because of the large variation of load [2]. Accordingly when substations operate in the most optimized way, they can obtain obvious economic b e nefit. The present Energy Management System (EMS) has not the function which can optimize the operation mode of substations. So we design a kind of optimization soft- ware for substation operation mode on the basis of EMS. It can not only select the most optimized substation op- eration mode according to the on-line data, but also real- ize the closed loop con trolling which feed the conclusion back to EMS. EMS will regulate the operation mode of substation correspo ndingly to make it op erate in the most optimized way. Moreover, the software also has conven- ient function of statistic, accumulation, inquiry and print. During the trial running, the software has realized obvi- ous economic benefit. 2. Design of Software The framework of optimization software for substation operation mode is shown in Figure 1. The flowchart of optimization software for substation operation mode is shown in Figure 2. The software reads data from two parts of EMS through the private data interface. One co mes from Power Application Software (PAS) including the topological relation of all the substation equipments and their essen- tial parameter. Another one comes from Supervisory Control and Data Acquisition (SCADA) system includ- ing the telemetry date and remote data of substation. All the data will be input in the optimization module of the software. First the optimization module will judge the connec- tion of all the substation equipments by their topological PAS Topological relation Essential parameter SCADA Telemetry date Remote data Private data interface Optimiz a t ion module Data storage module Closed loop control module Data display module EMS Optimization software for substation operation mode Figure 1. Framework of optimization software for substa- tion operation mode. Copyright © 2013 SciRes. EPE 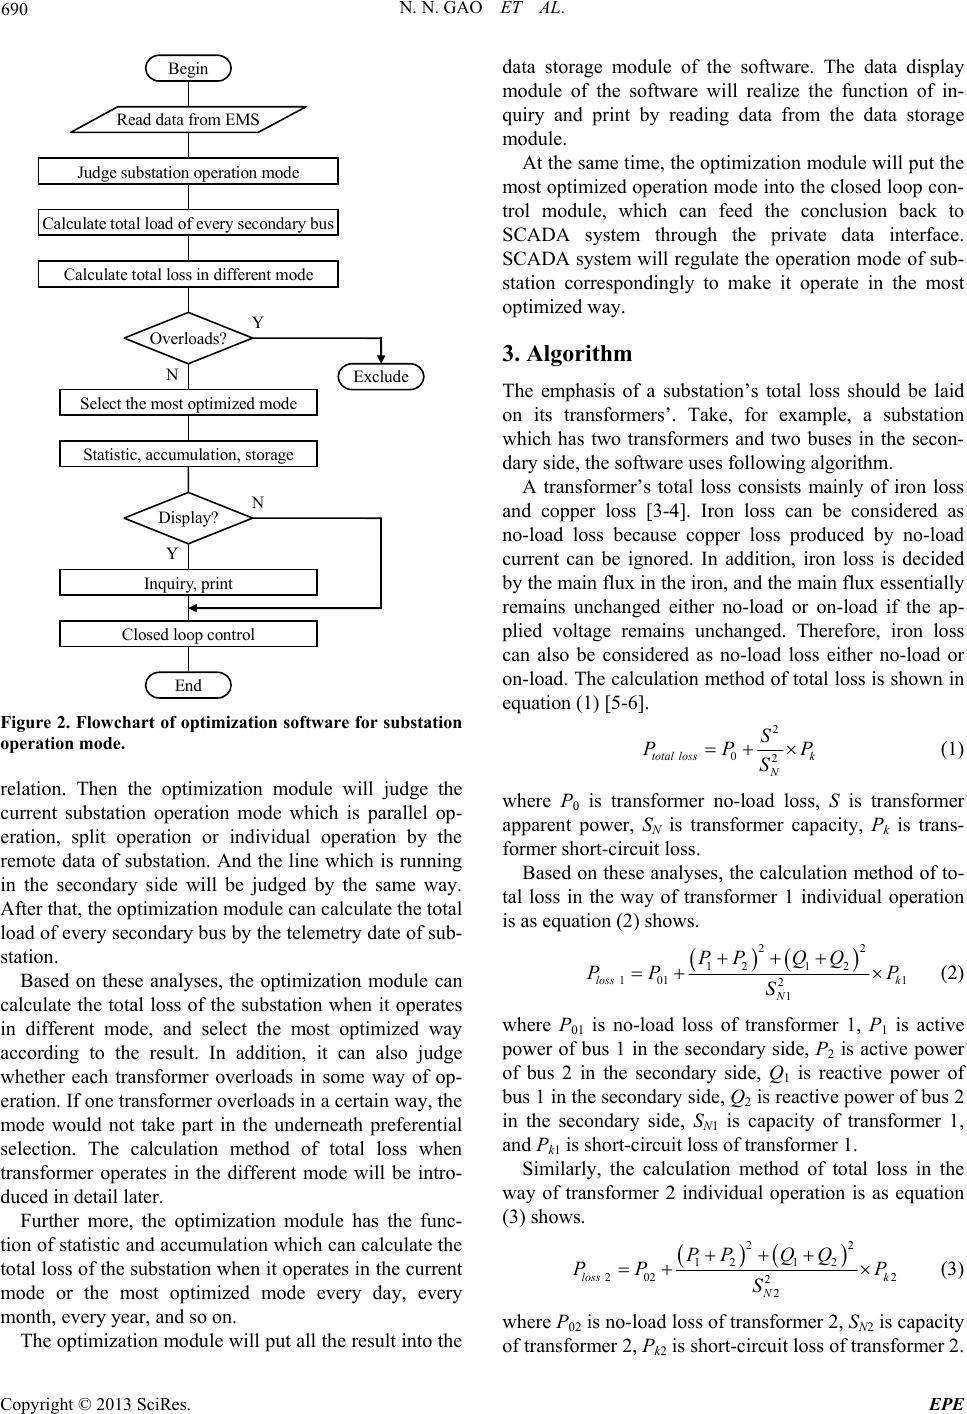 N. N. GAO ET AL. 690 Begin Read data from EMS Judge substation operation mode Calculate total load of every secondary bus Calculate to tal loss in dif ferent mode Overloads? N Y Select the most optimized mode Exclude Statistic, accumulati on, storage Display? Y N Inquiry, print Closed loop control End Figure 2. Flowchart of optimization software for substation operation mode. relation. Then the optimization module will judge the current substation operation mode which is parallel op- eration, split operation or individual operation by the remote data of substation. And the line which is running in the secondary side will be judged by the same way. After that, the optimization module can calculate th e total load of every second ary bus by the telemetry d ate of sub- station. Based on these analyses, the optimization module can calculate the total loss of the substation when it operates in different mode, and select the most optimized way according to the result. In addition, it can also judge whether each transformer overloads in some way of op- eration. If one transformer overloads in a certain way, th e mode would not take part in the underneath preferential selection. The calculation method of total loss when transformer operates in the different mode will be intro- duced in detail later. Further more, the optimization module has the func- tion of statistic and accumulation which can calculate th e total loss of the substation when it operates in the current mode or the most optimized mode every day, every month, every year, and so on. The optimization module will p ut all the result in to the data storage module of the software. The data display module of the software will realize the function of in- quiry and print by reading data from the data storage module. At the same time, the optimization module will put the most optimized operation mode into the closed loop con- trol module, which can feed the conclusion back to SCADA system through the private data interface. SCADA system will regulate the operation mode of sub- station correspondingly to make it operate in the most optimized way. 3. Algorithm The emphasis of a substation’s total loss should be laid on its transformers’. Take, for example, a substation which has two transformers and two buses in the secon- dary side, the software uses following algorithm. A transformer’s total loss consists mainly of iron loss and copper loss [3-4]. Iron loss can be considered as no-load loss because copper loss produced by no-load current can be ignored. In addition, iron loss is decided by the main flux in th e iron, and the main flux essentially remains unchanged either no-load or on-load if the ap- plied voltage remains unchanged. Therefore, iron loss can also be considered as no-load loss either no-load or on-load. The calculation method of total loss is shown in equation (1) [5-6]. 2 0 2 total lossk N S PP SP (1) where P0 is transformer no-load loss, S is transformer apparent power, SN is transformer capacity, Pk is trans- former short-circuit loss. Based on these analyses, the calculation method of to- tal loss in the way of transformer 1 individual operation is as equation (2) shows. 22 121 2 101 21 loss k N PP QQ PP P S 1 (2) where P01 is no-load loss of transformer 1, P1 is active power of bus 1 in the secondary side, P2 is active power of bus 2 in the secondary side, Q1 is reactive power of bus 1 in the secondary side, Q2 is reactive power of bus 2 in the secondary side, SN1 is capacity of transformer 1, and Pk1 is short-circuit loss of transformer 1. Similarly, the calculation method of total loss in the way of transformer 2 individual operation is as equation (3) shows. 22 121 2 20222 loss k N PP QQ PP P S 2 (3) where P02 is no-load loss of transformer 2, SN2 is capacity of transformer 2, Pk2 is short-circuit loss of transformer 2. Copyright © 2013 SciRes. EPE 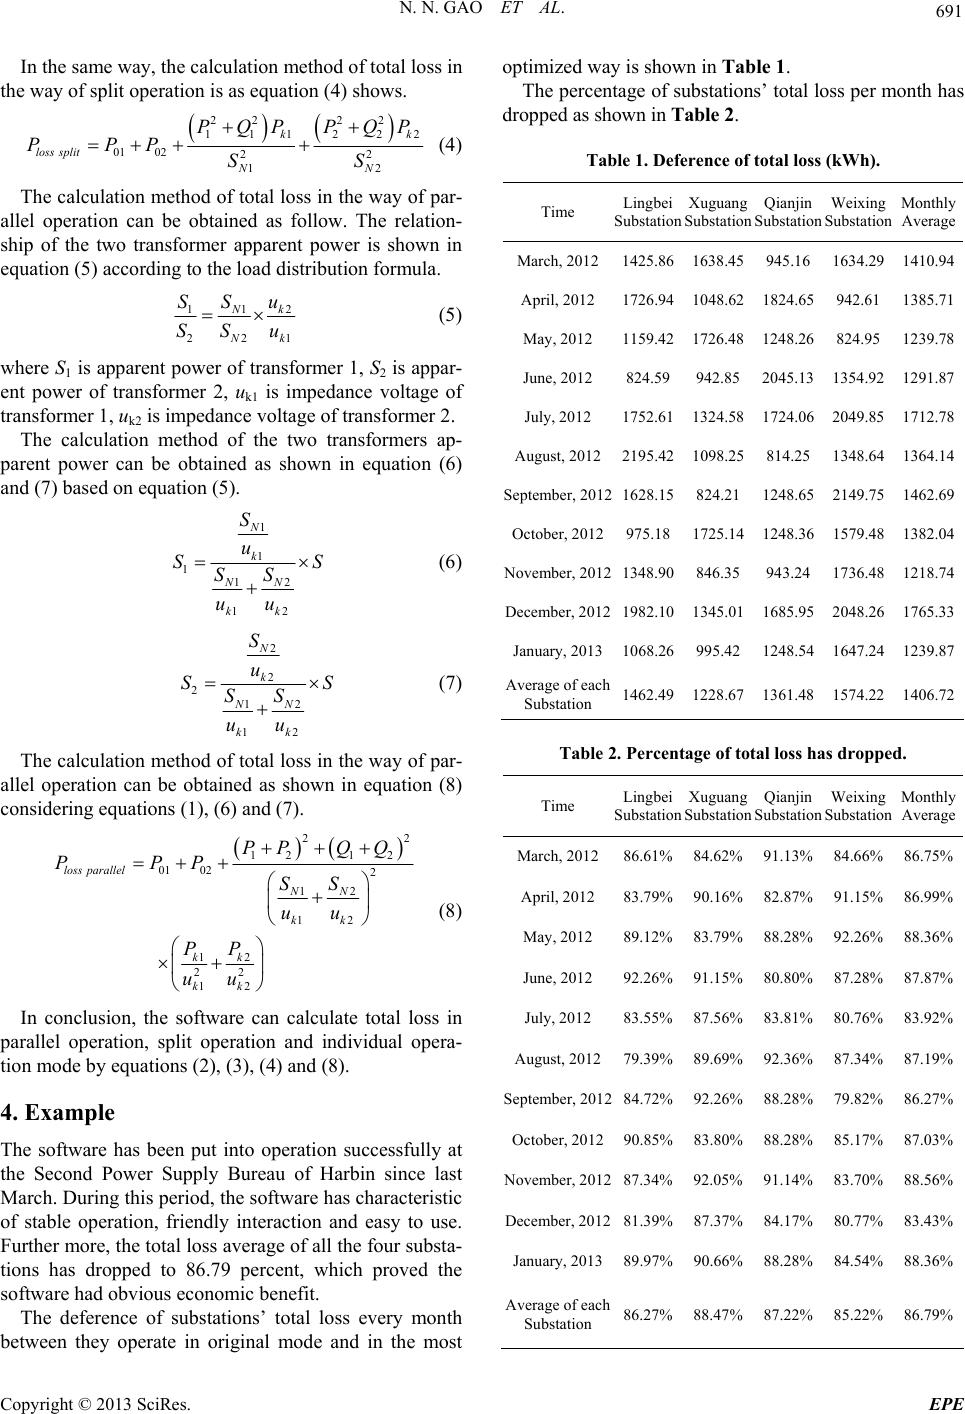 N. N. GAO ET AL. 691 In the same way, the calculation method of total loss in the way of split operation is as equation (4) shows. 22 22 111222 010222 12 kk loss split NN PQP PQP PPP SS (4) The calculation method of total loss in the way of par- allel operation can be obtained as follow. The relation- ship of the two transformer apparent power is shown in equation (5) according to the load distribution formula. 1 1 22 2 1 N k N k Su S SS u (5) where S1 is apparent power of transformer 1, S2 is appar- ent power of transformer 2, uk1 is impedance voltage of transformer 1, uk2 is impedance voltage of transformer 2. The calculation method of the two transformers ap- parent power can be obtained as shown in equation (6) and (7) based on equation (5). 1 1 112 12 N k NN kk S u S SS uu S (6) 2 2 212 12 N k NN kk S u S SS uu S (7) The calculation method of total loss in the way of par- allel operation can be obtained as shown in equation (8) considering equations (1), (6) and (7). 22 121 2 01022 12 12 12 22 12 loss parallel NN kk kk kk PP QQ PPP SS uu PP uu (8) In conclusion, the software can calculate total loss in parallel operation, split operation and individual opera- tion mode by equations (2), (3), (4) and (8). 4. Example The software has been put into operation successfully at the Second Power Supply Bureau of Harbin since last March. During this period, the software has characteristic of stable operation, friendly interaction and easy to use. Further more, the total loss average of all the four substa- tions has dropped to 86.79 percent, which proved the software had obvious economic benefit. The deference of substations’ total loss every month between they operate in original mode and in the most optimized way is shown in Table 1. The percentage of substations’ total loss per month has dropped as shown in Table 2. Table 1. Deference of total loss (kWh). Time Lingbei Substation Xuguang Substation Qianjin Substation Weixing Substation Monthly Average March, 20121425.861638.45 945.16 1634.291410.94 April, 2012 1726.941048.62 1824.65 942.611385.71 May, 2012 1159.421726.48 1248.26 824.951239.78 June, 2012 824.59942.85 2045.13 1354.921291.87 July, 2012 1752.611324.58 1724.06 2049.851712.78 August, 20122195.421098.25 814.25 1348.641364.14 September, 20121628.15824.21 1248.65 2149.751462.69 October, 2012975.181725.14 1248.36 1579.481382.04 November, 20121348.90846.35 943.24 1736.481218.74 December, 20121982.101345.01 1685.95 2048.261765.33 January, 20131068.26995.42 1248.54 1647.241239.87 Average of each Substation 1462.491228.67 1361.48 1574.221406.72 Table 2. Percentage of total loss has dropped. Time Lingbei Substation Xuguang Substation Qianjin Substation Weixing Substation Monthly Average March, 201286.61%8 4.62% 91.13% 84.66%86.75% April, 2012 83.79%90.16% 82.87% 91.15%86.99% May, 2012 89.12%83.79% 88.28% 92.26%88.36% June, 2012 92.26%91.15% 80. 80% 87.28%87.87% July, 2012 83.55%87.56% 83.81% 80.76%83.92% August, 201279.39%89.69% 92.36% 87.34%87.19% September, 201284.72%92.26% 88.28% 79.82%86.27% October, 201290.85%83.80% 88.28% 85.17%87.03% November, 201287.34%92.05% 91.14% 83.70%88.56% December, 201281.39%87.37% 84.17% 80.77%83.43% January, 201389.97%90.66% 88.28% 84.54%88.36% Average of each Substation 86.27%88.47% 87.22% 85.22%86.79% Copyright © 2013 SciRes. EPE  N. N. GAO ET AL. Copyright © 2013 SciRes. EPE 692 5. Conclusions The optimization software for substation operation mode is suitable for optimization of substation in rural power grid. It can not only read data on-line from EMS, but also calculate total loss of substations when parallel operation, split operation or individual operation, and select the most optimized way, as well as feed the conclusion back to EMS to make substations operate in the most opti- mized way. The software has obvious economic benefit during the trial operation. REFERENCES [1] X. Q. Wang, “Discussion on the Methods and Measures of Reducing Rural Power Grid Loss,” China Electric Power (Technology Edition), No. 10, 2012. [2] M. Zhao and H. W. Tang, “Research of Reasonable Dis- tribution Modes of Rural Power Grids,” Journal of China Agricultural University, No. 4, 2012. [3] F. H. Li, T. M. Chen, F. S. Zheng, L. Z. Zhang and D. Q. Zhu, “Electromechanics,” 2nd Edition, Beijing: Science Press, 1991, pp. 12-39 and 74-76. [4] J. Liu, “Discussion and Analysis of Transformer Loss Calculation,” Equipment Manufacturing Technology, No. 11, 2012. [5] J. S. Hu, “Transformer Economic Operation,” Beijing: China Electric Power Press, 1999, pp. 19-44. [6] J. L. Xu, “Method to Reduce Power Transformer Loss,” Electrotechnics Electric, No. 3, 2012. |