Engineering, 2013, 5, 207-213
http://dx.doi.org/10.4236/eng.2013.510B044 Published Online October 2013 (http://www.scirp.org/journal/eng)
Copyright © 2013 SciRes. ENG
A Study of Safety Evaluation Method for Medical
Diagnostic Table
Xiaoyan Zhang, Jia Liu, Jun Guo, Lei Feng
MICT Engineering Department, GE Hangwei Health Care Co. Ltd., Beijing, China
Email: Xiaoyan.zhang@ge.com
Received May 2013
ABSTRACT
Medical diagnostic tables are widely used in the medical diagnostic equipment. For multifarious diagnostic needs, the
medical diagnostic table works in various operating modes. In order to ensure patient safety, safety factor of medical
diagnostic table must meet safety requirement. The paper puts forw ard a method to find relations between key parame-
ters and stress of table, identify maximum stress modes, reduce modes number of load test, and remove conservative
high stress areas from finite element analysis result, by synthesizing the stress result of finite element analysis and
measurement data for various operating modes of medical diagnostic table. It will help shorten test time, avoid over
strength design, and reduce tables cost. An application example of the method is presented by evaluating a specific CT
medical diagnostic table. This method can be a reference for safety evaluation of all medical diagnostic tables.
Keywords: Medical Diagnostic; CT Table; Medical Equipment; Safety Factor; Stress
1. Introduction
Medical diagnostic tables are widely used in the medical
diagnostic equipment. Usually there are CT scan table [1],
MR table, X-ray table, PET table, surgery table and so on
[2]. There are various supporting structure designs for
medical diagnostic tables, such as scissor, actuator, pa-
rallelogram structure, and so on.
Supporting parts will bear stress. IEC60601-1 third
edition [3] and relative standards require the minimum
safety factor of supporting parts should be m or e than 2. 5.
When a medical diagnostic table is designed, finite
element analysis is executed firstly for the supporting
parts. Using the finite element analysis result, we can
find high stress areas in the parts. Because of the com-
plexity of boundary constrain and the arithmetic limita-
tion of the finite element analysis method, some high
stress areas found are conservative. Over design will
happen, if the design only relies on the result of finite
element analysis. Therefore actual strain or stress mea-
surement in high stress area is necessary.
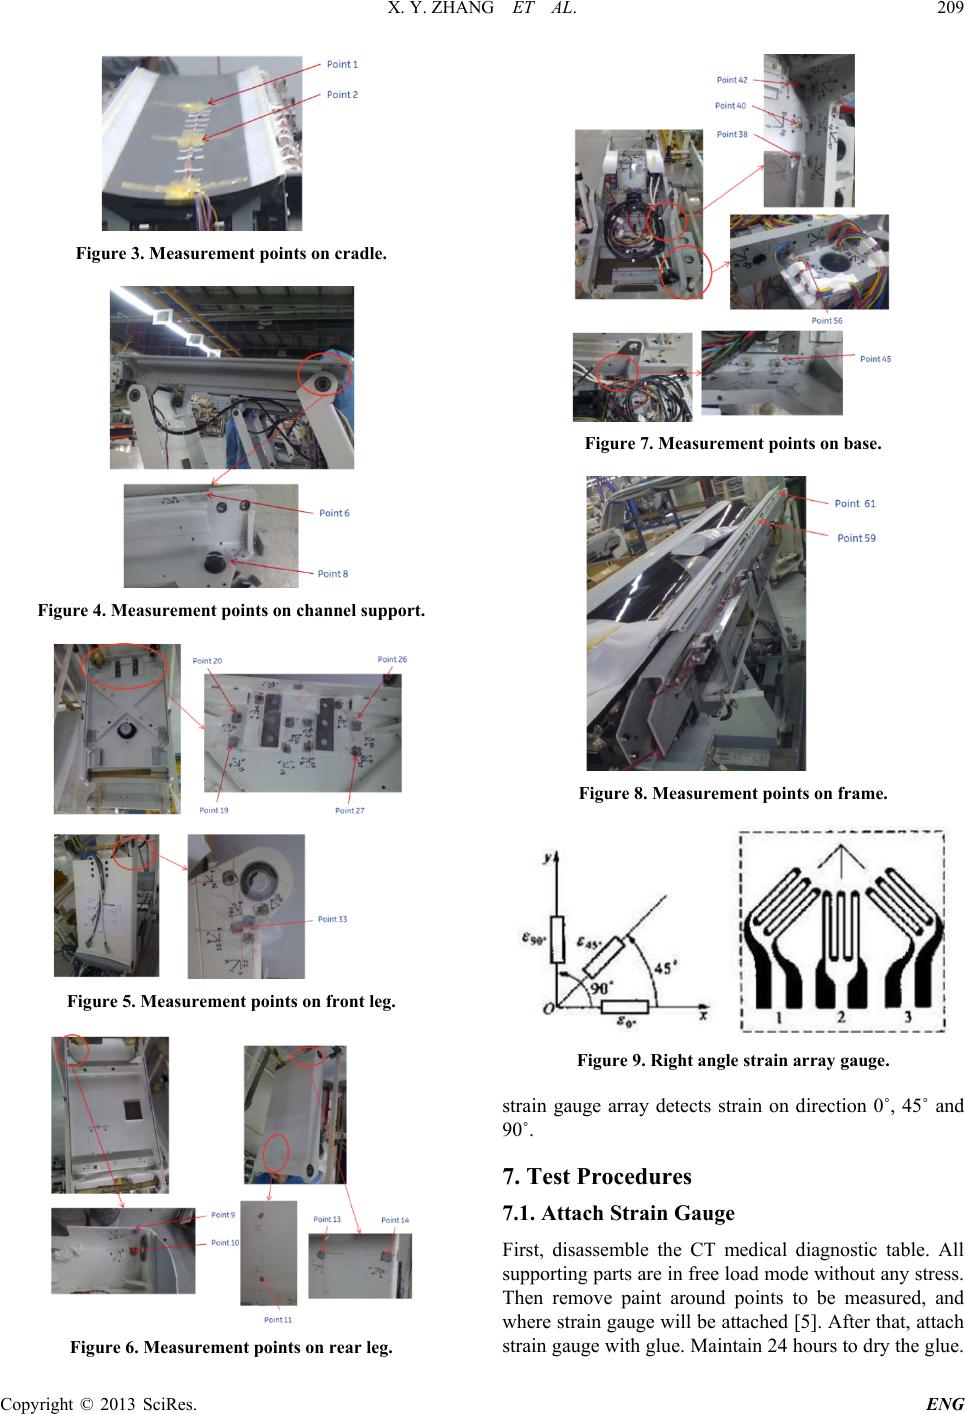
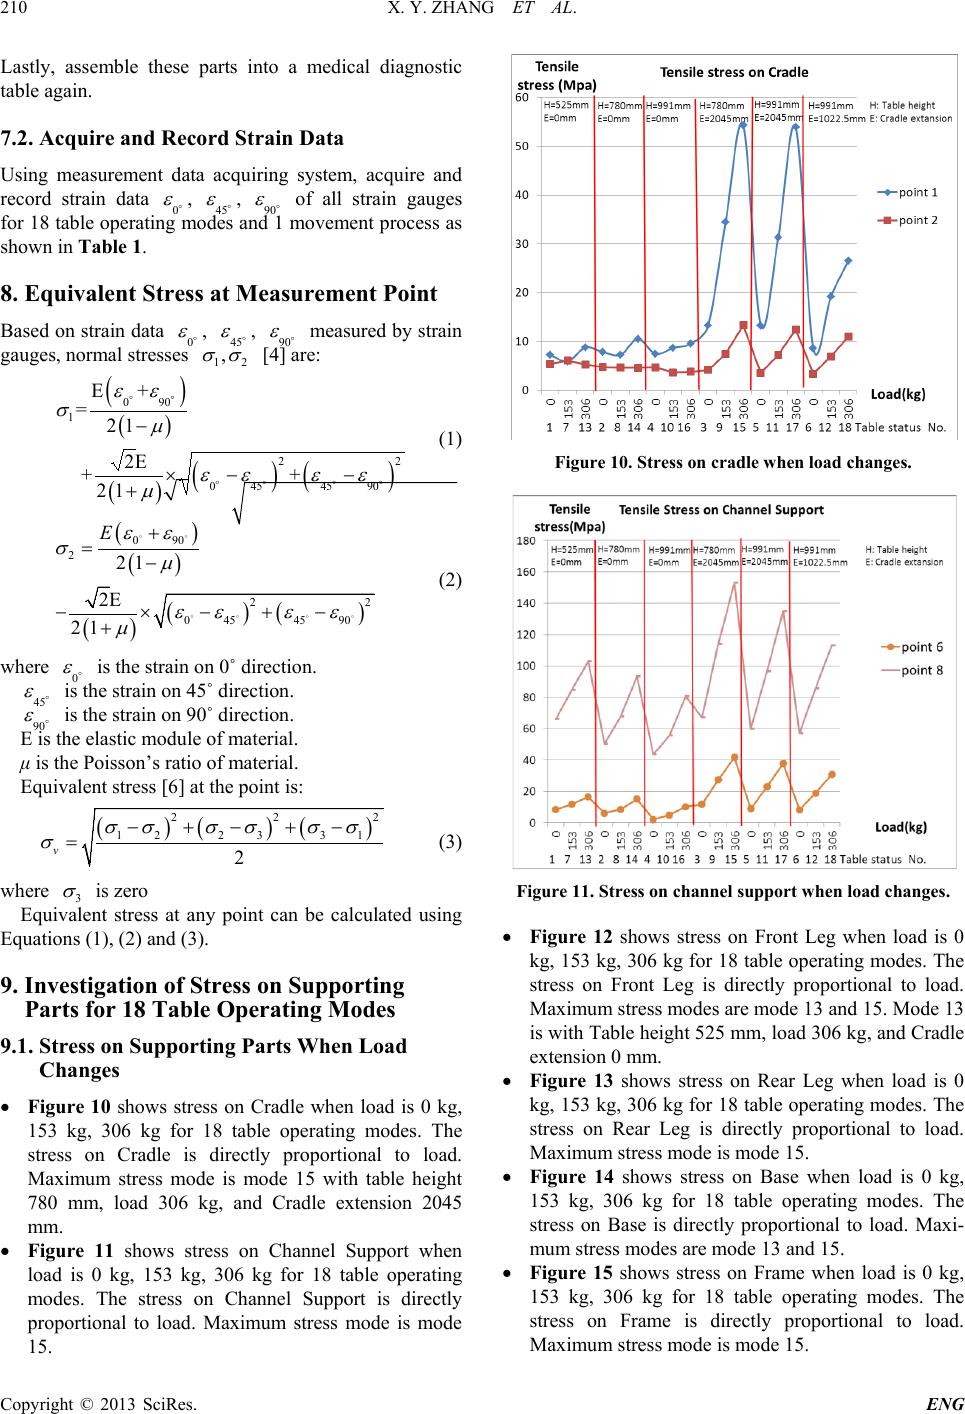
Based on the finite element analysis result, we can
figure out the high stress points on each supporting part.
By measuring and investigating regular pattern of stress
for those high stress points, table maximum stress modes
can be identified. Such findings will be instructive and
provide guidance to the actual table loading test, which is
used to evaluate tables strength. It reduces modes num-
ber for the actual loading test and cost.
This paper cites an example of test of a specific CT
medical diagnostic table to make detail descrip tion of the
safety evaluation method. This CT medical diagnostic
table under study uses parallelogram structure. It pro-
vides various operating modes, such as working on dif-
ferent height and different cradle extension for patient
application needs.
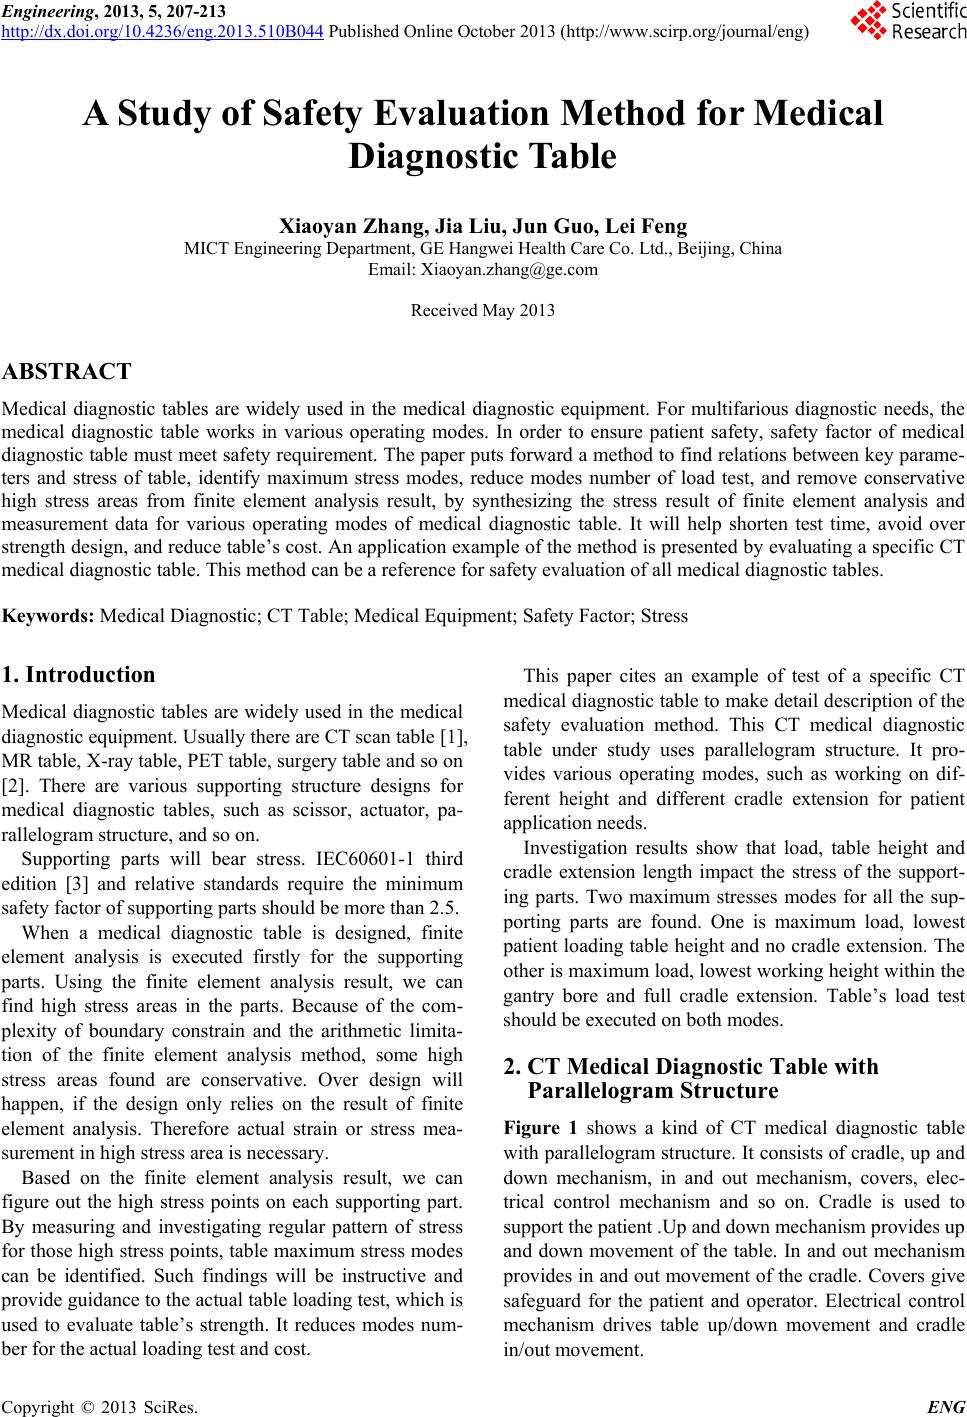
Investigation results show that load, table height and
cradle extension length impact the stress of the support-
ing parts. Two maximum stresses modes for all the sup-
porting parts are found. One is maximum load, lowest
patient loading table height and no cradle extension. The
other is maximum load, lowest working height within the
gantry bore and full cradle extension. Tables load test
should be e xe cuted on both modes.
2. CT Medical Diagnostic Table with
Parallelogram Structure
Figure 1 shows a kind of CT medical diagnostic table
with parallelogram stru cture. It consists of cradle, up and
down mechanism, in and out mechanism, covers, elec-
trical control mechanism and so on. Cradle is used to
support the patient .Up and down mechanism provides up
and down movement of the table. In and out mechanism
provides in and out movement of the cradle. Covers give
safeguard for the patient and operator. Electrical control
mechanism drives table up/down movement and cradle
in/out movement.
X. Y. ZHANG ET AL.
Copyright © 2013 SciRes. ENG
208
Figure 1. CT medical diagnostic table.
3. Various Operating Modes of CT Medical
Diagnostic Table
In order to cover various operating modes of the CT
medical diagnostic table, several key parameters of table
are determined. They are the lowest table height for pa-
tient loading, the lowest table working height within the
gantry bore for the patient scanning, the highest table
working height within the gantry bore for the patient
scanning, cradle not extended and cradle fully extended.
Only when the table height is between the lowest and the
highest working height, can cradle move in and out. For
the specific CT medical diagnostic table, 525 mm is its
lowest patient loading height, 780 mm is its lowest
working height, 991 mm is its highest working height,
2045 mm is its maximum cradle extension length, and
306 kg is its maximum working load. Table 1 gives de-
tailed description of the CT tables 18 operating modes
and 1 movement process.
4. Supporting Parts
When patient is loaded on the cradle, the table’s main
supporting parts are bearing large forces, and are trans-
ferring the forces from table top to bottom. The main
supporting parts on a parallelogram structure table are
Cradle, Channel Support, Front Leg, Rear Leg, Base, and
Frame. Figure 2 shows the main supporting parts.
5. Strain Measurement Points
Strain gauges are attached to the high stress areas identi-
fied from finite element analysis to get the actual stress
data through measurement.
Figure 3 shows measurement points on Cradle.
Figure 4 shows measurement points on Channel Sup-
port.
Figure 5 shows measurement points on Front Leg.
Figure 6 shows measurement points on Rear Leg.
Figure 7 shows measurement points on Base
Figure 8 shows measurement points on Frame.
6. Strain Gauges
Right angle strain array gauges are used to measure strain
of high stress points on the supporting parts. The kind of
strain array is shown on Figure 9 [4]. Each piece of
Table 1. 18 typical table operating modes and 1 movement
process.
Work mode Mode description
1 Table height: 525 mm. Load: 0 kg.
Cradle extension:0 mm
2 Table height: 780 mm. Load: 0 kg.
Cradle extension:0 mm
3 Table height: 780 mm. Load: 0 kg.
Cradle extension: 2045 mm
4 Table height: 991 mm. Load: 0 kg.
Cradle extension: 0 mm
5 Table height: 991 mm. Load: 0 kg.
Cradle extension: 2045 mm
6 Table height: 991 mm. Load: 0 kg.
Cradle extension: 1022.5 mm
7 Table height: 525 mm. Load: 153 kg.
Cradle extension: 0 mm
8 Table height: 780 mm. Load: 153 kg.
Cradle extension: 0 mm
9 Table height: 780 mm. Load: 153 kg.
Cradle extension: 2045 mm
10 Table height: 991 mm. Load: 153 kg.
Cradle extension: 0 mm
11 Table height: 991 mm. Load: 153 kg.
Cradle extension: 2045 mm
12 Table height: 991 mm. Load: 153 kg.
Cradle extension: 1022.5 mm
13 Table height: 525 mm. Load: 306 kg.
Cradle extension: 0 mm
14 Table height: 780mm. Load: 306kg.
Cradle extension:0mm
15 Table height: 780 mm. Load: 306 kg.
Cradle extension: 2045 mm
16 Table height: 991 mm. Load: 306 kg.
Cradle extension: 0 mm
17 Table height: 991 mm. Load: 306 kg.
Cradle extension: 2045 mm
18 Table height: 991 mm. Load: 306 kg.
Cradle extension: 1022.5 mm
1 Movement
process Table height: 991 mm. Load: 306 kg.
Cradle extension: from 0 to 2045 mm
Figure 2. Main supporting parts.
X. Y. ZHANG ET AL.
Copyright © 2013 SciRes. ENG
209
Figure 3. Measurement points on cradle.
Figure 4. Measurement points on c han nel support .
Figure 5. Measurement points on front leg.
Figure 6. Measurement points on rear leg.
Figure 7. Measurement points on base.
Figure 8. Measurement points on frame.
Figure 9. Right angle strain array gauge.
strain gauge array detects strain on direction 0˚, 45˚ and
90˚.
7. Test Procedures
7.1. Attach Strain Gauge
First, disassemble the CT medical diagnostic table. All
supporting p arts are in free load mode without any stress.
Then remove paint around points to be measured, and
where strain gauge will be attached [5]. After that, attach
strain gauge with glue. Maintain 24 hours to dry the glue.
X. Y. ZHANG ET AL.
Copyright © 2013 SciRes. ENG
210
Lastly, assemble these parts into a medical diagnostic
table again.
7.2. Acquire and Record Strain Data
Using measurement data acquiring system, acquire and
record strain data
0
ε
, 45
ε
,
90
ε
of all strain gauges
for 18 table operating modes and 1 movement process as
shown in Table 1.
8. Equivalent Stress at Measurement Point
Based on strain data
0
ε
,
45
ε
, 90
ε
measured by strain
gauges, normal stresses
12
,
σσ
[4] are:
( )
( )
( )
() ()
0 90
1
22
04545 90
+
=21
2E
++
21
εε
σµ
εεε ε
µ
Ε
×− −
+

 
(1)
( )
( )
( )
() ()
0 90
2
22
0454590
21
2E
21
E
εε
σµ
εεε ε
µ
+
=
−× −+−
+

 
(2)
where
0
ε
is the strain on 0˚ direction.
45
ε
is the strain on 45˚ direction.
90
ε
is the strain on 90˚ direction.
E is the elastic module of material.
μ is the Poissons ratio of material.
Equivalent stress [6] at the point is:
(3)
where
3
σ
is zero
Equivalent stress at any point can be calculated using
Equations (1), (2) and (3).
9. Investigation of Stress on Supporting
Parts for 18 Table Operating Modes
9.1. Stress on Supporting Parts When Load
Changes
Figure 10 shows stress on Cradle when load is 0 kg,
153 kg, 306 kg for 18 table operating modes. The
stress on Cradle is directly proportional to load.
Maximum stress mode is mode 15 with table height
780 mm, load 306 kg, and Cradle extension 2045
mm.
Figure 11 shows stress on Channel Support when
load is 0 kg, 153 kg, 306 kg for 18 table operating
modes. The stress on Channel Support is directly
proportional to load. Maximum stress mode is mode
15.
Figure 10. Stress on cradle when load change s .
Figure 11. Stress on channel support whe n l oad changes.
Figure 12 shows stress on Front Leg when load is 0
kg, 153 kg, 306 kg for 18 table operating modes. The
stress on Front Leg is directly proportional to load.
Maximum stress modes are mode 13 and 15. Mode 13
is with Table height 525 mm, load 306 kg, and Crad le
extension 0 mm.
Figure 13 shows stress on Rear Leg when load is 0
kg, 153 kg, 306 kg for 18 table operating modes. The
stress on Rear Leg is directly proportional to load.
Maximum stre ss mode is mode 15.
Figure 14 shows stress on Base when load is 0 kg,
153 kg, 306 kg for 18 table operating modes. The
stress on Base is directly proportional to load. Maxi-
mum stress modes are mode 13 and 15.
Figure 15 shows stress on Frame when load is 0 kg,
153 kg, 306 kg for 18 table operating modes. The
stress on Frame is directly proportional to load.
Maximum stress mode is mode 15.
X. Y. ZHANG ET AL.
Copyright © 2013 SciRes. ENG
211
Figure 12. Stress on front leg when load changes.
Figure 13. Stress on rear leg when load changes.
9.2. Stress on Supporting Parts When Table
Height Changes
Stress on Channel Support, Front Leg, Rear Leg, Base
and Fra me are analyzed wh en table heigh t ch ang es for 18
table operating modes. The stress is inversely propor-
tional to table height. Maximum stress modes are mode
13, 15. Stress on cradle doesn’t relate to table height.
9.3. Stress on Supporting Parts When Cradle
Extends
Figure 16 shows stress on measurement points of Cradle
when Cradle extends from 0 mm to full extension 2045
mm. The stress is directly proportional to cradle exten-
sion length. Bu t stress is not sensitive to cradle extension
length when measurement points on cradle are extended
Figure 14. Stress on base when load changes.
Figure 15. Stress on frame when load changes.
out of support roller.
Figure 17 shows stress on those measurement points
of supporting parts, where stress is directly proportional
to Cradle extension length when Cradle extends from 0
mm to full extension 2045 mm.
Figure 18 shows stress on point 45 of Base, where
stress is inversely proportional to Cradle extension length
when Cradle extends from 0 mm to full extension 2045
mm.
X. Y. ZHANG ET AL.
Copyright © 2013 SciRes. ENG
212
Figure 16. Stress on cradle when cradle extends.
Figure 17. Stress at the points where stress is directly pro-
portional to cradle extension length.
Figure 18. Stress at the point where stress is inversely pro-
portional to cradle extension length.
10. Maximum Stress M odes Identificat ion
After investigating maximum stress of each individual
supporting part for 18 table operating modes, it is identi-
fied that there are 2 maximum stress modes to cover all
supporting parts. One is mode 13 with lowest patient
loading height 525 mm, no cradle extension, and maxi-
mum load 306 kg. Another is mode 15 with lowest
working height 780 mm, full cradle extension 2045 mm,
and maximum load 3 06 kg.
11. Safety Factor Evaluation
11.1. Strain Measurement Method to Evaluate
Safety Factor of Supporting Part
Table 2 shows safety factor of supporting parts on max i-
mum stress modes of the CT medical diagnostic table
identified by usin g strain measurement meth od . It means
that safety factor of supporting parts meet IEC require-
ment of 2.5.
11.2. Load Test Method to Evaluate Safety
Factor of Supporting Parts
The method described in 11.1 is feasible to evaluate
safety factor. Furthermore, based on the maximum stress
modes identification result, we have developed another
safety factor evaluation met ho d. It is 4 times of maxi-
mum working load test method. When 4 times of maxi-
mum working load is put on Cradle on the maximum
stress modes, if the supporting parts survive the test
without any break, it means the safety factor of support-
ing parts is higher than 2.5.
Figure 19 shows a load test example of the CT medi-
cal diagnostic table on the 2 maximum stress modes 13
and 15 to evaluate its safety factor. After test is com-
pleted, all supporting parts are checked, and no broken
sign is found.
12. Conclusion
By synthesizing stress results of finite element analysis
Table 2. Safety factor of supporting par t s.
Part name Strengt h of
material (Mpa) Maximum
stress (Mpa) Safety
factor (Mpa)
Channel Suppor t 400 153.1 2.6
Front Leg 400 105.2 3.8
Rear Leg 400 22.8 17.5
Base 400 47.3 8.4
Frame 400 80.8 4.9
Table opera ting mode 13 Table operating mode 15
Figure 19. Load test on CT medical diagnostic table.
X. Y. ZHANG ET AL.
Copyright © 2013 SciRes. ENG
213
and measurement data analysis for various operating
modes of a CT medical diagnostic table, the maximum
stress modes are identified. Stress on supporting parts is
directly proportional to load, and inversely proportional
to table height. Stress on almost all points of support
parts is directly proportional to cradle extension length
except several points. The CT medical diagnostic table is
tested using the above mentioned test method with pass-
ing result. By using this method, after the maximum
stress modes of medical diagnostic table with a specific
kind of supporting structure design are identified, 4 times
of maximum working load test on the maximum stress
modes can evaluate its safety factor. Thus modes number
of load test can be reduced, some conservative high
stress areas from finite element analysis result can be
removed. It will help shorten test time, avoid over
strength design, and reduce table cost. This method can
be a reference for safety evaluation of all medical diag-
nostic tables.
REFERENCES
[1] J. Hsieh, “Computed Tomography Principle, Design,
Artifacts and Recent Advances,” SPIE Press, Bellingham,
2009, pp. 179-205.
[2] Crotty and J. Dominic, “Patient Bed Design for an Inte-
grated SPECT-CT Dedicated Mammotomography Sys-
tem,” Nuclear Science Symposium Conference Record,
Vol. 6, No. 3, 2003, pp. 3915-3919.
[3] International Electrotechnical Commission, “International
standard IEC60601-1,” 3d Edition, Switzerland, 2005, pp.
291-293.
[4] H. W. Liu, “Mechanics of Materials,” People’s Education
Press, Beijing, 1980, pp. 200-212.
[5] J. Dia and d.-p. Wang, “Sticking Technique of Strain
Gauge in Electrometric Stress-test,” Journal of Hunan In-
stitute of Engineering, Vol. 13, No. 3, 2003, pp. 55-57.
[6] H. W. Liu, “Mechanics of Materials,” Higher Education
Press, Beijing, 2002, pp. 322-328.