Engineering, 2013, 5, 176-180
http://dx.doi.org/10.4236/eng.2013.510B038 Published Online October 2013 (http://www.scirp.org/journal/eng)
Copyright © 2013 SciRes. ENG
Cardiovas cula r Di sea ses Detecting via Pulse Analysis
Jingjing Xia, Simon Liao
Department of Applied Computer Science, University of Winnipeg, Winnipeg, Canada
Email: xia-j@webmail.uwinnipeg.ca, s.liao@uwinnipeg.ca
Received May 2013
ABSTRACT
In this research, we have performed pulse analysis on the data of 127 subjects collected from Department of Cardiology
at Shandong Provincial Hospital in China. By taking the first and third derivatives of an entire pulse wave, we have
firstly identified the locations of wave foot, systolic peak, and reflected point. Then we calculated Reverse Shoulder
Index (RSI) and Ratio of Distance of the evaluated subjects, and correlated them to age, th e history of hypertension, and
different cardiovascular diseases of the subjects.
Keywords: Pulse Wave Analysis; Wave Reflections; RSI; Cardiovascular Diseases Detection
1. Introduction
In the year of 1872, the father of pulse wave analysis,
Mahomed, wrote the following statement in his research
[1], Since the information that the pulse affords is of so
great importance, and so often consulted, surely it must
be to our advantage to appreciate fully all it tells us, and
to draw from it every detail that it is capable of impart-
ing. Since then more and more scientists put lots of ef-
forts to discover the important points from pulse wave
and connected them to age and different kinds of diseases,
especially cardiovascular diseases, for instance, hyper-
tension, acute myocardial infarction and coronary heart
disease.
In 19th century, pulse wave was recorded invasively
from the aortic ascending artery. Therefore, during that
period, pulse wave analysis is mainly concentrated in
ascending aorta. The invasive method has lots of short
comings. It is greatly inconvenient to be obtained and
hard to keep consistency of wave form. Later on, scien-
tists developed noninvasively methods for obtaining
pulse wave. Furthermore, not only the pulse wave of aor-
tic central artery, but also waves of peripheral arterial,
carotid, brachial and femoral arteries can be recorded. In
our study, pulse waves were recorded noninvasively
from index finger using a finger clip with infra-red sen-
sor.
The noninvasi vely met hod of rec ording pul se wave does
make a great contribution to the process of pulse analysis.
Among all related research of pulse wave, the study of
reflection of the primary pressure pulse along the human
arterial tree has important significance in medical re-
search. In 1890, Murgo et al. pointed out that wave ref-
lection was h ighly ass ociated with age [2]. Both Mitchell
et al. in 2004 [3] and O’Rourke, Nichols and in 2005 [4]
proved there was inextricable link between wave reflec-
tion and age. Furthermore, Eshan et al. [5] correlated
wave reflection with cardiovascular risks. They empha-
sized that it may be a useful measure of assessing overall
rick for coronary artery disease. Certainly wave reflec-
tion is a momentous aspect for pulse analysis, and it is a
different issue between central aortic pulse pressure and
peripheral arterial pulse pressure. For central aortic pres-
sure, augmentation index is used as an incidence of re-
flected waves among total pulse pressure, as mentioned
in [6]. For peripheral arterial pressure, another index
would be adopted, which is RSI (Reverse Shoulder In-
dex). Due to all of the pulse waves for our study are rec-
orded from peripheral artery, we applied the method dis-
cussed in [7]. According to [7], we verified the wave foot
by the first derivative form and located the reflected
point and systolic peak via the third derivative curve. RSI
(Reverse Shoulder Index) and Ratio of Distance were
calculated using those two points. In the following part,
we will introduce the details of the method. Finally, we
associated those two parameters with age, hypertension,
coronary artery disease and chest pain. Results will be
shown in the following statement.
2. Subjects and Device
We evaluated 127 subjects from August, 2008 to August,
2010 in Department of Cardiology at Shandong Provin-
cial Hospital in China. All the pulse waves were recorded
noninvasively by finger clip with infra-red senor. The
device is made by Anhui Huake Electronic Technical
Research Institute in China, and the model of the device
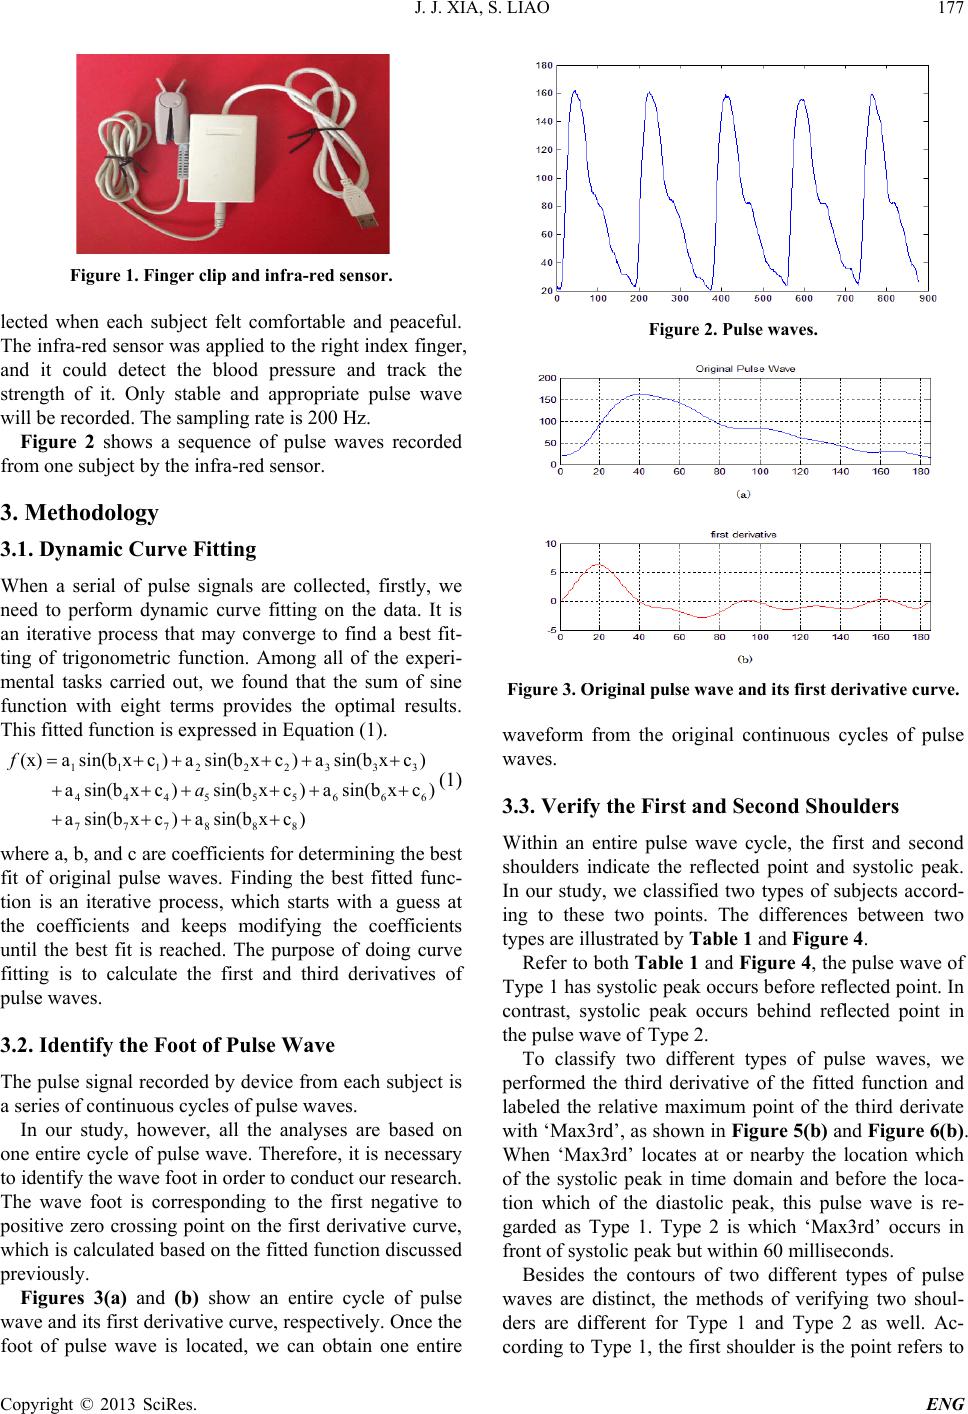
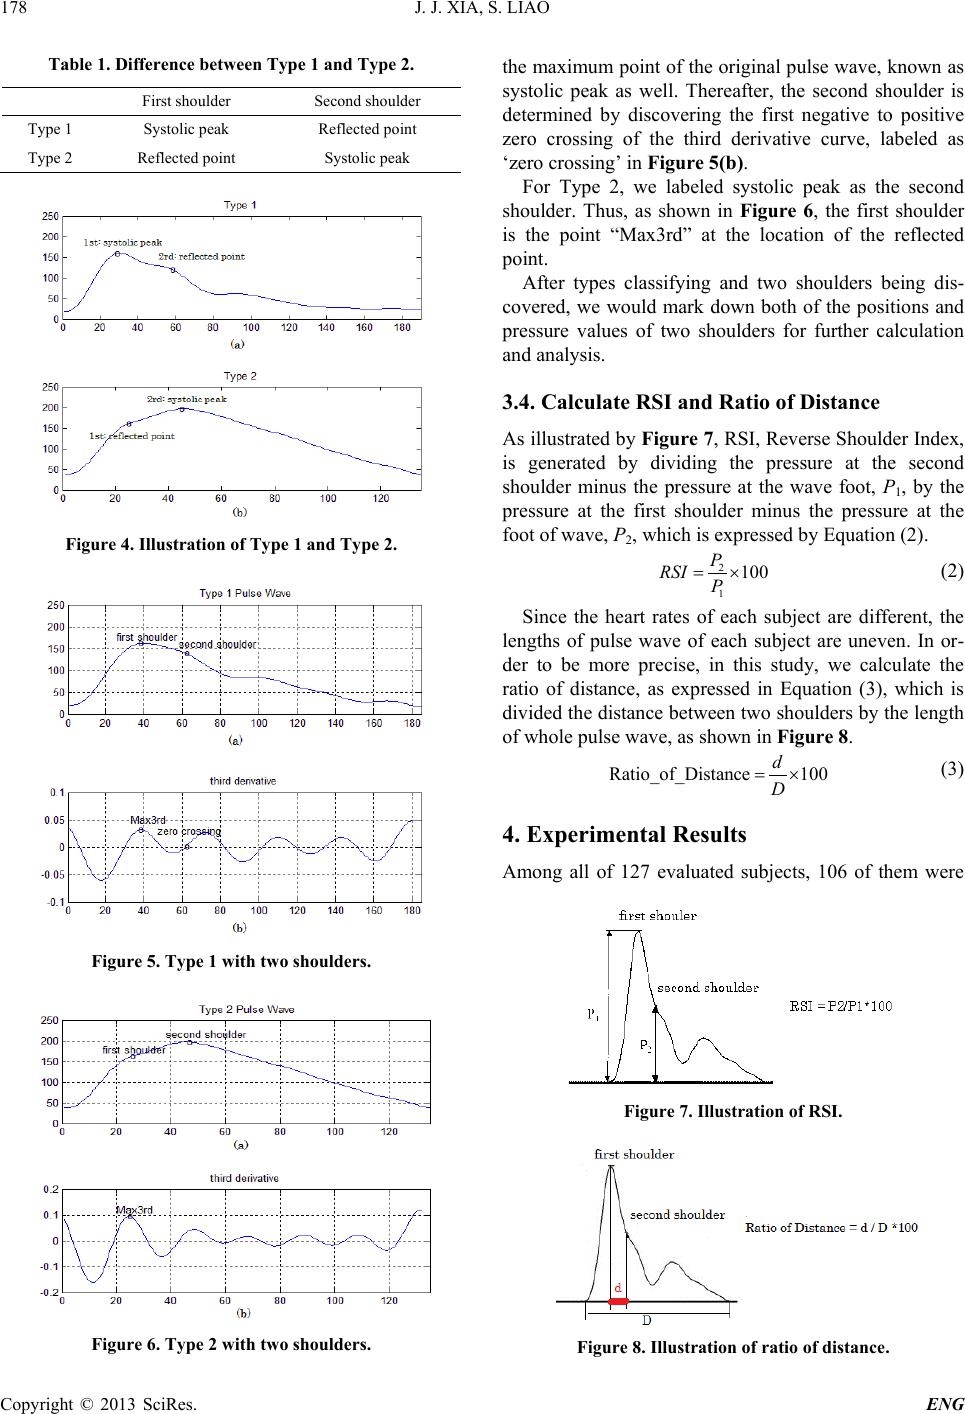
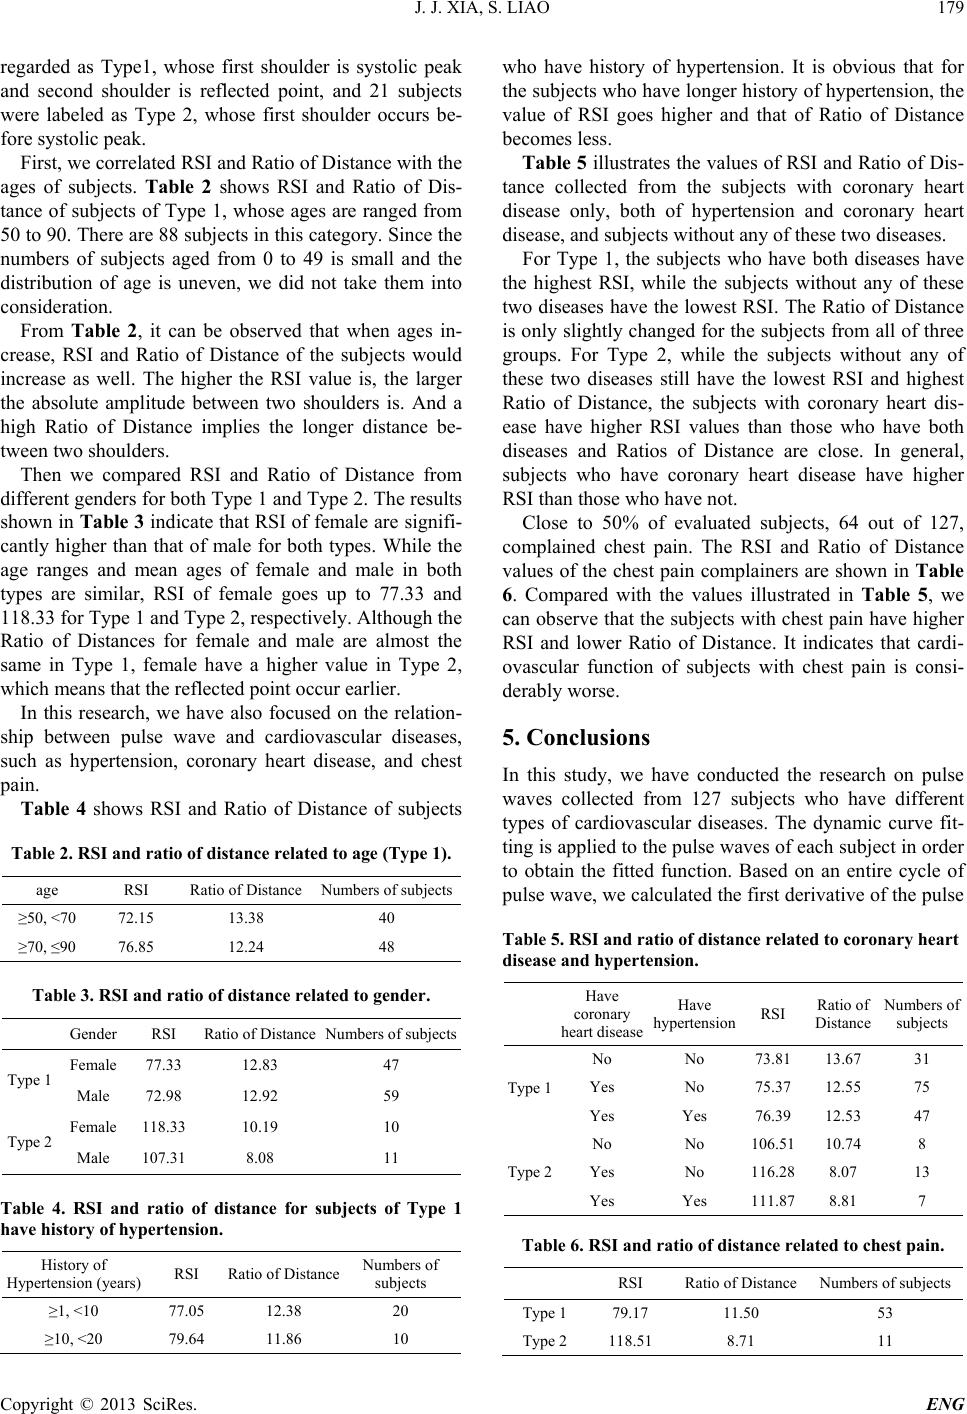
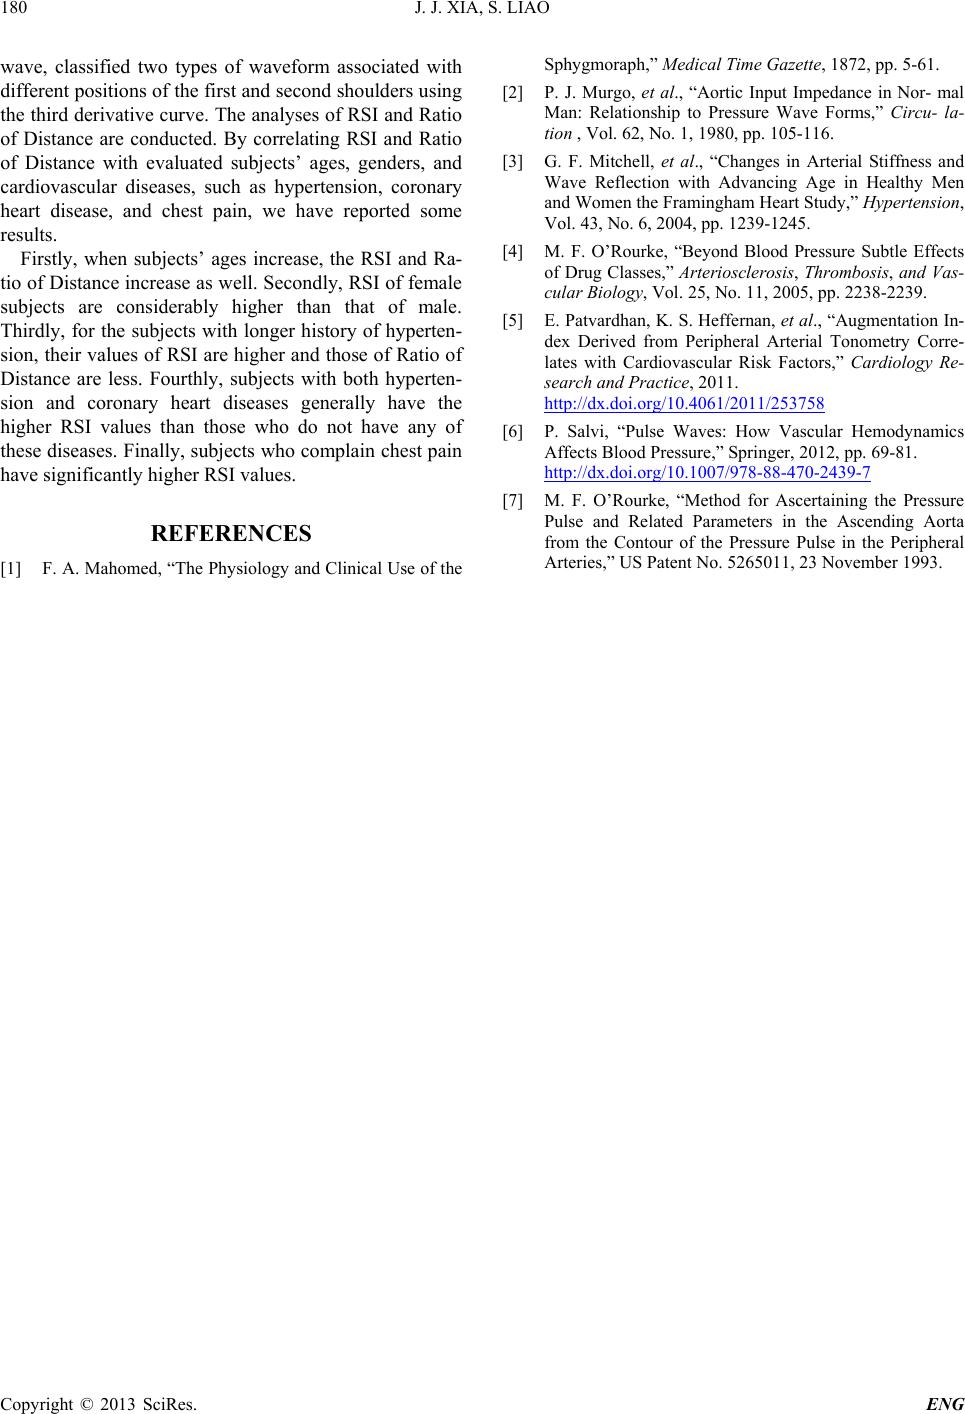
is HKG-07C, shown as Figure 1. The data were col-
J. J. XIA, S. LIAO
Copyright © 2013 SciRes. ENG
177
Figure 1. Finger clip and infr a-red sensor.
lected when each subject felt comfortable and peaceful.
The infra-red sensor was applied to the right index finger,
and it could detect the blood pressure and track the
strength of it. Only stable and appropriate pulse wave
will be recorded. The sampling rate is 200 Hz.
Figure 2 shows a sequence of pulse waves recorded
from one subject by the infra-red sensor.
3. Methodology
3.1. Dynamic Curve Fitting
When a serial of pulse signals are collected, firstly, we
need to perform dynamic curve fitting on the data. It is
an iterative process that may converge to find a best fit-
ting of trigonometric function. Among all of the experi-
mental tasks carried out, we found that the sum of sine
function with eight terms provides the optimal results.
This fitted function is expressed in Equation (1).
111 22 2 333
4 445 556 66
7778 88
(x)asin(bx c)asin(bx c)asin(bx c)
asin(bx c)sin(bxc)asin(bxc)
asin(bx c)asin(bx c)
f
a
=+++ ++
+++ +++
+++ +
(1)
where a, b, and c are coefficients for determining the best
fit of original pulse waves. Finding the best fitted func-
tion is an iterative process, which starts with a guess at
the coefficients and keeps modifying the coefficients
until the best fit is reached. The purpose of doing curve
fitting is to calculate the first and third derivatives of
pulse waves.
3.2. Identify the Foot of Pulse Wave
The pulse signal recorded by device from each subject is
a series of continuous cycles of pulse waves.
In our study, however, all the analyses are based on
one entire cycle of pulse wave. Therefore, it is necessary
to identify the wave foot in order to conduct our research.
The wave foot is corresponding to the first negative to
positive zero crossing point on the first derivative curve,
which is calculated based on the fitted function discussed
previously.
Figures 3(a) and (b) show an entire cycle of pulse
wave and its first derivative curve, respectively. Once the
foot of pulse wave is located, we can obtain one entire
Figure 2. Pulse waves.
Figure 3. Original pulse wave and its first derivative curve.
waveform from the original continuous cycles of pulse
wav es.
3.3. Verify the First and Second Shoulders
Within an entire pulse wave cycle, the first and second
shoulders indicate the reflected point and systolic peak.
In our study, we classified two types of subjects accord-
ing to these two points. The differences between two
types are illustrated by Table 1 and Figure 4.
Refer to bo th Table 1 and Figure 4, th e pulse w ave of
Type 1 has systolic peak occurs before reflected point. In
contrast, systolic peak occurs behind reflected point in
the pulse wave of Type 2.
To classify two different types of pulse waves, we
performed the third derivative of the fitted function and
labeled the relative maximum point of the third derivate
with ‘Max3rd’, as shown in Figure 5(b) and Fig ure 6( b).
When ‘Max3rd’ locates at or nearby the location which
of the systolic peak in time domain and before the loca-
tion which of the diastolic peak, this pulse wave is re-
garded as Type 1. Type 2 is which ‘Max3rd’ occurs in
front of systolic peak but within 60 milliseconds.
Besides the contours of two different types of pulse
waves are distinct, the methods of verifying two shoul-
ders are different for Type 1 and Type 2 as well. Ac-
cording to Type 1, the firs t shoulder is the point refers to
J. J. XIA, S. LIAO
Copyright © 2013 SciRes. ENG
178
Table 1. Difference between Type 1 and Type 2.
First shoulder Second shoulder
Type 1 Systolic peak Reflected point
Type 2 Reflected point Systolic peak
Figure 4. Illustration of Type 1 and Type 2.
Figure 5. Type 1 with two shoulders.
Figure 6. Type 2 with two shoul ders.
the maximum point of the original pulse wave, known as
systolic peak as well. Thereafter, the second shoulder is
determined by discovering the first negative to positive
zero crossing of the third derivative curve, labeled as
‘zero crossing’ in Figure 5(b).
For Type 2, we labeled systolic peak as the second
shoulder. Thus, as shown in Figure 6, the first shoulder
is the point Max3rdat the location of the reflected
point.
After types classifying and two shoulders being dis-
covered, we would mark down both of the positions and
pressure values of two shoulders for further calculation
and analysis.
3.4. Calculate RSI and Ratio of Distance
As illustrated b y Figure 7, RSI, Reverse Shoulder Index,
is generated by dividing the pressure at the second
shoulder minus the pressure at the wave foot, P1, by the
pressure at the first shoulder minus the pressure at the
foot of wave, P2, which is expressed by Equation (2).
2
1
100
P
RSI P
= ×
(2)
Since the heart rates of each subject are different, the
lengths of pulse wave of each subject are uneven. In or-
der to be more precise, in this study, we calculate the
ratio of distance, as expressed in Equation (3), which is
divided the distance between two shoulders by the length
of whole pulse wave, as shown in Figure 8.
Ratio_of_Distance 100
d
D
= ×
(3)
4. Experimental Results
Among all of 127 evaluated subjects, 106 of them were
Figure 7. Illustration of RSI.
Figure 8. Illustration of ratio of distance.
J. J. XIA, S. LIAO
Copyright © 2013 SciRes. ENG
179
regarded as Type1, whose first shoulder is systolic peak
and second shoulder is reflected point, and 21 subjects
were labeled as Type 2, whose first shoulder occurs be-
fore systolic peak.
First, we correlated RSI and Ratio of Distance with the
ages of subjects. Table 2 shows RSI and Ratio of Dis-
tance of subjects of Type 1, whose ages are ranged from
50 to 90. There are 88 subjects in this categor y. Since the
numbers of subjects aged from 0 to 49 is small and the
distribution of age is uneven, we did not take them into
considera tion.
From Table 2, it can be observed that when ages in-
crease, RSI and Ratio of Distance of the subjects would
increase as well. The higher the RSI value is, the larger
the absolute amplitude between two shoulders is. And a
high Ratio of Distance implies the longer distance be-
tween two shoulders.
Then we compared RSI and Ratio of Distance from
diff er ent gen der s for both Type 1 and Typ e 2. The results
shown in Table 3 indicate that RSI of female are signifi-
cantly higher than that of male for both types. While the
age ranges and mean ages of female and male in both
types are similar, RSI of female goes up to 77.33 and
118.33 for Type 1 and Typ e 2, resp ectiv ely. Althoug h th e
Ratio of Distances for female and male are almost the
same in Type 1, female have a higher value in Type 2,
which means that the reflected point occur earlier.
In this research, we have also focused on the relation-
ship between pulse wave and cardiovascular diseases,
such as hypertension, coronary heart disease, and chest
pain.
Table 4 shows RSI and Ratio of Distance of subjects
Table 2. RSI and ratio of distance related to age (Type 1).
age RSI Ratio of Distance Numbers of subjects
≥50, ˂70 72.15 13.38 40
≥70, ≤90 76.85 12.24 48
Table 3. RSI and ratio of distance related to gender.
Gender RSI Ratio of Distance Numbers of subjects
Type 1 Female 77.33 12.83 47
Male 72.98 12.92 59
Type 2 Female 118.33 10.19 10
Male 107.31 8.08 11
Table 4. RSI and ratio of distance for subjects of Type 1
have history of hypertension.
History of
Hypertension (years) RSI Ratio of Distance
Numbers of
subjects
≥1, ˂10 77.05 12.38 20
≥10, ˂20 79.64 11.86 10
who have history of hypertension. It is obvious that for
the subjects who have longer history of hypertension, the
value of RSI goes higher and that of Ratio of Distance
becomes less.
Table 5 illustrates the values of RSI and Ratio of Dis -
tance collected from the subjects with coronary heart
disease only, both of hypertension and coronary heart
disease, and subjects without any of these two diseases.
For Type 1, the subjects who have both diseases have
the highest RSI, while the subjects without any of these
two diseases have the lowest RSI. The Ratio of Distance
is only slightly changed for th e subjects from all of three
groups. For Type 2, while the subjects without any of
these two diseases still have the lowest RSI and highest
Ratio of Distance, the subjects with coronary heart dis-
ease have higher RSI values than those who have both
diseases and Ratios of Distance are close. In general,
subjects who have coronary heart disease have higher
RSI than t ho s e w h o have not.
Close to 50% of evaluated subjects, 64 out of 127,
complained chest pain. The RSI and Ratio of Distance
values of the chest pain complainers are shown in Table
6. Compared with the values illustrated in Table 5, we
can observe that the subjects with chest pain have higher
RSI and lower Ratio of Distance. It indicates that cardi-
ovascular function of subjects with chest pain is consi-
derably worse.
5. Conclusions
In this study, we have conducted the research on pulse
waves collected from 127 subjects who have different
types of cardiovascular diseases. The dynamic curve fit-
ting is applied to the pulse waves of each subject in order
to obtain the fitted function. Based on an entire cycle of
pulse wave, we calculated the first derivative of the pulse
Table 5. RSI and ratio of distance related to coronary heart
disease and hypertens i on .
Have
coronary
heart disease
Have
hypertension RSI Ratio of
Distance Numbers of
subjects
Type 1
No No 73.81 13.67 31
Yes No 75.37 12.55 75
Yes Yes 76.39 12.53 47
Type 2
No No 106.51 10.74 8
Yes No 116.28 8.07 13
Yes Yes 111.87 8.81 7
Table 6. RSI and ratio of distance related to chest pain.
RSI Ratio of Distance Numbers of subjects
Type 1 79.17 11.50 53
Type 2 118.51 8.71 11
J. J. XIA, S. LIAO
Copyright © 2013 SciRes. ENG
180
wave, classified two types of waveform associated with
different positions of the first and second shoulders using
the third derivative curve. The analyses o f RSI and Ratio
of Distance are conducted. By correlating RSI and Ratio
of Distance with evaluated subjects’ ages, genders, and
cardiovascular diseases, such as hypertension, coronary
heart disease, and chest pain, we have reported some
results.
Firstly, when subjects’ ages increase, the RSI and Ra-
tio of Distance increase as well. Secondly, RSI of female
subjects are considerably higher than that of male.
Thirdly, for the subjects with longer history of hyperten-
sion, their v alues of RSI are higher and those of Ratio of
Distance are less. Fourthly, subjects with both hyperten-
sion and coronary heart diseases generally have the
higher RSI values than those who do not have any of
these diseases. Finally, subjects who complain chest pain
have significantly higher RSI values.
REFERENCES
[1] F. A. Mahomed, “The Physiology and Clinical Use of the
Sphygmoraph,” Medical Time Gazette, 1872, pp. 5-61.
[2] P. J. Murgo, et al., “Aortic Input Impedance in Nor- mal
Man: Relationship to Pressure Wave Forms,Circu- la-
tion , Vol. 62, No. 1, 1980, pp. 105-116.
[3] G. F. Mitchell, et al., Changes in Arterial Stiffness and
Wave Reflection with Advancing Age in Healthy Men
and Women the Framingham Heart Study,” Hypertension,
Vol. 43, No. 6, 2004, pp. 1239-1245.
[4] M. F. O’Rourke, “Beyond Blood Pressure Subtle Effects
of Drug Classes,Arteriosclerosis, Thrombosis, and Vas-
cular Biology, Vol. 25, No. 11, 2005, pp. 2238-2239.
[5] E. Patvardhan, K. S. Heffernan, et al ., “Augmentation In-
dex Derived from Peripheral Arterial Tonometry Corre-
lates with Cardiovascular Risk Factors,” Cardiology Re-
search and Practice, 2011.
http://dx.doi.org/10.4061/2011/253758
[6] P. Salvi, “Pulse Waves: How Vascular Hemodynamics
Affects Blood Pressure,” Springer, 2012, pp. 69-81.
http://dx.doi.org/10.1007/978-88-470-2439-7
[7] M. F. O’Rourke, “Method for Ascertaining the Pressure
Pulse and Related Parameters in the Ascending Aorta
from the Contour of the Pressure Pulse in the Peripheral
Arteries,” US Patent No. 5265011, 23 November 1993.