Paper Menu >>
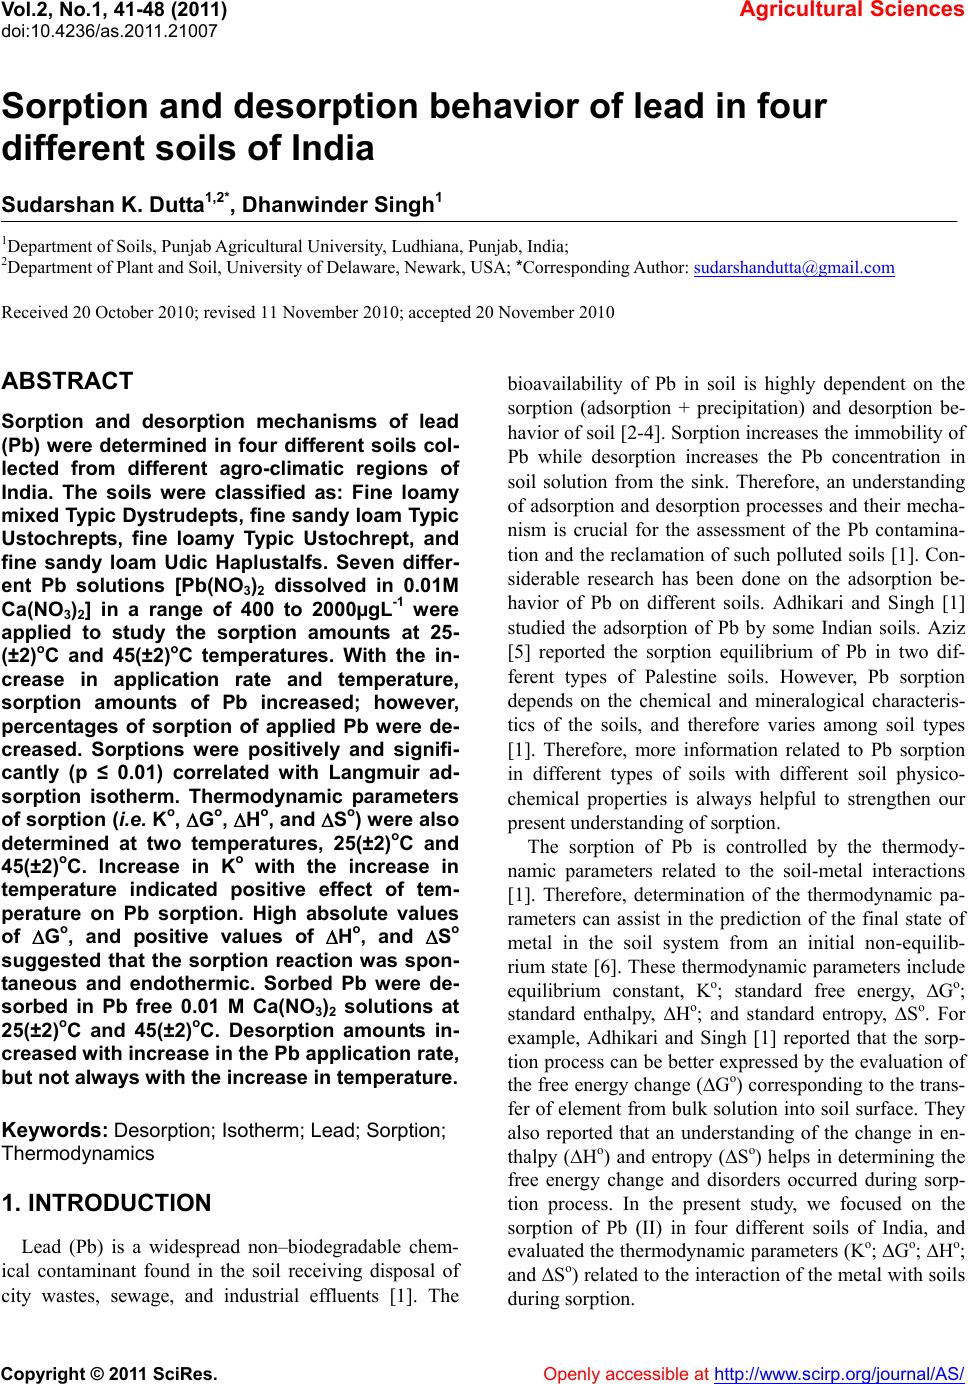
Journal Menu >>
 Vol.2, No.1, 41-48 (2011) Agricultural Sciences doi:10.4236/as.2011.2 1007 Copyright © 2011 SciRes. Openly accessible at http://www.scirp.org/journal/AS/ Sorption and desorption behavior of lead in four different soils of India Sudarshan K. Dutta1,2*, Dhanwinder Singh1 1Department of Soils, Punjab Agricultural University, Ludhiana, Punjab, India; 2Department of Plant and Soil, University of Delaware, Newark, USA; *Corresponding Author: sudarshandutta@gmail.com Received 20 October 2010; revised 11 November 2010; accepted 20 November 2010 ABSTRACT Sorption and desorption mechanisms of lead (Pb) were determined in four different soils col- lected from different agro-climatic regions of India. The soils were classified as: Fine loamy mixed Typic Dystrudepts, fine sandy loam Typic Ustochrepts, fine loamy Typic Ustochrept, and fine sandy loam Udic Haplustalfs. Seven differ- ent Pb solutions [Pb(NO3)2 dissolved in 0.01M Ca(NO3)2] in a range of 400 to 2000µgL-1 were applied to study the sorption amounts at 25- (±2)oC and 45(±2)oC temperatures. With the in- crease in application rate and temperature, sorption amounts of Pb increased; however, percentages of sorption of applied Pb were de- creased. Sorptions were positively and signifi- cantly (p ≤ 0.01) correlated with Langmuir ad- sorption isotherm. Thermodynamic parameters of sorption (i.e. Ko, Go, Ho, and So) were also determined at two temperatures, 25(±2)oC and 45(±2)oC. Increase in Ko with the increase in temperature indicated positive effect of tem- perature on Pb sorption. High absolute values of Go, and positive values of Ho, and So suggested that the sorption reaction was spon- taneous and endothermic. Sorbed Pb were de- sorbed in Pb free 0.01 M Ca(NO3)2 solutions at 25(±2)oC and 45(±2)oC. Desorption amounts in- creased with increase in the Pb application rate, but not always with the increase in temperature. Keywords: Desorption; Isotherm; Lead; Sorption; Thermodynamics 1. INTRODUCTION Lead (Pb) is a widespread non–biodegradable chem- ical contaminant found in the soil receiving disposal of city wastes, sewage, and industrial effluents [1]. The bioavailability of Pb in soil is highly dependent on the sorption (adsorption + precipitation) and desorption be- havior of soil [2-4]. Sorption increases the immobility of Pb while desorption increases the Pb concentration in soil solution from the sink. Therefore, an understanding of adsorption and desorption processes and their mecha- nism is crucial for the assessment of the Pb contamina- tion and the reclamation of such polluted soils [1]. Con- siderable research has been done on the adsorption be- havior of Pb on different soils. Adhikari and Singh [1] studied the adsorption of Pb by some Indian soils. Aziz [5] reported the sorption equilibrium of Pb in two dif- ferent types of Palestine soils. However, Pb sorption depends on the chemical and mineralogical characteris- tics of the soils, and therefore varies among soil types [1]. Therefore, more information related to Pb sorption in different types of soils with different soil physico- chemical properties is always helpful to strengthen our present understanding of sorption. The sorption of Pb is controlled by the thermody- namic parameters related to the soil-metal interactions [1]. Therefore, determination of the thermodynamic pa- rameters can assist in the prediction of the final state of metal in the soil system from an initial non-equilib- rium state [6]. These thermodynamic parameters include equilibrium constant, Ko; standard free energy, Go; standard enthalpy, Ho; and standard entropy, So. For example, Adhikari and Singh [1] reported that the sorp- tion process can be better expressed by the evaluation of the free energy change (Go) corresponding to the trans- fer of element from bulk solution into soil surface. They also reported that an understanding of the change in en- thalpy (Ho) and entropy (So) helps in determining the free energy change and disorders occurred during sorp- tion process. In the present study, we focused on the sorption of Pb (II) in four different soils of India, and evaluated the thermodynamic parameters (Ko; Go; Ho; and So) related to the interaction of the metal with soils during sorption. 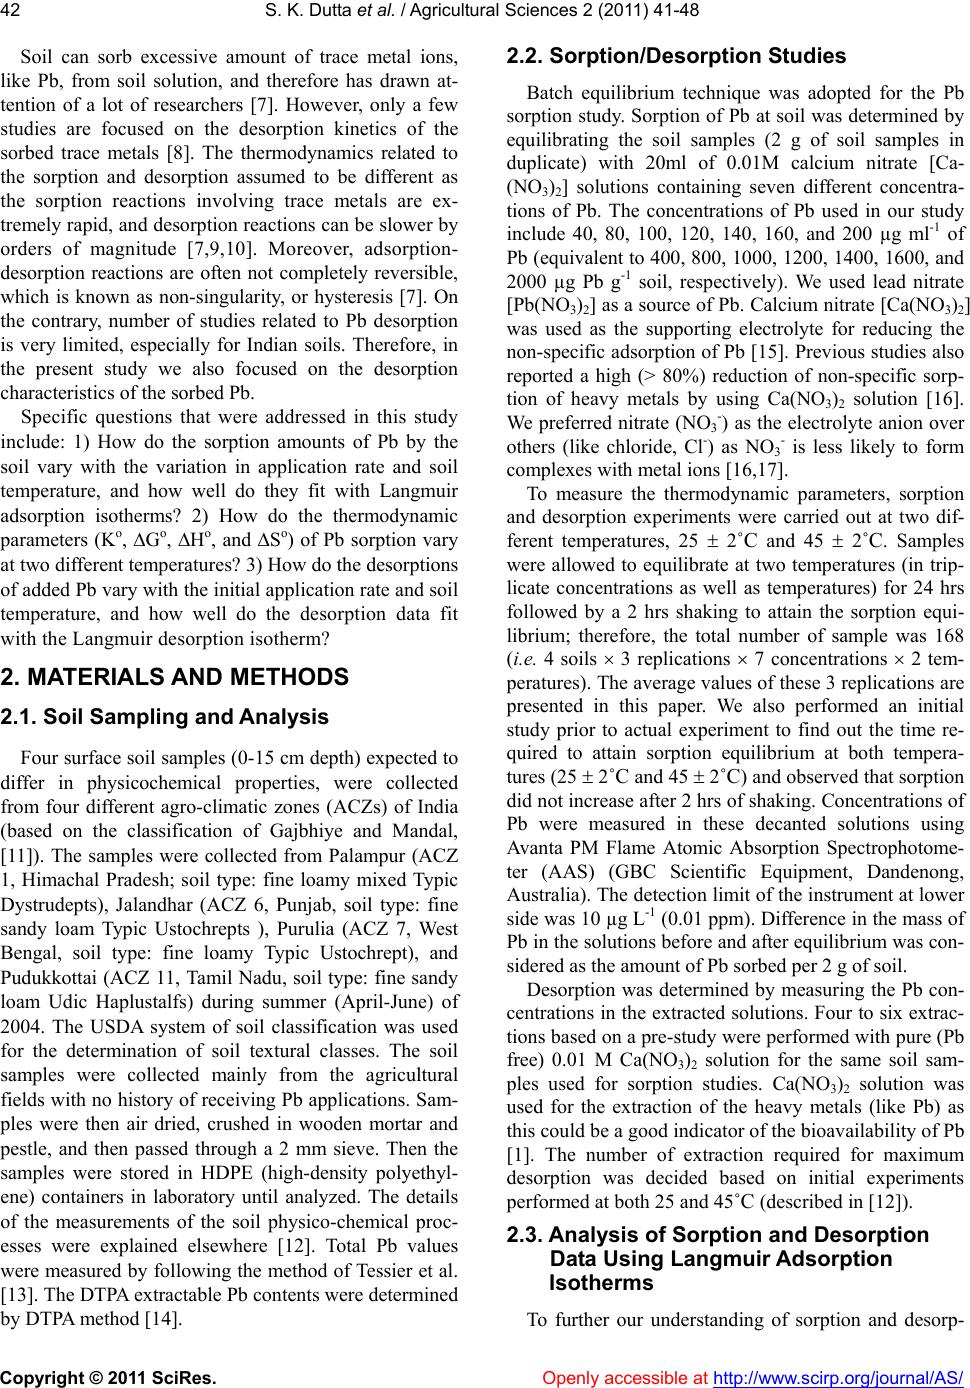 S. K. Dutta et al. / Agricultural Sciences 2 (20 11) 41-48 Copyright © 2011 SciRes. Openly accessible at http://www.scirp.org/journal/AS/ 42 Soil can sorb excessive amount of trace metal ions, like Pb, from soil solution, and therefore has drawn at- tention of a lot of researchers [7]. However, only a few studies are focused on the desorption kinetics of the sorbed trace metals [8]. The thermodynamics related to the sorption and desorption assumed to be different as the sorption reactions involving trace metals are ex- tremely rapid, and desorption reactions can be slower by orders of magnitude [7,9,10]. Moreover, adsorption- desorption reactions are often not completely reversible, which is known as non-singularity, or hysteresis [7]. On the contrary, number of studies related to Pb desorption is very limited, especially for Indian soils. Therefore, in the present study we also focused on the desorption characteristics of the sorbed Pb. Specific questions that were addressed in this study include: 1) How do the sorption amounts of Pb by the soil vary with the variation in application rate and soil temperature, and how well do they fit with Langmuir adsorption isotherms? 2) How do the thermodynamic parameters (Ko, Go, Ho, and So) of Pb sorption vary at two different temperatures? 3) How do the desorptions of added Pb vary with the initial application rate and soil temperature, and how well do the desorption data fit with the Langmuir desorption isotherm? 2. MATERIALS AND METHODS 2.1. Soil Sampling and Analysis Four surface soil samples (0-15 cm depth) expected to differ in physicochemical properties, were collected from four different agro-climatic zones (ACZs) of India (based on the classification of Gajbhiye and Mandal, [11]). The samples were collected from Palampur (ACZ 1, Himachal Pradesh; soil type: fine loamy mixed Typic Dystrudepts), Jalandhar (ACZ 6, Punjab, soil type: fine sandy loam Typic Ustochrepts ), Purulia (ACZ 7, West Bengal, soil type: fine loamy Typic Ustochrept), and Pudukkottai (ACZ 11, Tamil Nadu, soil type: fine sandy loam Udic Haplustalfs) during summer (April-June) of 2004. The USDA system of soil classification was used for the determination of soil textural classes. The soil samples were collected mainly from the agricultural fields with no history of receiving Pb applications. Sam- ples were then air dried, crushed in wooden mortar and pestle, and then passed through a 2 mm sieve. Then the samples were stored in HDPE (high-density polyethyl- ene) containers in laboratory until analyzed. The details of the measurements of the soil physico-chemical proc- esses were explained elsewhere [12]. Total Pb values were measured by following the method of Tessier et al. [13]. The DTPA extractable Pb contents were determined by DTPA method [14]. 2.2. Sorption/Desorption Studies Batch equilibrium technique was adopted for the Pb sorption study. Sorption of Pb at soil was determined by equilibrating the soil samples (2 g of soil samples in duplicate) with 20ml of 0.01M calcium nitrate [Ca- (NO3)2] solutions containing seven different concentra- tions of Pb. The concentrations of Pb used in our study include 40, 80, 100, 120, 140, 160, and 200 µg ml-1 of Pb (equivalent to 400, 800, 1000, 1200, 1400, 1600, and 2000 µg Pb g-1 soil, respectively). We used lead nitrate [Pb(NO3)2] as a source of Pb. Calcium nitrate [Ca(NO3)2] was used as the supporting electrolyte for reducing the non-specific adsorption of Pb [15]. Previous studies also reported a high (> 80%) reduction of non-specific sorp- tion of heavy metals by using Ca(NO3)2 solution [16]. We preferred nitrate (NO3 -) as the electrolyte anion over others (like chloride, Cl-) as NO3 - is less likely to form complexes with metal ions [16,17]. To measure the thermodynamic parameters, sorption and desorption experiments were carried out at two dif- ferent temperatures, 25 2 ˚C and 45 2˚C. Samples were allowed to equilibrate at two temperatures (in trip- licate concentrations as well as temperatures) for 24 hrs followed by a 2 hrs shaking to attain the sorption equi- librium; therefore, the total number of sample was 168 (i.e. 4 soils 3 replications 7 concentrations 2 tem- peratures). The average values of these 3 replications are presented in this paper. We also performed an initial study prior to actual experiment to find out the time re- quired to attain sorption equilibrium at both tempera- tures (25 2˚C and 45 2˚C) and observed that sorption did not increase after 2 hrs of shaking. Concentrations of Pb were measured in these decanted solutions using Avanta PM Flame Atomic Absorption Spectrophotome- ter (AAS) (GBC Scientific Equipment, Dandenong, Australia). The detection limit of the instrument at lower side was 10 µg L-1 (0.01 ppm). Difference in the mass of Pb in the solutions before and after equilibrium was con- sidered as the amount of Pb sorbed per 2 g of soil. Desorption was determined by measuring the Pb con- centrations in the extracted solutions. Four to six extrac- tions based on a pre-study were performed with pure (Pb free) 0.01 M Ca(NO3)2 solution for the same soil sam- ples used for sorption studies. Ca(NO3)2 solution was used for the extraction of the heavy metals (like Pb) as this could be a good indicator of the bioavailability of Pb [1]. The number of extraction required for maximum desorption was decided based on initial experiments performed at both 25 and 45˚C (described in [12]). 2.3. Analysis of Sorption and Desorption Data Using Langmuir Adsorption Isotherms To further our understanding of sorption and desorp-  S. K. Dutta et al. / Agricultural Sciences 2 (20 11) 41-48 Copyright © 2011 SciRes. Openly accessible at http://www.scirp.org/journal/AS/ 43 tion processes, we fitted our Pb sorption and desorption data to Langmuir adsorption and desorption isotherms. The details of data analyses steps were described in Adhikari and Singh [1]. In short, Langmuir adsorption isotherm was used to calculate the adsorption parameters, such as: Adsorption maxima ‘b’, and bonding energy coefficient, ‘K’. The conventional form of the Langmuir adsorption isotherm of Pb can be written as: Ce/(x/m) = 1/(K.b) + Ce/b (Eq. 1). Where, Ce is the equilibrium Pb concentration (mg L-1), x/m is the amount of Pb adsorbed by soil (mg kg-1), ‘b’ and ‘K’ are Langmuir constants. The constant ‘K’ is related to the bonding energy of the adsorbent for the Pb (L mg-1). The Langmuir isotherm (Eq. 1) is a straight line where Ce/(x/m) were plotted against Ce. The best fit val- ues of the coefficients ‘b’ and ‘K’ were derived using the isotherm equations, where b = 1/slope, and K = slope/ intercept. Cumulative Pb desorption data were fitted to a modi- fied Langmuir desorption isotherm, which can be written as: De/R = 1/Kd Dm + De/Dm (Eq. 2). Here, De is the concentration of Pb desorbed (mg L-1), and Dm is the desorption maxima (mg kg-1 soil). R is the amount of Pb desorbed per gram of soil (µgg-1 soil), Kd is the constant related to the mobility of lead. Dm and Kd were calculated from the linear plots of De versus De/R. Previous studies [18] also applied this equation in their Pb desorption studies in different soils of Punjab, India. 2.4. Analysis of Thermodynamic Parameters The Pb sorption data obtained at two different tem- peratures (25 2˚C and 45 2˚C) were used to measure the thermodynamic properties of the reactions. Among the different thermodynamic parameters, the variation of thermodynamic equilibrium constant (Ko) were com- puted following the procedure described by Adhhikari and Singh [1]. The value of Ko for the adsorption reaction can be ex- pressed as: Ko = as/ae = s Cs/e Ce (Eq. 3). Where, as denotes activity of adsorbed metal, ae is the activity of metal in equilibrium solution. Cs is the amount (milligrams) of metal adsorbed per unit volume (liter) of solution in contact with the adsorbent surfaces, Ce is the amount (milligrams) of solute per unit volume (liter) of solution in contact with the adsorbent surfaces at equilibrium, s is the activity coefficient of the sorbed metals, and e denotes the activity coefficient of metal at equilibrium. In physical chemistry it is assumed that with the lowering of concentration (Cs and Ce), the ac- tivity coefficients (s and e) approach unity. Therefore, the equation becomes: Ko = Cs/ Ce (Eq. 4). The Ko values were determined by plotting ln (Cs/ Ce) versus Cs and extrapolating to Cs = 0. The standard free energy (ΔGo) was determined by using the following equation: (ΔGo) = –R T ln Ko (Eq. 5). The standard enthalpy (∆Ho) was obtained by using the integrated Vant Hoff equation: ln K2 o/K1 o = ∆Ho/R [1/T1 – 1/T2] (Eq. 6). The standard entropy (So) was measured as: ∆So = (∆Ho – ΔGo)/T (Eq. 7). Statistical operations were performed using the statis- tical software JMP (Version 8, SAS Institute Inc., Cary, NC, USA) 3. RESULTS AND DISCUSSION 3.1. Physicochemical Properties of the Experimental Soils The physicochemical properties of the four experi- mental soils have been described in Ta bl e 1 . The pH of the soils ranged from 5.6 to 6.2; EC values were from 0.08 to 0.15 dSm-1; CEC varied from 11.5 to 23.4 cmol (p+) per kg soil; clay contents were from 15 to 22%, and % organic C ranged from 0.29 to 0.91%. The experi- mental soils were non-calcareous and therefore did not have any CaCO3. Total native Pb content of the soils varied from 16.8 to 34.8 µg g-1 soil; whereas, the DTPA Pb content ranged from 0.21 to 1.48 µgg-1 (Table 1). The percentage of labile Pb, i.e. amount of Pb over total na- tive Pb varied from 1.3 to 7.4%. Overall, the soils varied in their physicochemical characteristics; and expected to show variation in sorption and desorption amounts of Pb. 3.2. Variation of Pb Sorption with Pb Application Rate and Temperature All the soil samples exhibited high capacities to sorb Pb at both 25(±2)˚C and 45(±2)˚C. The amounts of Pb sorption with varying application rates (400, 800, 1000, 1200, 1400, 1600, and 2000 gg-1 soil) have been re- ported in Table 3. We observed that, with increase in Pb concentrations from 400 to 2000 gg-1 soil, the amount of Pb sorption also increased in all the four soils (Table 2). This was expected because more Pb was available for sorption on soil with the increase in application. However, the percentage of Pb sorbed on soils decreased. This was also expected because the availability of the binding sites decreased with the increase in concentration. Previous studies also reported an increase in Pb sorption with the increase in application rate. Shaheen et al. [19] observed Pb sorption in 11 different types of soils. They found increase in Pb sorption with the increase in Pb applica- tion rate from 1 to 4 m ML-1; however, they reported de-  S. K. Dutta et al. / Agricultural Sciences 2 (20 11) 41-48 Copyright © 2011 SciRes. Openly accessible at http://www.scirp.org/journal/AS/ 44 Table 1. Physicochemical properties and total (Pb) contents of the collected soil samples. Sampling Loca- tion /Soil type pH EC (dS m-1) Organic Carbon (%) CaCO3 (%) CEC (cmol(p+)/kg ) Sand (%) Silt (%) Clay (%) Total Pb (µg g-1 ) DTPA Pb (µg g-1 ) Labile Pb (%) Palampur (Fine loamy mixed Typic Dystrudepts) 6.2 0.08 0.91 ND*22.9 64.5 12 22 34.8 1.31 3.8 Jalandhar (Fine sandy loam Typic Usto- chrepts) 5.6 0.08 0.60 ND 23.4 80.9 5 15 20.1 1.48 7.4 Purulia (Fine loamy Typic Ustochrept) 6.1 0.15 0.48 ND 17.9 47.8 33 19 24.9 0.94 3.8 Pudukkottai (Fine sandy loam Udic Haplustalfs) 6.1 0.09 0.29 ND 11.5 73.0 6 20 16.8 0.21 1.3 *ND = Non detectable Tab le 2. Amount and percentage of Pb sorbed (g g-1) at four different soils receiving seven different initial Pb treatments at two different temperatures (25 ± 2˚C and 45 ± 2˚C). Amount of Pb applied per gram soil (g g-1) at 25 (±2)˚C Sampling locations 400 800 1000 1200 1400 1600 2000 Palampur 381.6 (96.5) 757.6 (94.7) 927.1 (92.7)1100.1 91.7) 1268.9 (90.0)1427.8 (89.1) 1763.4 (88.2) Jalandhar 368.2 (92.05) 732.0 (91.5) 889.6 (89.1)1057.8 (88.1) 1221.1 (87.2)1349.5 (84.3) 1670.0 (83.5) Purulia 386.6 (96.7) 758.1 (94.8) 921.8 (92.2)1066.3 (88.9) 1179.1 (84.2)1334.1 (83.4) 1629.8 (81.5) Pudukkottai 355.4 (88.9) 678.9 (84.9) 803.8 (80.4)934.3 (77.9) 991.6 (70.83)1054.6 (65.3) 1216.3 (60.8) Amount of Pb applied per gram soil (g g-1) at 45 (±2)˚C Palampur 395.6 (98.9) 786.6 (98.5) 965.0 (96.5)1154.4 (96.3) 1320.9 (94.4)1480.6 (92.5) 1845.1 (92.3) Jalandhar 397.7 (94.9) 755.2 (94.4) 930.2 (93.0)1115.1 (92.9) 1283.1 (91.7)1455.6 (91.0) 1802.8 (90.1) Purulia 389.1 (97.3) 766.3 (95.8) 929.5 (93.0)1111.8 (92.6) 1271.2 (90.8)1435.6 (89.7) 1668.8 (83.4) Pudukkottai 367.5 (91.8) 689.6 (86.2) 830.8 (83.1)993.5 (82.8) 1055.0 (77.1)1155.0 (72.2) 1269.4 (63.2) (Figures within parentheses denote percent of Pb sorption) Table 3. Langmuir adsorption isotherms, correlation coefficients, and Langmuir parameters for four experimental soils at two different temperatures. Sampling locations At 25(±2)˚C Linear Langmuir equations Correlations of equations (R) Adsorption maxima (b) (mg kg-1) Bonding energy coeffi- cient (k) (L/mg) Palampur y = 0.442x + 5.165 0.97* 2.26 0.086 Jalandhar y = 0.379x + 8.731 0.93* 2.39 0.043 Purulia y = 0.697x + 2.682 0.99* 1.44 0.259 Pudukkottai y = 0.701x + 11.207 0.99* 1.43 0.063 At 45(±2)˚C Palampur y = 0.508x + 1.397 0.98* 1.97 0.360 Jalandhar y = 0.335x + 4.797 0.98* 2.99 0.070 Purulia y = 0.501x + 3.059 0.99* 1.99 0.164 Pudukkottai y = 0.692x + 7.797 0.99* 1.54 0.088 * Statistically significant at p ≤ 0.01. crease in Pb sorption percentage due to less availability of binding space. Although we observed increase in Pb sorption with increase in application rates for all the four experimental soils, there were variations in the sorption amounts. The sorption trend was Typic Dystrudepts > Typic Usto- chrepts (loamy sand) > Typic Ustochrept (loamy) > Typic Haplustalfs (i.e. Palampur soil > Jalandhar soil > Purulia soil > Pudukkottai soil) at all concentrations. This variation might be a consequence of the variation in the % organic C, and CEC values of the soils. The % Organic C and CEC values were also higher for Palam- pur and Jalandhar soils as compared to that of Purulia and Pudukkottai soils (Table 1). Previous studies also reported that % organic C, and CEC played important roles in Pb sorption [2,4,20,21]. Singh and Sekhon [18] observed a significant correlation of sorption maxima with CEC, clay contents, and % organic C for some of the Punjab soils. Adhikari and Singh [1] reported that variations in sorption maxima were correlated with the 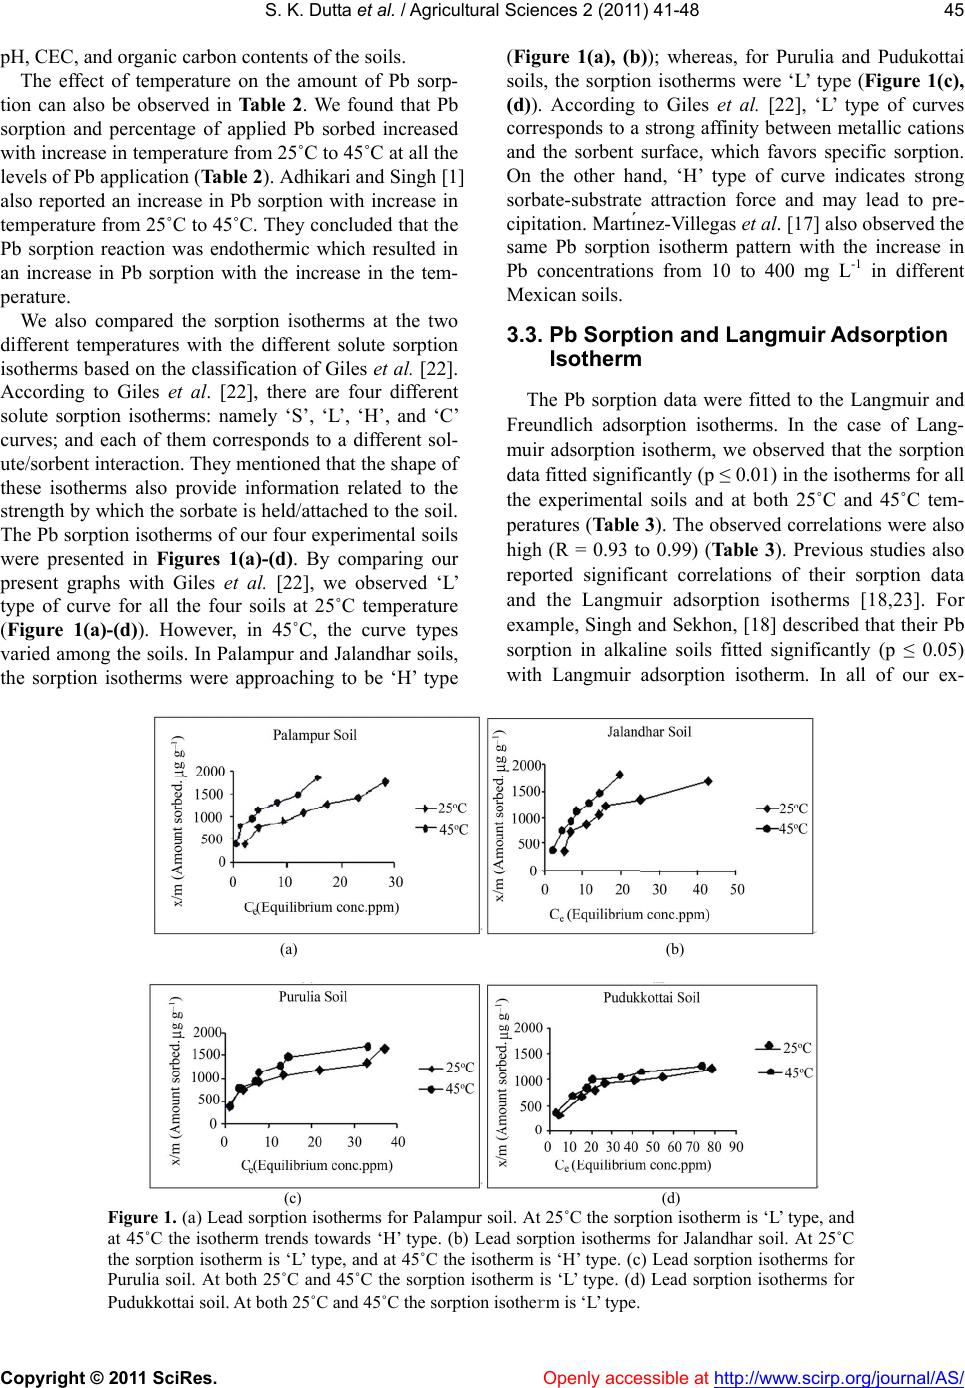 S. K. Dutta et al. / Agricultural Sciences 2 (20 11) 41-48 Copyright © 2011 SciRes. Openly accessi ble at http://www.scirp.org/journal/AS/ 45 pH, CEC, and organic carbon contents of the soils. The effect of temperature on the amount of Pb sorp- tion can also be observed in Ta b l e 2. We found that Pb sorption and percentage of applied Pb sorbed increased with increase in temperature from 25˚C to 45˚C at all the levels of Pb application (Table 2). Adhikari and Singh [1] also reported an increase in Pb sorption with increase in temperature from 25˚C to 45˚C. They concluded that the Pb sorption reaction was endothermic which resulted in an increase in Pb sorption with the increase in the tem- perature. We also compared the sorption isotherms at the two different temperatures with the different solute sorption isotherms based on the classification of Giles et al. [22]. According to Giles et al. [22], there are four different solute sorption isotherms: namely ‘S’, ‘L’, ‘H’, and ‘C’ curves; and each of them corresponds to a different sol- ute/sorbent interaction. They mentioned that the shape of these isotherms also provide information related to the strength by which the sorbate is held/attached to the soil. The Pb sorption isotherms of our four experimental soils were presented in Figures 1(a)-(d). By comparing our present graphs with Giles et al. [22], we observed ‘L’ type of curve for all the four soils at 25˚C temperature (Figure 1(a)-(d)). However, in 45˚C, the curve types varied among the soils. In Palampur and Jalandhar soils, the sorption isotherms were approaching to be ‘H’ type (Figure 1(a), (b)); whereas, for Purulia and Pudukottai soils, the sorption isotherms were ‘L’ type (Figure 1(c), (d)). According to Giles et al. [22], ‘L’ type of curves corresponds to a strong affinity between metallic cations and the sorbent surface, which favors specific sorption. On the other hand, ‘H’ type of curve indicates strong sorbate-substrate attraction force and may lead to pre- cipitation. Martı́nez-Villegas et al. [17] also observed the same Pb sorption isotherm pattern with the increase in Pb concentrations from 10 to 400 mg L-1 in different Mexican soils. 3.3. Pb Sorption and Langmuir Adsorption Isotherm The Pb sorption data were fitted to the Langmuir and Freundlich adsorption isotherms. In the case of Lang- muir adsorption isotherm, we observed that the sorption data fitted significantly (p ≤ 0.01) in the isotherms for all the experimental soils and at both 25˚C and 45˚C tem- peratures (Table 3). The observed correlations were also high (R = 0.93 to 0.99) (Ta b le 3). Previous studies also reported significant correlations of their sorption data and the Langmuir adsorption isotherms [18,23]. For example, Singh and Sekhon, [18] described that their Pb sorption in alkaline soils fitted significantly (p ≤ 0.05) with Langmuir adsorption isotherm. In all of our ex- (a) (b) (c) (d) Figure 1. (a) Lead sorption isotherms for Palampur soil. At 25˚C the sorption isotherm is ‘L’ type, and at 45˚C the isotherm trends towards ‘H’ type. (b) Lead sorption isotherms for Jalandhar soil. At 25˚C the sorption isotherm is ‘L’ type, and at 45˚C the isotherm is ‘H’ type. (c) Lead sorption isotherms for Purulia soil. At both 25˚C and 45˚C the sorption isotherm is ‘L’ type. (d) Lead sorption isotherms for Pudukkottai soil. At both 25˚C and 45˚C the sorption isotherm is ‘L’ type. 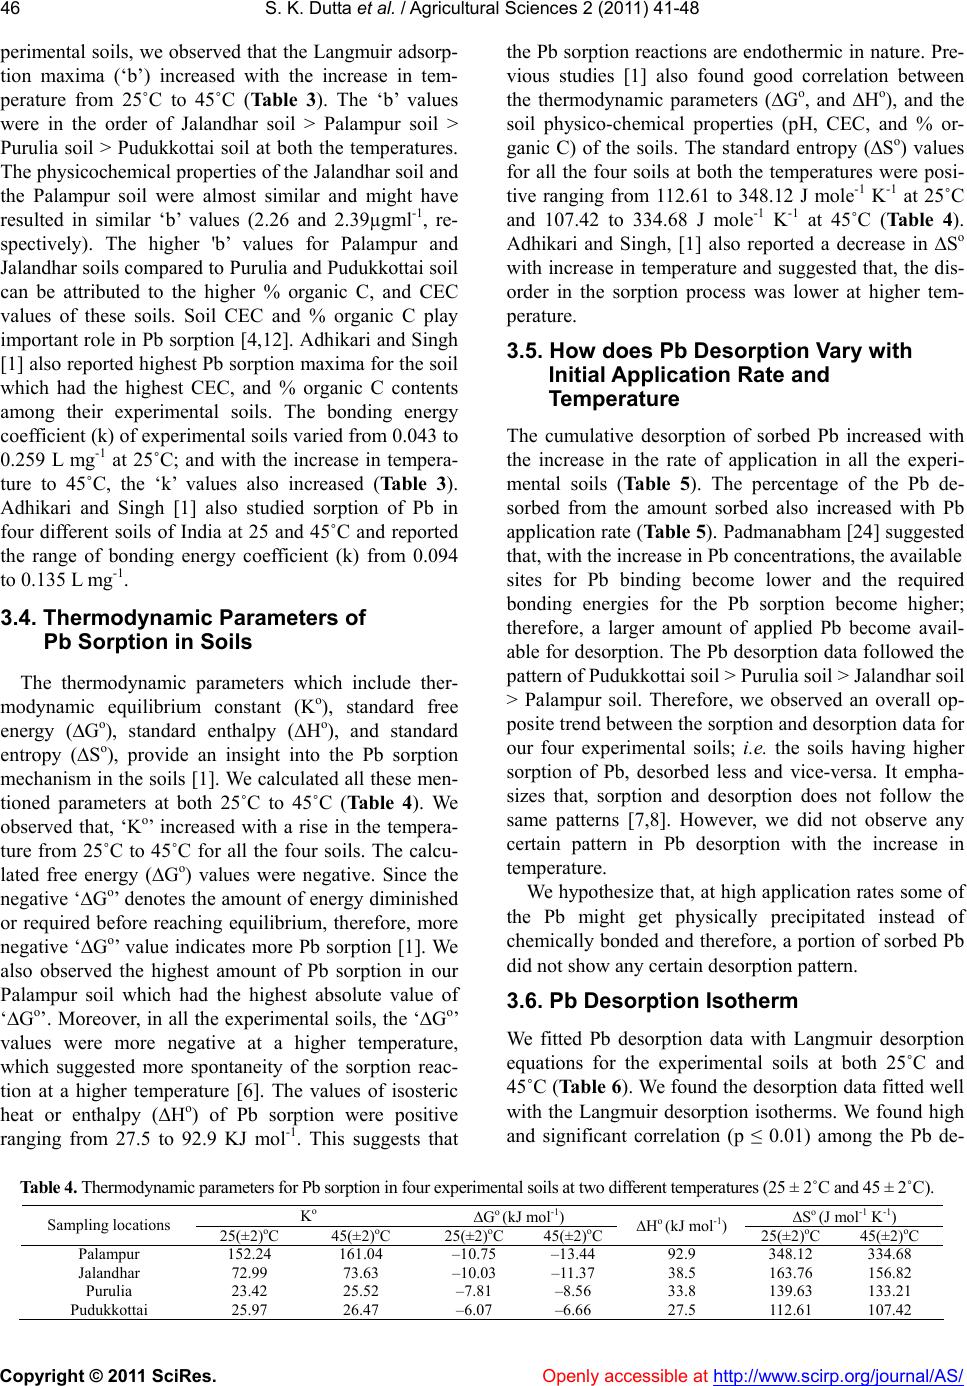 S. K. Dutta et al. / Agricultural Sciences 2 (20 11) 41-48 Copyright © 2011 SciRes. Openly accessi ble at http://www.scirp.org/journal/AS/ 46 perimental soils, we observed that the Langmuir adsorp- tion maxima (‘b’) increased with the increase in tem- perature from 25˚C to 45˚C (Table 3). The ‘b’ values were in the order of Jalandhar soil > Palampur soil > Purulia soil > Pudukkottai soil at both the temperatures. The physicochemical properties of the Jalandhar soil and the Palampur soil were almost similar and might have resulted in similar ‘b’ values (2.26 and 2.39µgml-1, re- spectively). The higher 'b’ values for Palampur and Jalandhar soils compared to Purulia and Pudukkottai soil can be attributed to the higher % organic C, and CEC values of these soils. Soil CEC and % organic C play important role in Pb sorption [4,12]. Adhikari and Singh [1] also reported highest Pb sorption maxima for the soil which had the highest CEC, and % organic C contents among their experimental soils. The bonding energy coefficient (k) of experimental soils varied from 0.043 to 0.259 L mg-1 at 25˚C; and with the increase in tempera- ture to 45˚C, the ‘k’ values also increased (Table 3). Adhikari and Singh [1] also studied sorption of Pb in four different soils of India at 25 and 45˚C and reported the range of bonding energy coefficient (k) from 0.094 to 0.135 L mg-1. 3.4. Thermodynamic Parameters of Pb Sorption in Soils The thermodynamic parameters which include ther- modynamic equilibrium constant (Ko), standard free energy (Go), standard enthalpy (Ho), and standard entropy (So), provide an insight into the Pb sorption mechanism in the soils [1]. We calculated all these men- tioned parameters at both 25˚C to 45˚C (Table 4). We observed that, ‘Ko’ increased with a rise in the tempera- ture from 25˚C to 45˚C for all the four soils. The calcu- lated free energy (Go) values were negative. Since the negative ‘Go’ denotes the amount of energy diminished or required before reaching equilibrium, therefore, more negative ‘Go’ value indicates more Pb sorption [1]. We also observed the highest amount of Pb sorption in our Palampur soil which had the highest absolute value of ‘Go’. Moreover, in all the experimental soils, the ‘Go’ values were more negative at a higher temperature, which suggested more spontaneity of the sorption reac- tion at a higher temperature [6]. The values of isosteric heat or enthalpy (Ho) of Pb sorption were positive ranging from 27.5 to 92.9 KJ mol-1. This suggests that the Pb sorption reactions are endothermic in nature. Pre- vious studies [1] also found good correlation between the thermodynamic parameters (Go, and Ho), and the soil physico-chemical properties (pH, CEC, and % or- ganic C) of the soils. The standard entropy (So) values for all the four soils at both the temperatures were posi- tive ranging from 112.61 to 348.12 J mole-1 K-1 at 25˚C and 107.42 to 334.68 J mole-1 K -1 at 45˚C (Table 4). Adhikari and Singh, [1] also reported a decrease in So with increase in temperature and suggested that, the dis- order in the sorption process was lower at higher tem- perature. 3.5. How does Pb Desorption Vary with Initial Application Rate and Temperature The cumulative desorption of sorbed Pb increased with the increase in the rate of application in all the experi- mental soils (Table 5). The percentage of the Pb de- sorbed from the amount sorbed also increased with Pb application rate (Table 5). Padmanabham [24] suggested that, with the increase in Pb concentrations, the available sites for Pb binding become lower and the required bonding energies for the Pb sorption become higher; therefore, a larger amount of applied Pb become avail- able for desorption. The Pb desorption data followed the pattern of Pudukkottai soil > Purulia soil > Jalandhar soil > Palampur soil. Therefore, we observed an overall op- posite trend between the sorption and desorption data for our four experimental soils; i.e. the soils having higher sorption of Pb, desorbed less and vice-versa. It empha- sizes that, sorption and desorption does not follow the same patterns [7,8]. However, we did not observe any certain pattern in Pb desorption with the increase in temperature. We hypothesize that, at high application rates some of the Pb might get physically precipitated instead of chemically bonded and therefore, a portion of sorbed Pb did not show any certain desorption pattern. 3.6. Pb Desorption Isotherm We fitted Pb desorption data with Langmuir desorption equations for the experimental soils at both 25˚C and 45˚C (Table 6). We found the desorption data fitted well with the Langmuir desorption isotherms. We found high and significant correlation (p ≤ 0.01) among the Pb de- Table 4. Thermodynamic parameters for Pb sorption in four experimental soils at two different temperatures (25 ± 2˚C and 45 ± 2˚C). Ko Go (kJ mol-1) So (J mol-1 K-1) Sampling locations 25(±2)oC 45(±2)oC 25(±2)oC 45(±2)oCHo (kJ mol-1) 25(±2)oC 45(±2)oC Palampur 152.24 161.04 –10.75 –13.44 92.9 348.12 334.68 Jalandhar 72.99 73.63 –10.03 –11.37 38.5 163.76 156.82 Purulia 23.42 25.52 –7.81 –8.56 33.8 139.63 133.21 Pudukkottai 25.97 26.47 –6.07 –6.66 27.5 112.61 107.42 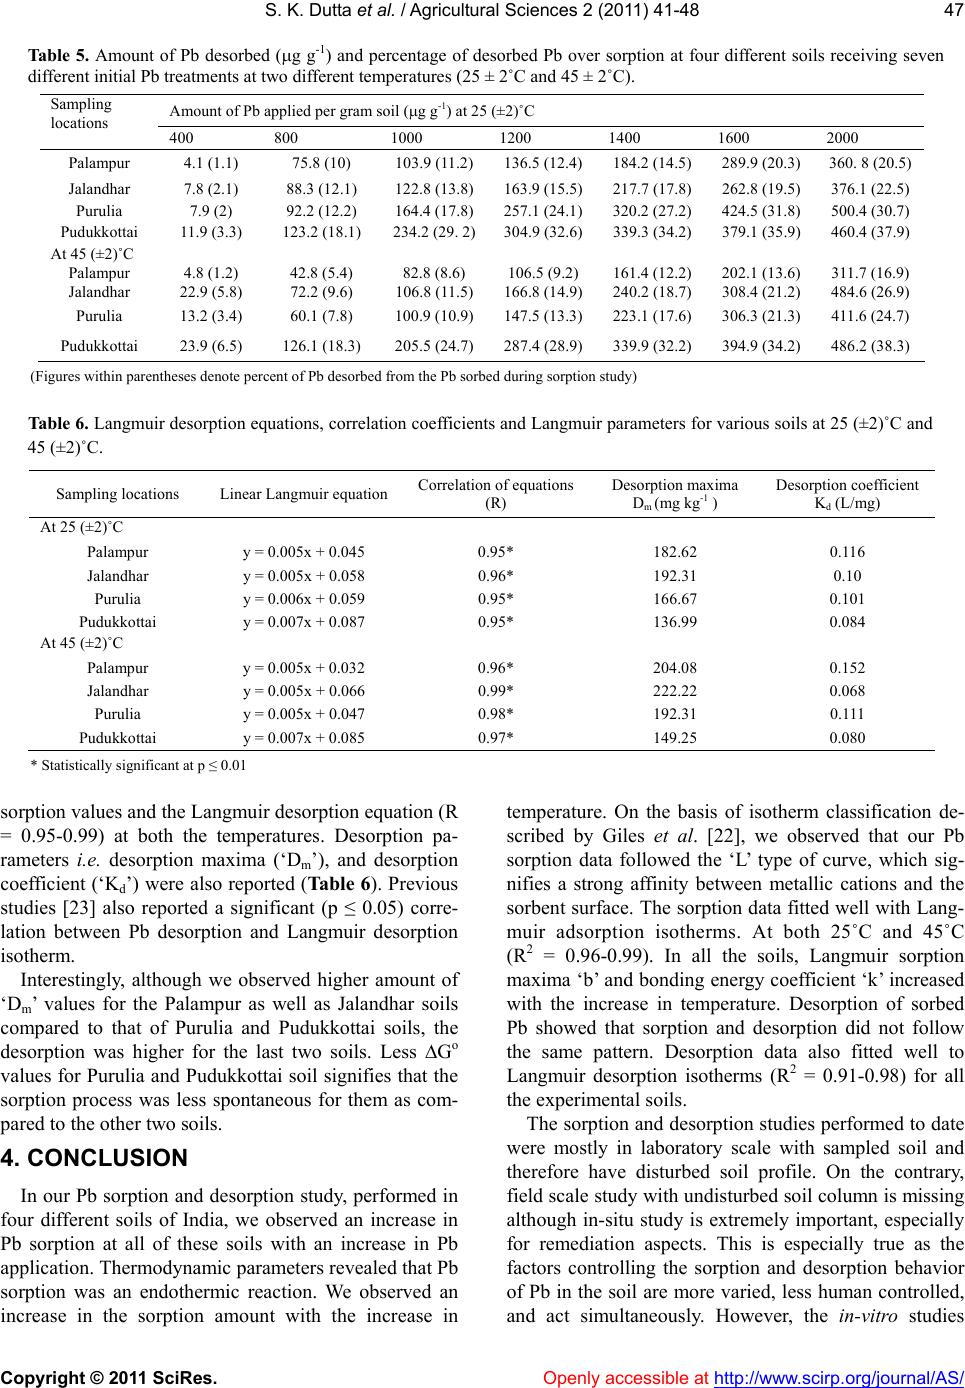 S. K. Dutta et al. / Agricultural Sciences 2 (20 11) 41-48 Copyright © 2011 SciRes. Openly accessi ble at http://www.scirp.org/journal/AS/ 47 Table 5. Amount of Pb desorbed (g g-1) and percentage of desorbed Pb over sorption at four different soils receiving seven different initial Pb treatments at two different temperatures (25 ± 2˚C and 45 ± 2˚C). Amount of Pb applied per gram soil (g g-1) at 25 (±2)˚C Sampling locations 400 800 1000 1200 1400 1600 2000 Palampur 4.1 (1.1) 75.8 (10) 103.9 (11.2)136.5 (12.4)184.2 (14.5)289.9 (20.3) 360. 8 (20.5) Jalandhar 7.8 (2.1) 88.3 (12.1) 122.8 (13.8)163.9 (15.5)217.7 (17.8)262.8 (19.5) 376.1 (22.5) Purulia 7.9 (2) 92.2 (12.2) 164.4 (17.8)257.1 (24.1)320.2 (27.2)424.5 (31.8) 500.4 (30.7) Pudukkottai 11.9 (3.3) 123.2 (18.1) 234.2 (29. 2)304.9 (32.6)339.3 (34.2)379.1 (35.9) 460.4 (37.9) At 45 (±2)˚C Palampur 4.8 (1.2) 42.8 (5.4) 82.8 (8.6) 106.5 (9.2) 161.4 (12.2)202.1 (13.6) 311.7 (16.9) Jalandhar 22.9 (5.8) 72.2 (9.6) 106.8 (11.5)166.8 (14.9)240.2 (18.7)308.4 (21.2) 484.6 (26.9) Purulia 13.2 (3.4) 60.1 (7.8) 100.9 (10.9)147.5 (13.3)223.1 (17.6)306.3 (21.3) 411.6 (24.7) Pudukkottai 23.9 (6.5) 126.1 (18.3) 205.5 (24.7)287.4 (28.9)339.9 (32.2)394.9 (34.2) 486.2 (38.3) (Figures within parentheses denote percent of Pb desorbed from the Pb sorbed during sorption study) Table 6. Langmuir desorption equations, correlation coefficients and Langmuir parameters for various soils at 25 (±2)˚C and 45 (±2)˚C. Sampling locations Linear Langmuir equationCorrelation of equations (R) Desorption maxima Dm (mg kg-1 ) Desorption coefficient Kd (L/mg) At 25 (±2)˚C Palampur y = 0.005x + 0.045 0.95* 182.62 0.116 Jalandhar y = 0.005x + 0.058 0.96* 192.31 0.10 Purulia y = 0.006x + 0.059 0.95* 166.67 0.101 Pudukkottai y = 0.007x + 0.087 0.95* 136.99 0.084 At 45 (±2)˚C Palampur y = 0.005x + 0.032 0.96* 204.08 0.152 Jalandhar y = 0.005x + 0.066 0.99* 222.22 0.068 Purulia y = 0.005x + 0.047 0.98* 192.31 0.111 Pudukkottai y = 0.007x + 0.085 0.97* 149.25 0.080 * Statistically significant at p ≤ 0.01 sorption values and the Langmuir desorption equation (R = 0.95-0.99) at both the temperatures. Desorption pa- rameters i.e. desorption maxima (‘Dm’), and desorption coefficient (‘Kd’) were also reported (Table 6). Previous studies [23] also reported a significant (p ≤ 0.05) corre- lation between Pb desorption and Langmuir desorption isotherm. Interestingly, although we observed higher amount of ‘Dm’ values for the Palampur as well as Jalandhar soils compared to that of Purulia and Pudukkottai soils, the desorption was higher for the last two soils. Less Go values for Purulia and Pudukkottai soil signifies that the sorption process was less spontaneous for them as com- pared to the other two soils. 4. CONCLUSION In our Pb sorption and desorption study, performed in four different soils of India, we observed an increase in Pb sorption at all of these soils with an increase in Pb application. Thermodynamic parameters revealed that Pb sorption was an endothermic reaction. We observed an increase in the sorption amount with the increase in temperature. On the basis of isotherm classification de- scribed by Giles et al. [22], we observed that our Pb sorption data followed the ‘L’ type of curve, which sig- nifies a strong affinity between metallic cations and the sorbent surface. The sorption data fitted well with Lang- muir adsorption isotherms. At both 25˚C and 45˚C (R2 = 0.96-0.99). In all the soils, Langmuir sorption maxima ‘b’ and bonding energy coefficient ‘k’ increased with the increase in temperature. Desorption of sorbed Pb showed that sorption and desorption did not follow the same pattern. Desorption data also fitted well to Langmuir desorption isotherms (R2 = 0.91-0.98) for all the experimental soils. The sorption and desorption studies performed to date were mostly in laboratory scale with sampled soil and therefore have disturbed soil profile. On the contrary, field scale study with undisturbed soil column is missing although in-situ study is extremely important, especially for remediation aspects. This is especially true as the factors controlling the sorption and desorption behavior of Pb in the soil are more varied, less human controlled, and act simultaneously. However, the in-vitro studies  S. K. Dutta et al. / Agricultural Sciences 2 (20 11) 41-48 Copyright © 2011 SciRes. Openly accessi ble at http://www.scirp.org/journal/AS/ 48 determining the fate of heavy metals like Pb could be an initial step to understand the environmental processes. Therefore, with the knowledge and concept of laboratory analyses, in-situ field study related to heavy metal sorp- tion is required under various environmental conditions. 5. ACKNOWLEDGEMENTS Grateful acknowledgement is extended to Punjab Agricultural Uni- versity, India, for providing laboratory facility. Indian Council of Ag- riculture Research provided fellowship to the graduate student (Sudar- shan Dutta) to complete the research. Authors show special gratitude to H. S. Hundal, PhD, Department of Soils, and S. S. Bhardwaj (Phd), Department of Chemistry, Punjab Agricultural University; Pritha Dey, Department of Bioinformatics, Sikkim Manipal University of Health Science & Technology, and Obaidur Rahaman, Chemistry Department, University of Delaware for their overall support. REFERENCES [1] Adhikari, T. and Singh, M.V. (2003) Sorption character- istics of lead and cadmium in some soils of India. Ge- oderma, 114, 81-92. doi:10.1016/S0016-7061(02)00352-X [2] Mouni, L., Merabet, D., Robert, D. and Bouzaza, A. (2009) Batch studies for the investigation of the sorption of the heavy metals Pb2+ and Zn2+ onto Amizour soil (Algeria). Geoderma, 154, 30-35. [3] Singh, S.P., Ma, L.Q. and Harris, W.G. (2001) Heavy metal interactions with phosphatic clay: Sorption and desorption behavior. Journal of Environmental Quality, 30, 1961-1968. doi:10.2134/jeq2001.1961 [4] Strawn, D.G. and Sparks, D.L. (2000) Effect of soil or- ganic matter on the kinetics and mechanisms of Pb (II) sorption and desorption in soil. Soil Science Society of America Journal, 64, 144-156. [5] Aziz, H.M.A. (2005) Sorption equilibria of lead (II) on some Palestinian soils-the natural ion exchangers. Col- loids Surfaces A: Physicochemical and Engineering As- pects, 264, 1-5. doi:10.1016/j.colsurfa.2004.11.001 [6] Jurinak, J.J. and Bauer, N. (1956) Thermodynamics of zinc adsorption on calcite, dolomite and magnesite type minerals. Proceedings Soil Science So ciety of America, 20, 466-471. [7] Eick, M.J., Peak, J.D., Brady, P.V. and Pesek, J.D. (1999) Kinetics of lead adsorption/desorption on goethite: Resi- dence time effect. Soil Science, 164, 28-39. [8] Sparks, D.L. (2003) Environmental soil chemistry. 2nd Edition, Academic Press, New York. [9] McBride, M.B. (1999) Chemisorption and precipitation reactions. In: Summer, M.E., Ed., Handbook of Soil Sci- ence, CRC Press, Boca Raton, Florida. [10] Sparks, D.L. (1989) Kinetics of Soil Chemical Processes. Academic Press, New York. [11] Gajbhiye, K.S. and Mandal, C. (2006) Agro-ecological zones, their soil resource and cropping systems. Internet Available: http://www.indiawaterportal.org/sites/indiawaterportal.or g/files/01jan00sfm1.pdf [12] Dutta, S.K., Singh, D. and Sood, A. (2011) Effect of soil chemical and physical properties on sorption and desorp- tion behavior of lead in different soils of India. Soil Sediment Contamination: An International Journal, 20, 2011. Accepted, In press. [13] Tessier, A.P., Campbell, G.C. and Bisson, M. (1979) Sequential extraction procedure for the speciation of par- ticulate trace metals. Analytical Chemistry, 51, 844-851. [14] Lindsay, W.L. and Norvell, W.A. (1978) Development of DTPA soil test for zinc, iron, manganese and copper. Soil Science Society of America Journal, 42, 421-428. doi:10.2136/sssaj1978.03615995004200030009x [15] Soon, Y.K. (1981) Solubility and sorption of cadmium in soils amended with sewage sludge. Journal of Soil Sci- ence, 32, 85-95. [16] Boekhold, A.E., Temminghof, E.J.M. and Van-der-Zee, S.E.A.T.M. (1993) Influence of electrolyte composition and pH on cadmium adsorption by an acid sandy soil. Journal of Soil Science, 44, 85-96. doi:10.1111/j.1365-2389.1993.tb00436.x [17] Martínez-Villegas, N., Flores-Vélez, L.M. and Domín- guez, O. (2004) Sorption of lead in soil as a function of pH: a study case in México. Chemosphere, 57, 1537-1542. [18] Singh, B. and Sekhon, G.S. (1977) Adsorption, desorption and solubility relationships of lead and cadmium in some alkaline soils. Journal of Soil Science, 28, 271-275. doi:10.1111/j.1365-2389.1977.tb02235.x [19] Shaheen, S.B. (2009) Sorption and lability of cadmium and lead in different soils from Egypt and Greece. Ge- oderma, 153, 61-68. [20] Appel, C. and Ma, L.Q. (2002) Concentration, pH and surface charge effects on cadmium and lead sorption in three tropical soils. Journal of Enviro nmental Qua lity , 31, 581-589. doi:10.2134/jeq2002.0581 [21] Dutta, S.K., Srinidhi, H.V., Kanrar, B. and Singh, D. (2007) Effect of pH on sorption and desorption behavior of lead in three different soils of India. Environmental Ecology, 25, 337-340. [22] Giles, C. H., D’Silva, A. P. and Easton, I.A. (1974) A general treatment and classification of the solute adsorp- tion isotherm. Journal of Colloid Interface Science, 47, 766-78. doi:10.1016/0021-9797(74)90253-7 [23] Welp, G. and Brümmer, G.W. (1999) Adsorption and solubility of ten metals in soil samples of different com- position. Journal of Plant Nutrition and Soil Scien ce, 162, 166-161. doi:10.1071/SR9830515 [24] Padmanabham, M. (1983) Comparative study of the ad- sorption-desorption behaviour of copper(II), zinc(II), co- balt(II) and lead(II) at the goethite solution interface. Australian Journal of Soil Research, 21, 515-525. |