C. L. MEI ET AL.
Copyright © 2013 SciRes. ENG
nerve growth factor (NGF 2.5S; Promega, Madison, WI)
and Cultured with serum-free DMEM for 6 days. Ob-
served and photog ra phed.
2.2. MAP2 Immunocytochemical Analysis
The cells were fixed with 4% paraformaldehyde/PBS and
were permeabilized with 0.1% Triton X-100 in PBS for
10 min. The cells were then incubated in 5% goat se-
rum/PBS for 1 h at room temperature. Cells were washed
again then incubated at 4˚C overnight in the presence of
anti-MAP2 (1:1000 dilution, Santa SC-20172). After
washing twice with PBS, the cells were incubated with
fluorescently labeled secondary Cy3-goat anti-rabbit
(Santa ) for 1 hour at room temperature [5]. The results
were observed by a fluorescence microscope equipped
with a photomicrograph system.
2.3. OGD Model of PC12 Cells after NGF
Treatment
PC12 cells were treated with NGF for 6 days. Cells were
then washed 3 times with DMEM, and the cells were
cultured with DMEM in the presence of no sugar and 1
mmol/l Na2S2O4 in hypoxic conditions (37˚C, 5% CO2
and 95% N2) for 3 h, 6 h, 9 h, 12 h, 16 h, or 24 h.
2.4. Cell Viability Assay
The MTT method was used to assess the cytotoxic ef-
fects of GbE. The cells were grown to a density of 5 ×
104 cells/well and were then treated with 10 ng/ml, 20
ng/ml, 30 ng/ml, 50 ng/ml and 100 ng/ml GbE in a
96-well plate for 24 h. At the end of the treatment, the
GbE -containing medium was carefully removed and the
cells were treated with OGD for 16 h. The culture me-
dium was removed and 200 μl medium containing 20 μl
MTT (5 mg/ml in PBS) (St. Louis, MO, USA) was added
to each well. After 4 h of incubation at 37˚C, the medium
was removed and 100 μl DMSO was added to each well.
The optical absorbance (A) of each well was read at 490
nm. The percentage of viable cells was calculated as fol-
lows: (A of experimental group/A of control group) ×
100%.
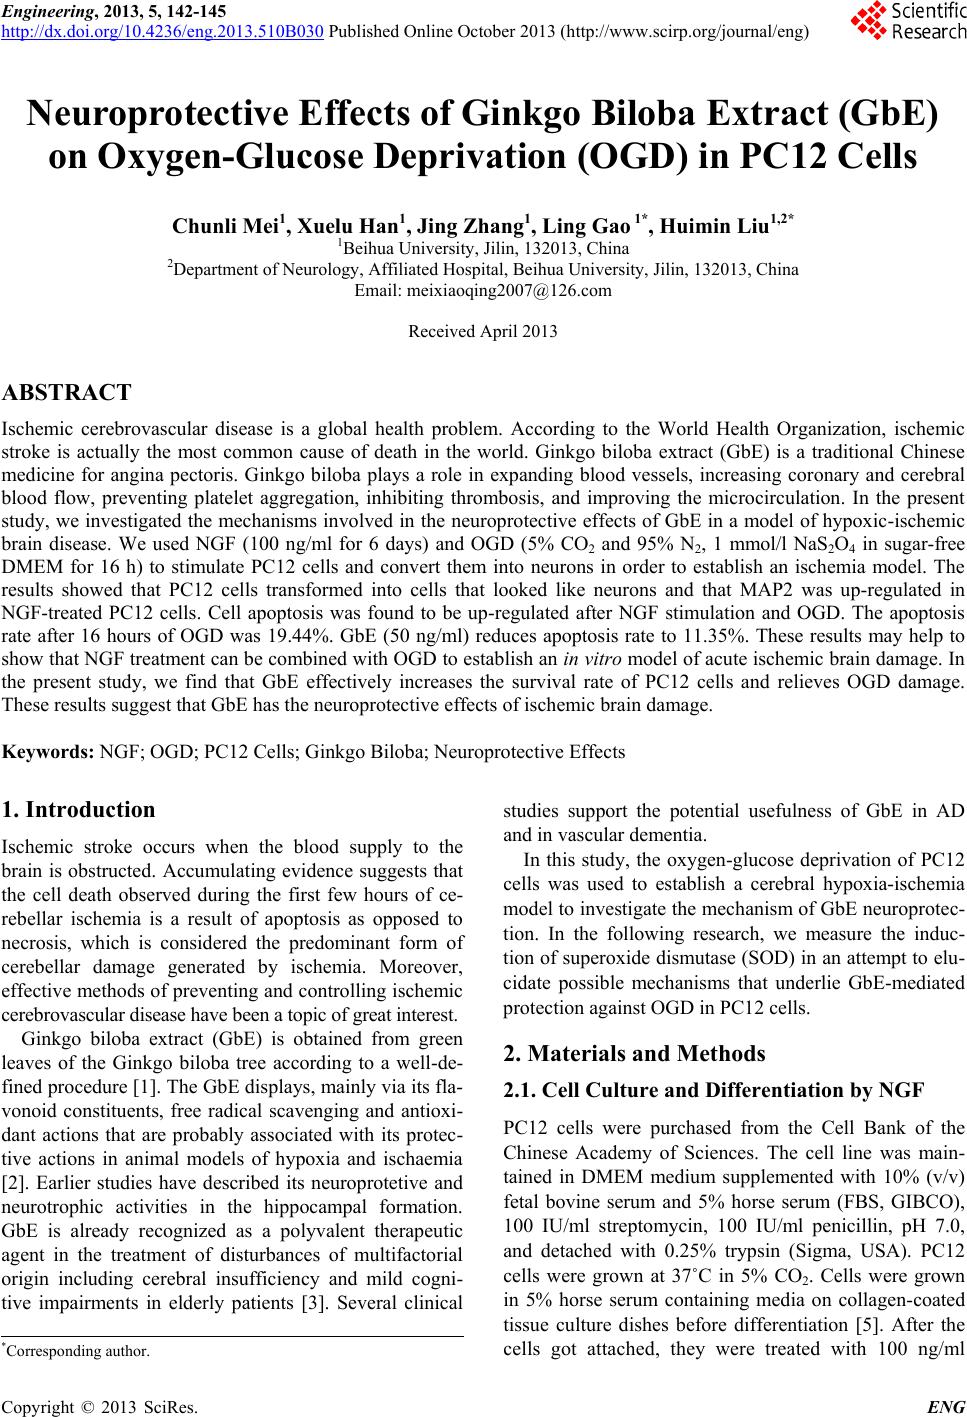
2.5. Hoechst 33258/PI Staining
The cells were washed three times with DMEM and were
incubated in DMEM containing 50 ng/ml GbE for 24 h.
The cells were washed three times with DMEM and were
incubated for 16 h in DMEM containing 1 mmol/l
NaS2O4 under hypoxic conditions (37˚C, 5% CO2 and
95% N2) in the absence of sugar [5] The cells were
stained with PI (10 µg/ml) and Hoechst 33258 (10 µg/ml,
Sigma, USA) and then fixed by 4% paraformaldehyde.
For each cover slide, 1000 ~ 1500 cells were examined
under a fluorescence microscope (Olympus BX51, Japan)
and photographed with a digital camera (Olympus, Ja-
pan). The results were expressed as the percentages of
apoptotic cells and necrotic cells, respectively.
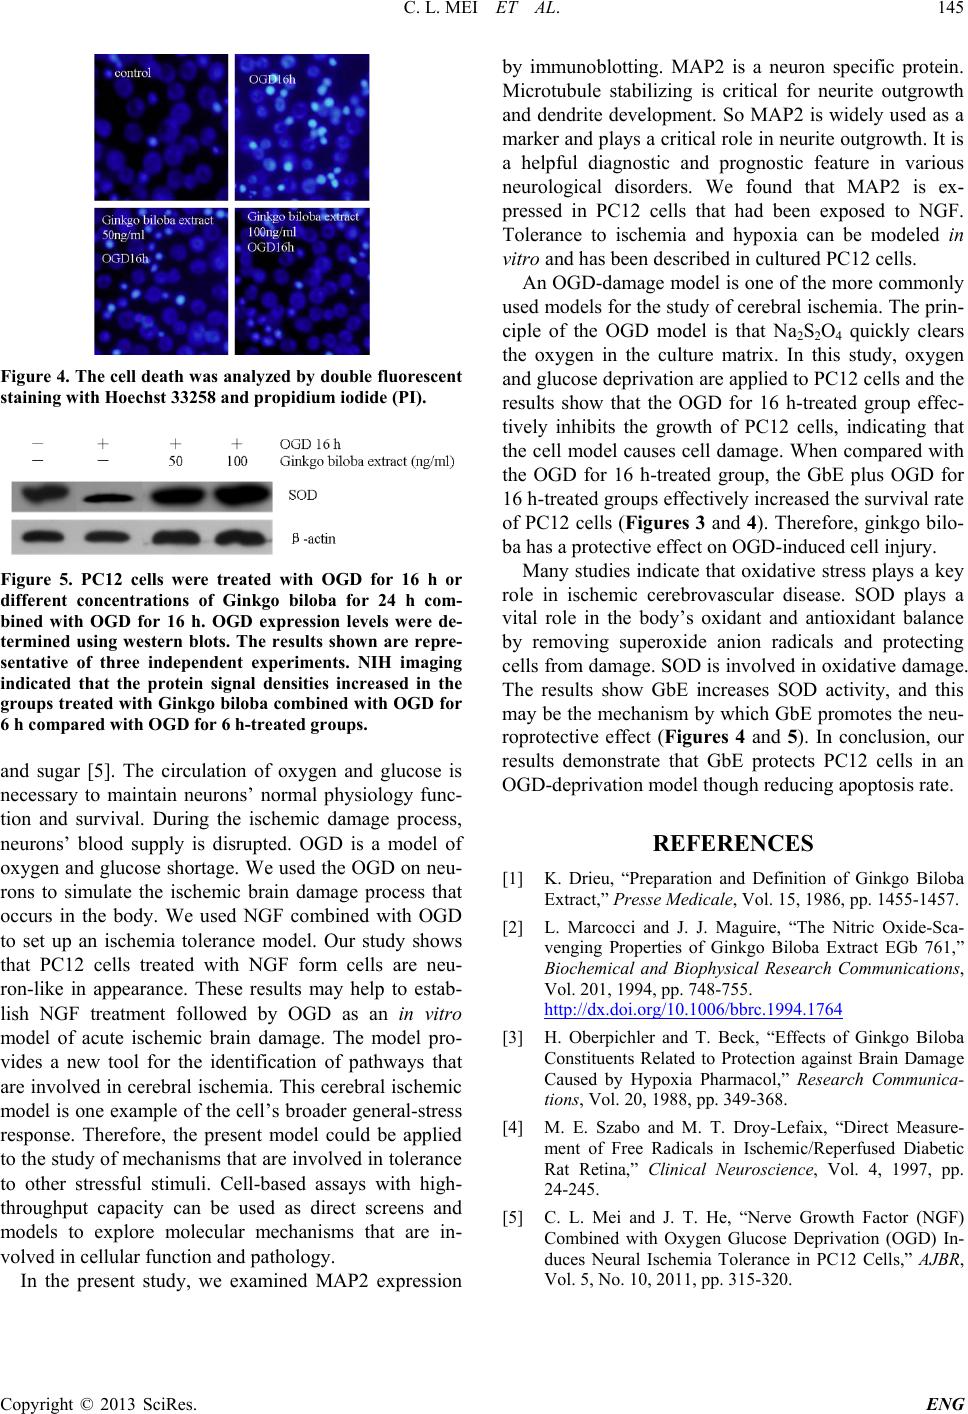
2.6. Western Blotting Analysis
After treatment with GbE and OGD for 16 h , the cells
were washed twice using cold PBS and 1 × 10⁶ cells
were lysed using RIPA buffer (50 mmol/l Tris (pH 8.0),
150 mmol/l NaCl, 0.1% SDS, 1% NP40 and 0.5% so-
dium deoxycholate) containing protease inhibitors (1%
cocktail and 1 mmol/l PMSF). Total proteins were sepa-
rated using 15% SDS-PAGE and were transferred to a
PVDF membrane. The membrane was blocked using
Tris-buffered saline with 0.1% Tween 20 (pH 7.6, TBST)
for 1 h at room temperature and was incubated with the
primary antibody solution (1:1000) at 4˚C overnight.
After two washes in TBST, the membrane was incubated
with the HRP-labeled secondary antibody (Santa SC-
2073) for 1 h at room temperature and was washed three
times with TBST. The final detection was performed
using enhanced chemiluminescence (ECL) western blot-
ting reagents (Amersham Biosciences, Piscataway, NJ)
and the membrane was exposed to Lumi-Film Chemilu-
minescent Detection Film (Roche). Loading differences
were normalized using a monoclonal ß-actin antibody.
The antibodies used in the study included SOD (Santa
SC-18503) and ß-actin (Santa SC-2021).
2.7. Statistical Analysis
SPSS software was used for statistical analyses, and val-
ues are presented as means ± SD. An ANOVA was used
to compare the mean values. P values less than 0.05 were
considered to indicate statistically significant differences.
3. Results
3.1. Morphological Changes of PC12 Cells
The results show that treatment with NGF (100 ng/ml)
stimulates neuron-like differentiation of PC12 cells as
seen under the microscope. PC12 cells changed into
neurons after 1 day of NGF treatment and later formed
synapses. Synapses extended up the length of the cell
after 3 days of treatmen t. T he synaptic length increased 6
-to 8 -fold after 6 days of treatment. Bars = 20 um, Invert
microscope, Olympus IX71, Japan (×200) (Figure 1).
3.2. Immunoflu orescence Analysis
The results showed that PC12 cells cultured with NGF
for 6 da ys showed characteristic MAP2 immunofluores-
cence staining (Figure 2). Application plus pro 6.0 soft-
ware to add image fusion after confirm purple fluores-