Engineering, 2013, 5, 126-131
http://dx.doi.org/10.4236/eng.2013.510B026 Published Online October 2013 (http://www.scirp.org/journal/eng)
Copyright © 2013 SciRes. ENG
Triangle Characters of Electr ocardiogram for
Distinguishing States between Exercise and Relaxation
Yanjun Li, Hong Yan, Jinzhong Song, Xinming Yu, Zongxiao Sun, Hua Wei
China Astronaut Research and Training Center, Beijing, China
Email: ************
Received January 2013
ABSTRACT
Will exercise-induced cardiovascular workload be monitored by Electrocardiogram (ECG) waveform morphology? The
discrimination ability of ECG morphology from 30 subjects was tested for distinguishing states between exercise and
relaxation in terms of side length s, lengths of high lines, angles, perimeters and area s of triangle Q RS and triangle T . As
a result, 4 characters from triangle QRS had signif icant differences (t test, p < 0.05) for over 85% of subjects in distin-
guishing between exercis e states and relaxation states, which w ere: ratio of QR side length to RS side len gth in triangle
QRS, angle S and angle Q, as well as the ratio between them. Moreover, ratio of angle S to angle Q had significant dif-
ferences (t test, p < 0.05) for all subjects. In conclusion, triangle characters in ECG could be used to distinguish exercise
states from relaxation states.
Keywords: Electrocardiogram (ECG); Exercise ECG; Exercise -Induced ECG C ha nges; Triangle QRS; Triangle T
1. Introduction
Physical stress during exercise is often monitored by
diversified biomedical signals, e.g., Photoplethysmogram
(PPG), Electromyogram (EMG), respiratory frequency,
blood pressure (BP), Phonocardiogram (PCG), Electro-
cardiogram (ECG), echocardiogram. And heart rate (HR),
heart rate variability (HRV) and systolic blood pressure
(SBP) are often considered to be the most popular indices
nowadays used in monitoring the activity of physical
stress. Activity of parasympathetic (vagal), activity of
sympathetic, and the balance between them reveal the
effects of stress level on autonomic nervous system
(ANS). Parasympathetic tone predominates during relax-
ation period, sympathetic tone predominates during exer-
cise period which increases the cardiovascular workload
and hemodynamic stress (increases HR and SBP while
reduces HRV), while parasympathetic tone re-predomi-
nates during the recovery period which decreases myo-
cardial function and reduced exercise capacity (reduces
HR and SBP while increases HRV) [1]. In the range of
physiological investigations available, measurements of
HR and HRV which could be derived from heart-rooted
signals (e.g. ECG, PCG and PPG), still form the most
non-invasive tool for monitoring the effectiveness of
stress on ANS activity [2]. Exercise ECG or stress ECG
is mostly used to evaluate exercise capacity and detect
exercise-induced myocardial ischemia (MI) or assess the
presence and severity of coronary artery disease (CAD)
[3], which is more direct and less expensive than other
ways such as imaging technology.
However, most researchers focused on detecting MI or
CAD by exercise ECG, while the changes in ECG mor-
phological characters have been analyzed less intensively
in healthy persons in exercise states. Normal changes in
ECG that induced by exercise are usually functional or
physiological, and are not associated with cardiac patho-
logical changes and have no clinical effects. Both mental
and physical stress increases sympathetic activity and
decreases parasympathetic activity [2], which is easily
reflected by HR and HRV: HR increases while HRV
decreases under stress compared with relaxation [2].
However, more information may be contained in ECG
waveform morphology than the ECG rhythm (HR and
HRV) [4]. Because of that, variables from morphology
may provide incremental value to conventional analysis
for detecting exercise-induced ECG changes.
We made the definition of Electrocardio-waveform
variability (ECWV) [4] and achieved E CWV quantitative
analysis by waveform parameters of correlation coeffi-
cient, indices of Karhunen-Loève Transform (KLT), and
indices of tessellated map (TM). ECWV had been proved
efficient because some indices could distinguish between
mental load and non-load states [4]. Yan et al. [5] indi-
cated that the ECG waveforms were more stable in rest
states than in stress states based on KLT indices, and
proved that KLT indices were suitable to distinguish the
states between rest and stress. Triangle characters of
Y. J. LI ET AL.
Copyright © 2013 SciRes. ENG
127
ECG make the ECG morphology analysis very easy and
simple. Song et al. [6] for the first time used barycenters
of QRS triangles to remove baseline wandering. Then,
we found that triangle characters of ECG were also use-
ful in detecting QRS complex [7]. This paper focused on
finding out some ECG waveform indices by triangle
character analysis which was useful in distinguishing
states between exercise and relaxation, and in monitoring
exercise-induced cardiovascular workload.
2. Methods
2.1. Subjects, Assignment and ECG Reco rding
Totally 30 healthy subjects (all males, age 28.9 ± 4.2
years) participated in the investigation. All subjects re-
ported in good health, and none had taken any forms of
drastic activity in the last week. Common exercise mod-
alities used in North America and Australasia are the
treadmill exercise test (TET), and stationary bicycle er-
gometer in Europe [1]. In this paper, stationary bicycle
ergometer was used to put workload on subjects. In order
to let subjects experience physical stress and relaxation, a
work-rest schedule including stationary bicycle exercise
and relaxation was specially designed, which was con-
sisted of three sections: resting, physical workload and
recovering, and they were described in detail as follows:
1) baseline period: rested on bicycle ergometry for about
5 min; 2) workload period: exercised on bicycle ergome-
try for about 20 min; 3) recovery period: rested on bi-
cycle ergometry f or about 5 min.
During workload period, workload of 100 W was im-
posed on each subject by the bicycle ergometry. Each
work cycle should be completed nearly at a constant
speed, in which subjects trampled on the pedal up and
down reduplicatively to ride the stationary bicycle for
about 20 min. One channel ECG was continuously rec-
orded by the non-invasive cardiac function monitor
through the experiment for each subject. The channel
was placed near the V5 precordial position with Ag/AgCl
electrodes in order to yield large R wave signals, which
was very useful for accurately heartbeat segmentation.
ECG signals were sampled with 12 bits A/D converter,
and the sampling f re quency wa s 250 Hz.
2.2. ECG Preprocessing
ECG collected from body surface is always interfered by
noises of different types, especially baseline shifts, post-
ural changes, electrode interference, EMG and power
line interference, etc. Noise suppression at the cost of
minimum distortions to the desired ECG component
plays an important role in ECG pre-processing. In this
paper, wavelet transform were used to remove EMG in-
terference, then baseline wandering from ECG was re-
moved by wavelet transform combined with QRS bary-
center fitting [6].
QRS complex detection usually provides the funda-
mentals to automated ECG analysis. However, detection
of QRS complex is not easy due to abormal shapes, noise,
and artifacts. R waves and T waves should normally be
upright in leads I, II and V3 to V6 [1]. The combination
of matched filtering and triangle character analysis [7]
was applied for QRS complex detection, which was able
to identify QRS complexes reliably even under the con-
dition of poor signal quality [7]. According to the posi-
tion of R wave peak “Rp”, Q wave peak Qpand S
wave peak Spwere located by finding the local minimal
val- ues backward and forward from R peak, in regions
of [Rp 0.1 s, Rp] and [Rp, Rp + 0.1 s], respectively.
T wave end “Tn” was located by the method through
the computation of an indicator related to the area cov-
ered by the T wave curve, which was not only computa-
tionally simple but also very robust to acquisition noise
[8]. Then T wave peak Tpwas automatically detected
by finding the local maximal value in regions of [Rp +
0.1 s, Tn]. However, location of T wave start point is one
of the most difficult problems for ECG waveform boun-
dary location due to the slow transition from ST segment
to T wave start point, or due to the corruption from noise.
Instead of locating the precise position for T wave start
point, a point “Tb” is defined as a rough point of T wave
begin from the left segment of T wave to Tpwhose
time length is the same as the time span between “Tp”
and “Tnby Equatio n (1).
Tb = 2Tp Tn (1 )
2.3. Extraction of ECG Triangle Characters
A triangle is defined by setting the onset point, the peak
point and the offset point of a wave as three apexes of a
triangle. A typical triangle extracted from a signal is
shown in Figure 1, in which the morphology of a wave
is simplified as a triangle ABC [7]. Horizontal distance
between apex A and apex B is defined as TmAB by Equ-
ation (2). Amplitude AmAB between apex A and apex B
in vertical coordinate is gotten by Equation (3).
TmAB = (Bx Ax)/Fs (2)
where Ax and Bx are x-coordinates of point “A” and
point “B” respectively, whose unit are sampling points;
Fs is the ECG sampling frequency whose unit are sam-
pling points per second. As a result, unit of TmAB is
second.
AmAB = By Ay (3)
where Ay and By are y-coordinates of point “A” and
point “B” respectively, whose unit is millivolt. As a re-
sult, unit of AmAB is also millivolt.
The side length of AB in triangle ABC, called SdAB,
Y. J. LI ET AL.
Copyright © 2013 SciRes. ENG
128
Figure 1. A typical triangle ABC extracted from a signal.
depends on the ECG paper speed in horizon and the am-
plitude unit in vertical, i.e. side length depends on the
time resolution and amplitude resolution. The paper for
ECG recording is fully composed of small squares verti-
cally and horizontally with side length as 1 mm. In hori-
zontal orientation, paper moving speed is mostly 25
mm/s (paper speed could be adjust to 50 mm/s, 100 mm/s
or 200 mm/s on demand for higher time resolution),
while the ratio of amplitude to voltage is mostly 10
mm/mV in vertical orientation. For instance, at an ECG
paper speed of 200 mm/s in horizon and amplitude unit
of 10 mm/mV, 1 mm represents 0.005 s for x coordinates
while 0.1 mV for y coordinates. Because of that, scales
of time and amplitude must be transferred to unit of mm.
The side length SdAB is calculated by Equation (4).
() ()
22
//
Tm Am
SdABTmAB FAmAB F= +
(4)
where FTm is a factor of x-coordinates depending on the
paper speed during ECG recording, which could be any
value of {0.04, 0.02, 0.01, 0.005} s/mm; FAm is a factor
of y-coordinates depending on the amplitude resolution,
which is often take n as 0.1 mV/ mm.
The side length of AC and BC in triangle ABC that
called SdAC and SdBC respectively, are obtained with
the same way of defining SdAB. Then the perimeter Pm
and area Ar of triangle ABC are acquired by Equation (5)
and (6), respectively. The high line on side AB that
called LnAB in triangle ABC is gotten by Equation (7).
The Angle A called AgA in triangle ABC is obtained
according to the law of cosines, as shown by Equation
(8).
Pm = (SdAB + SdBC + SdAC)/2 (5)
P(P-SdAB)(P-SdBC)(P-SdAC)Ar =
(6)
where P = Pm/2 .
LnAB = 2Ar/SdAB (7)
222
cos(()/(2 ))AgA arbcabc= +−
(8)
where a, b, and c r epr es ents SdBC, SdAC and SdAB
separately; “arcos” is the mathematical operator of arc
cosine.
If Qp, Rp and Sp were used as apexes of A, B and C,
respectively, then the triangle QRS was constructed, as
shown in Figure 2. In the same way, the triangle T was
forme d bas ed on the fea ture poi nt s of T b , T p a nd T n.
Totally 26 triangular indices were used for distin-
guishing states between exercise and relaxation, includ-
ing 13 indices of triangle QRS and 13 indice s of triangle
T, as shown in Table 1. In Table 1, “Q”, “R”, and “S”
represents Q peak, R peak and S peak in QRS complex,
respectively; “Tb”, “Tp” and “Tn” represents the begin-
ning, the peak and the end point of T wave, respectively.
And R-R interval is defined as TmRR to make a compar-
ison with these triangular indices.
2.4. Comparison between Rest and Workload
States
To make the comparison more clearly among the base-
line period, the workload period and the recovery period,
three short time periods were picked up from them re-
spectively: 2 min from the beginning of baseline period
(P1); 2 min before the peak of exercise period (P2),
where exercise peak was defined at the instant of max-
imal heart rate [9] (see Figure 3); and 2min before the
end of recovery period (P3).
When testing the significant differences for all subjects
between rest and workload states, the difference of vec-
tors were compared with vector zeros”, by which the
comparison between relative difference values and vector
“zeros” took the place of the comparison between indi-
vidual values and some objective criterion [2], which
Figure 2. Triangle QRS based on apexes of Qp, Rp and Sp,
and triangle T based on apexes of Tb, Tp and Tn.
00.02 0.04 0.060.08
-1
-0. 5
0
0.5
1
1.5
2
Time(s)
Ampl i tude(mV)
A (Ax,Ay)
B (Bx,By)
C (Cx ,Cy )
00.4 0.8 1.2 1.62
-1
0
1
2bas el i ne E CG
Time(s)
Ampl i tude(m V )
00.4 0.8 1.2 1.62
-1
0
1
2ex erc i se E CG
Time(s)
Ampl i tude(m V )
00.4 0.8 1.2 1.62
-1
0
1
2rec overy E CG
Time(s)
Ampl i tude(m V )
Qp
Rp
Sp
Tb Tn
Tp T wave triangleT wave
t ri angl e
QRS tri angl e
QRS tri angl e
Qp
Rp
Sp
Tb
Tp
Tn
QRS tri angl e
T wave triangle
QRS tri angl e
T wave triangle
T wave triangle
Qp
Rp
Sp
Tb
Tp
Tn
QRS tri angl e
T wave triangle
QRS tri angl e
T wave triangle
QRS tri angl e
(c)
(a)
(b)
Y. J. LI ET AL.
Copyright © 2013 SciRes. ENG
129
Table 1. Definition of ECG measurements.
(a) Indices of triangle QRS
1 SdRS RS side length in triangle QRS
2 SdQS QS side length in triangle QRS
3 SdQR QR side length in triangle QRS
4 SdQR/SdRS Ratio of SdQR to SdRS
5 AgQ Angle Q in triangle QRS
6 AgR Angle R in triangle QRS
7 AgS Angle S in triangle QRS
8 AgS/AgQ Ratio of AgS to AgQ
9 PmTirQRS Perimeter of triangle QRS
10 ArTirQRS Area of triangle QRS
11 LnRS High line on SdRS of triangle QRS
12 LnQS High line on SdQS of triangle QRS
13 LnQR High line on SdQR of triangle QRS
(b) Indices of triangle T
1 SdTpTn TpTn side length in triangle T
2 SdTbTn TbTn side length in triangle T
3 SdTbTp TbTp side length in triangle T
4 SdTbTp/SdTpTn Ratio of SdTbTp to SdTpTn
5 AgTb Angle Tb in triangle T
6 AgTp Angle Tp in triangle T
7 AgTn Angle Tn in triangle T
8 AgTn/AgTb Ratio of AgTn to AgTb
9 PmTirTw Perimeter of triangle T
10 ArTirTw Area of triangle T
11 LnTpTn High line on SdTpTn in triangle T
12 LnTbTn High line on SdTbTn in triangle T
13 LnTbTp High line on SdTbTp in triangle T
Figure 3. Time periods extraction.
made the influence of the subjects individual difference
weaker and the comparison results more believable.
When testing the significant difference between rest and
workload states for individual subject, vectors during
period P1 and those during period P2 were compared,
and vectors during period P2 and those during period P3
were compared. At last, the percent of the subjects for
which indices had significant difference individually
between rest and workload was statistically analyzed.
3. Results
3.1. Comparison between Rest and Workload
States
After the stages of noise suppression, feature point loca-
tion and ECG characters extraction, the mean value and
standard deviation of all indices from all subjects be-
tween periods of P1 and P2, and that between periods of
P2 and P3 were obtained and shown in Table 2. As a
result, 10 indices except for TmRR had significant dif-
ference (SPSS 17.0 for t test, P < 0.05) not only between
baseline period (P1) and exercise period (P2), but also
between exercise period (P2) and recovery period (P3),
which were: SdQS, SdQR/SdRS, AgQ, AgS, AgS/AgQ,
LnQR, SdTpTn, PmTirTw, ArTirTw, and LnTbTp.
These 10 indices had the potential values as stress level
Table 2. Indices variation between rest and exercise.
No Index P1P2 P2P3
1 TmRR 0.1900 ± 0.0862*** 0.0926 ± 0.0579###
2 SdRS 0.2468 ± 0.6078 0.3793 ± 0.4667##
3 SdQS 0.1052 ± 0.1461** 0.1168 ± 0.1493##
4 SdQR 0.2983 ± 0.5895 0.0689 ± 0.4144
5 SdQR/SdRS 0.1077 ± 0.0672*** 0.0512 ± 0.0507###
6 AgQ 17.8850 ± 10.1098*** 10.2551 ± 8.3149###
7 AgR 2.1481 ± 4.3544 2.6471 ± 4.0557#
8 AgS 15.7458 ± 9.4252*** 7.6169 ± 8.0450###
9 AgS/AgQ 0.2858 ± 0.1821*** 0.1328 ± 0.1203###
10 PmTirQRS 0.0537 ± 1.1188 0.5650 ± 0.8940#
11 ArTirQRS 0.1894 ± 0.4726 0.1297 ± 0.3893
12 LnRS 0.1622 ± 0.1371*** 0.0505 ± 0.1192
13 LnQS 0.4760 ± 0.7386* 0.0873 ± 0.5054
14 LnQR 0.0259 ± 0.0402* 0.0455 ± 0.0828#
15 SdTpTn 0.3772 ± 0.3649*** 0.3302 ± 0.3425###
16 SdTbTn 0.3780 ± 0.4164** 0.1305 ± 0.2617
17 SdTbTp 0.0354 ± 0.2581 0.2292 ± 0.4161#
18 SdTbTp/SdTpTn 0.1161 ± 0.1150*** 0.0325 ± 0.0795
19 AgTb 2.7229 ± 11.2287 4.8310 ± 7.3332#
20 AgTp 2.2021 ± 15.5652 7.5891 ± 12.7279#
21 AgTn 4.9009 ± 6.8621** 2.7896 ± 7.0906
22 AgTn/AgTb 0.1457 ± 0.1601** 0.0404 ± 0.1094
23 PmTirTw 0.7877 ± 0.8161*** 0.6892 ± 0.9005##
24 ArTirTw 0.3991 ± 0.4928** 0.5692 ± 0.7469##
25 LnTpTn 0.0404 ± 0.2991 0.1918 ± 0.3439#
26 LnTbTn 0.0885 ± 0.3046 0.3112 ± 0.4163##
27 LnTbTp 0.3730 ± 0.3644*** 0.2934 ± 0.2686###
Note: ***p < 0.001, **p < 0.01, *p < 0.05, as relative difference values
P1P2 compared with vector zeros; ###p < 0.001, ##p < 0.01, #p < 0.05, as
relative difference values P2P3 compared with vector zeros”.
Y. J. LI ET AL.
Copyright © 2013 SciRes. ENG
130
indices, at least to distinguish states between rest and
workload.
3.2. Selection of ECG Indices to Disting uish
States between Rest and Workload
The percent of individual subject to all subjects whose
indices had significant difference between rest and
workload states is shown in Table 3, which is defined as
the coincidence rate (CR). There were 4 indices whose
coincidence rate were bigger than 85% at significant dif-
ference level (P < 0.05), which contained indices of
SdQR/SdRS, AgQ, AgS and AgS/AgQ in triangle QRS.
Furthermore, the coincidence rate of AgS/AgQ was
100% at significant difference level (P < 0.05).
4. Discussion
Angles of Q, R and S are determined partially by the
ratio between time scale and amplitude scale. So are an-
gles of T wave triangle. Set 1 mm represents 0.1 mV of y
coordinates in ECG paper, and 0.04 s/mm, 0.01 s/mm
and 0.005 s/mm in x coordinates represents ECG paper
speed of 25 mm/s, 100 mm/s and 200 mm/s, respectiv ely.
The morphology of triangle QRS and triangle T are
shown in Figur e 4. The effects of the proportion between
time scale and amplitude scale are shown in Table 4 by
the first heartbeat of Figure 4(a). The higher time resolu-
tion, the smaller AgQ but bigger AgR and AgS in trian-
gle QRS, and the smaller AgTb and AgTb but bigger
AgTp in triangle T of the first heartbeat in Fig ur e 4. P ar-
ticularly, both AgQ and AgTb transformed from obtuse
angles to acute angles, but AgTp transformed form an
acute angle to an obtuse angle in Table 4. The time scale
was chosen as 0.005 s/mm to make the angle R in trian-
gle QRS more clearly, i.e., FTm is 0.005 and FAm is 0.1 in
Equation (4).
Table 3. Indices coincidence rates which had significant
difference between rest and workload.
No Index CR at P < 0.05
(%) CR at P < 0.01
(%) CR at P <
0.001
(%)
1 TmR R 100 100 96.67
2 SdQS 70.00 66.67 63.33
3 SdQR/SdRS 93.33 86.67 86.67
4 AgQ 96.67 96.67 96.67
5 AgS 86.67 86.67 80.00
6 AgS/AgQ 100 96.67 96.67
7 LnQR 66.67 60.00 43.33
8 SdTpTn 83.33 73.33 63.33
9 PmTirTw 70.00 50.00 46.67
10 ArTirTw 66.67 46.67 43.33
11 LnTbTp 76.67 70.00 63.33
Figure 4. Effects of proportion between time scale and am-
plitude scale.
Table 4. Influence of the ratio between time scale and am-
plitude scale for the first heartbeat of Figure 4.
(a) angles in triangle QRS
time scale AgQ AgR AgS sum
0.04 s/mm 154.4930 4.1225 21.3841 179.9996
0.01 s/mm 111.6323 16.3844 51.9829 179.9996
0.005 s/mm 89.6826 32.1239 58.1931 179.9996
(b) angles in triangle T
time scale AgTb AgTp AgTn sum
0.04 s/mm 93.7415 24.3581 61.8999 179.9996
0.01 s/mm 52.3109 81.5751 46.1135 179.9996
0.005 s/mm 31.2402 119.7902 28.9692 179.9996
Note: amplitude scale i s 0.1 mV/mm.
Compared with the predominance of parasympathetic
tone during relaxation period, sympathetic tone predo-
minates during exercise period and increases the cardi-
ovascular workload and increases heart rate. He et al. [10]
found that subjects with a higher HR response to exercise
tend to have smaller abrupt changes in R wave amplitude
(RWA) of lead CM at the interphases between rest and
walking, as the gradual decrease in RWA during walking
may be related to a gradual increase in HR and a gradual
decrease in systemic peripheral resistance, and the gra-
dual increase in RWA after walking may be related to a
gradual decrease in HR and a gradual increase in sys-
temic peripheral resistance. It is likely tha t the process of
ventricular depolarization may not be fully accomplished
because of the limited time of ventricular depolarization
00.5 11.5 22.5 33.5 4
-1
0
1
2paper speed of 25 m m / s
Time (s)
Ampl i tude(m V )
00.1 0.2 0.3 0.4 0.5 0.6 0.7 0.8 0.9 1
-1
0
1
2paper speed of 100 m m / s
Time (s)
Ampl i tude(m V )
00.05 0.1 0.15 0.2 0.25 0.3 0.35 0.4 0.45 0. 5
-1
0
1
2paper speed of 200 m m / s
Time (s)
Ampl i tude(m V )
(b)
(c)
(a)
Q
R
R
S
S
Tb
Tb
Tb
Tp
Tp
Tn
Tn
Tn
S
Tp
Q
Q
R
Y. J. LI ET AL.
Copyright © 2013 SciRes. ENG
131
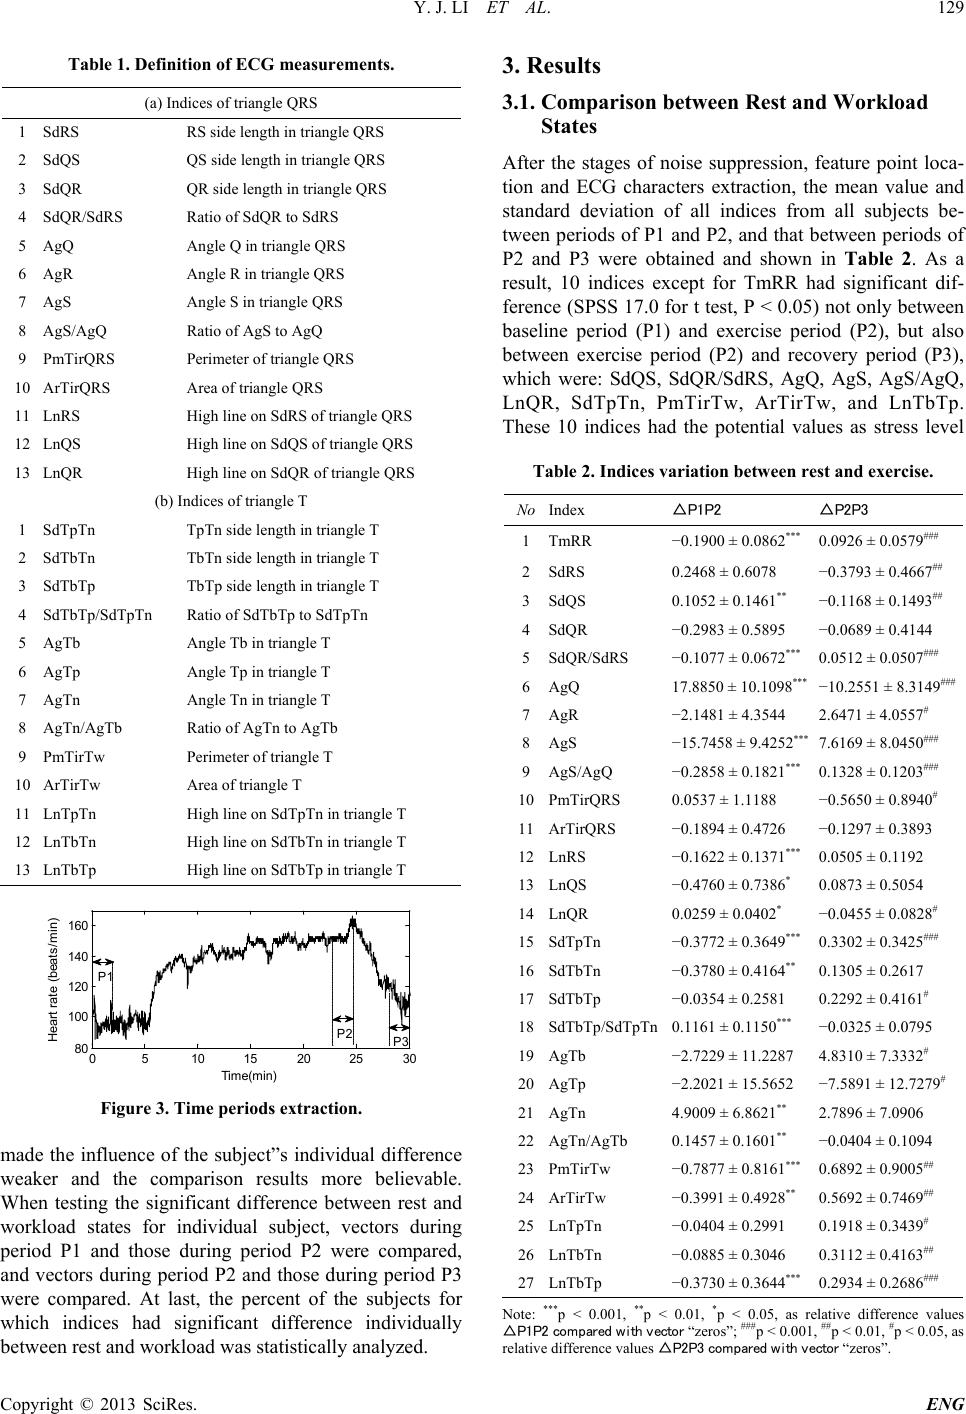
during exercise. The process of ventricular repolarization
may not be fully accomplished too, because of the li-
mited time of ventricular repolarization during exercise.
So T wave may become smaller during exercise than
during rest period. This hypothesis explained the reason
why all side lengths, high lines, areas and perimeters in
triangle T became smaller during workload than rest state.
During recovery period after exercise, vagal reactivation
resulted in increased parasympathetic tone and a declined
in heart rate [1], which induced R-R interval increased
and size of T wave increased when comparing with the
exercise period in Ta bl e 2.
In this paper, the capability of the indices extracted
from triangle QRS and triangle T was tested for distin-
guishing states between exercise and relaxation, and 4
characters from triangle QRS had significant differences
(t test, p < 0.05) for distinguishing between exercise state
and relaxation state for over 85% of subjects, which were:
the ratio of QR side length to RS side length in triangle
QRS, the angle S and the angle Q as well as the ratio
between them. Moreover, the ratio of angle S to angle Q
had significant differences (t test, p < 0.05) for all sub-
jects. ECG morphological indices performed very well at
finding out the ECG changes that induced by exercise.
Thus, they may aid in the noninvasive evaluation of
physical stress levels. As a result, it is concluded that
ECG waveform contains plenty of information in distin-
guishing states between exercise and relaxation.
5. Acknowledgements
This work was supported in part by Advanced Space
Medico-Engineering Research Project of China (SJ-
201006, 2011SY5407019, 2012SY54B0601) and State
Key Laboratory of Space Medicine Fundamentals and
Application, China Astronaut Research and Training
Center (SMFA12B09).
REFERENCES
[1] J. P. Higgins and J. A. Higgins, “Electrocardiographic
Exercise Stress Testing: An Update beyond the ST Seg-
ment,” International Journal of Cardiology, Vol . 116,
2007, pp. 285-299.
http://dx.doi.org/10.1016/j.ijcard.2006.04.047
[2] Y. J. Li, H. Yan, W. Chen, L. Zhang and B. Zhang, “Dif-
ferent Characteristics of Heart Rate Variability in Mental
and Physical Fatigue States,” Space Medicine & Medical
Engineering, Vol. 23, No. 3, 2010, pp. 157-162.
[3] A. Svensbergh, M. Johansson, O. Pahlm and L. H. Brudin,
“ST-Recovery Loop of Exercise-induced ST Deviation in
the Identification of Coronary Artery Disease: Which Pa-
rameters Should We Measure?” Journal of Electrocardi-
ology, Vol. 37, No. 4, 2004, pp. 275-283.
http://dx.doi.org/10.1016/j.jelectrocard.2004.07.012
[4] Y. J. Li, H. Yan and Z. L.Wang, “Study of Electrocardio-
Waveform Variability,” Science in China, Series C: Life
Sciences, Vol. 39, No. 12, 2009, pp. 1181-1187.
[5] H. Yan and Y. J. Li, “Electrocardiogram Analysis Based
on the Karhunen-Loève Transform,” In: W. C. Yu, M.
Zhang, L. P. Wang and Y. B. Song, Eds., 2010 3rd In-
ternational Conference on BioMedical Engineering and
Informatics (BMEI2010), Institute of Electrical and Elec-
tronics Engineers, Yantai, 2010, pp. 887-890.
[6] J. Z. Song, H. Yan, Y. J. Li and K. Y. Mu, “Research on
Electrocardiogram Baseline Wandering Correction Based
on Wavelet Transform, QRS Barycenter Fitting, and Re-
gional Method,” Australasian Physical & Engineering
Science in Medicine, Vol. 33, No. 3, 2010, pp. 279-283.
http://dx.doi.org/10.1007/s13246-010-0033-5
[7] Y. J. Li, H. Yan, F. Hong and J. Z. Song, “A New Ap-
proach of QRS Complex Detection Based on Matched
Filtering and Triangle Character Analysis,Australasian
Physical & Engineering Science in Medicine, Vol. 35, No.
3, 2012, pp. 341-356.
http://dx.doi.org/10.1007/s13246-012-0149-x
[8] Q. H. Zhang, A. I. Manriquez, C. Médigue, Y. Papelier
and M. Sorine, “An Algorithm for Robust and Efficient
Location of T-Wave Ends in Electrocardiograms,” IEEE
Transactions on Biomedical Engineering, Vol. 53, No. 12,
2006, pp. 2544-2552.
http://dx.doi.org/10.1109/TBME.2006.884644
[9] J. Mateo, P. Serrano and R. Bailon, “ECG-Based Clinical
Indexes during Exercise Test Including Repolarization,
Depolarization and HRV,” Computers in Cardiology, Vol.
28, 2001, pp. 30 9-312.
[10] J. F. He, Y. Kinouchi, H. Yamaguchi and H. Miyamoto,
“Exercise-Induced Changes in R Wave Amplitude and
Heart Rate in Normal Subjects,” Journal of Electrocardi-
ology, Vol. 28, No. 2, 1995, pp. 99-106.
http://dx.doi.org/10.1016/S0022-0736(05)80280-8