Paper Menu >>
Journal Menu >>
 Energy and Power Engineering, 2013, 5, 566-569 doi:10.4236/epe.2013.54B108 Published Online July 2013 (http://www.scirp.org/journal/epe) The Condenser Performance Test and Thermal Performance Analysis of Variable Conditions in TQNPC Qingsen Zhao1, Debing Deng1, Yong Liu1, Wei Chen1, Jiayong Wang1, Jun Xiang2, Song Hu2 1The Mal Power Technology Center, Suzhou Nuclear Power Research Institute, Suzhou, China 2State Key Laboratory of Coal Combustion, Huazhong University of Science and Technology, Wuhan, China Email: zhaoqingsen@cgnpc.com.cn, xiangjun@mail.hust.edu.cn Received March, 2013 ABSTRACT Condenser is one of the important auxiliary equipments in nuclear power plants. The thermal efficiency of the entire unit was depended on the condenser performance. Cleanliness factor and condenser corrected pressure are the two most important evaluation indexes. The definition and derivation of these two evaluation indexes were elaborated and clari- fied in this paper. And the condenser performance at variable con ditions was analyzed. The seawater temperature, pipe plugging rate and seawater volume rate effect on unit output was calculated. The calculation method was simple, which can provide reference guidance for similar power plant. Keywords: Condenser; Performance Test; Variable Condition; TQNPC 1. Introduction Condenser is one of the important auxiliary equipments in nuclear power plants. The thermal efficiency of the entire unit was mostly depended on the condenser per- formance. The main factors affect the operation of the condenser performance in the following areas, through the analysis and comparison of the condenser performance impact factors. For example: cooling water inlet temperature, cooling water flow rate, condenser thermal load, cooling tubes fouling, the amount of air leaking into the con- denser, condenser cooling area. The cooling water inlet temperature and the condenser heat transfer area were depended entirely on the natural conditions and design value. In general, condenser cooling area had sufficient margin. The cooling water flow rate could meet the need of the heat transfer in VWO condition, unless the circu- lating pump and circulating water system failure. For the operating condenser, the condenser thermal load, the cooling tubes fouling and the amount of air leaking into the condenser were the key factors to influence perform- ance of condenser. Cleanliness factor and condenser corrected pressure are the two most important evaluation indexes. But the definitions and calculation methods had some different meaning, in this paper, the performance test data of TQNPC was used to evaluate the condenser performance, and to elaborate and clear these two definitions. 2. The Formulas The thermal balance equation of condenser was: 21 (-) ln(1/) p ww pm QWcttWct KAt KAt t (1) and 2ww tt t 1 (2) w2 w1 msw1 sw2 ln tt ttt tt (3) 2 s w tt t (4) The condenser overall heat transfer coefficient K was important parameter to description condenser perform- ance, which combined a variety of factors effected con- denser performance. In this paper, the international Heat Transfer Society (HEI) formula was used, as follows 01 H EIctm KK (5) 3. Condenser Cleanliness Coefficients The condenser cleanliness coefficients was one of the parameters to characterize the tube dirt degree, which indicated that the ratio of heat transfer coefficient about the old and the new tubes at the same flow rates and steam temperature. The condenser cleanliness coefficient was the average of all the cooling pipe cleanliness coef- ficients [1]. Assuming the same operating conditions, the heat transfer coefficient of the new cooling pipes was Kc, the Copyright © 2013 SciRes. EPE 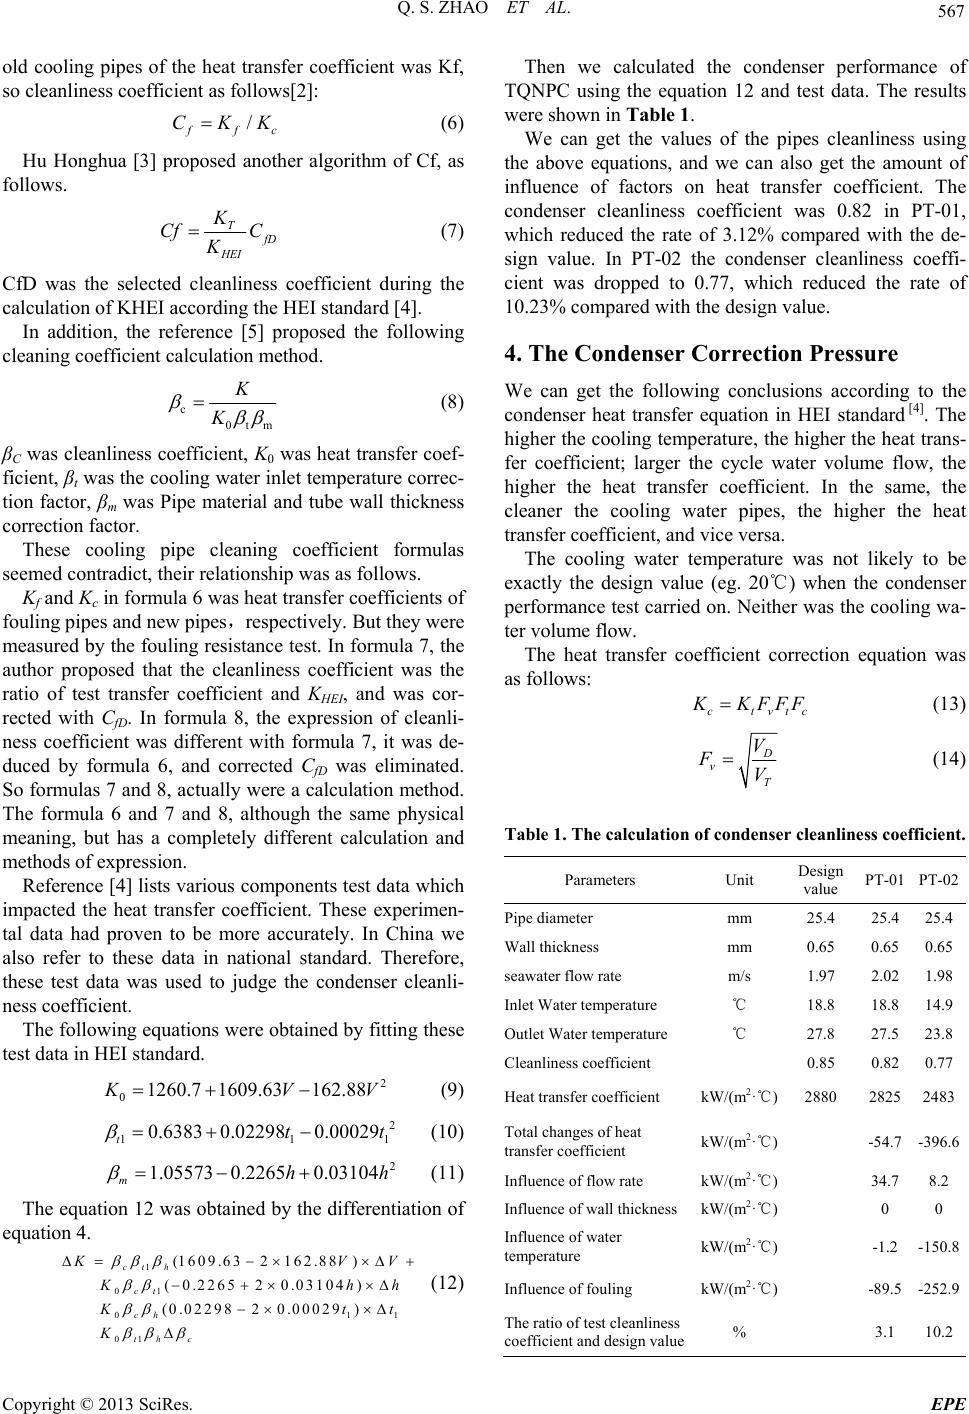 Q. S. ZHAO ET AL. 567 old cooling pipes of the heat transfer coefficient was Kf, so cleanliness coefficient as follows[2]: / f f CKKc (6) Hu Honghua [3] proposed another algorithm of Cf, as follows. T f D HEI K Cf C K (7) CfD was the selected cleanliness coefficient during the calculation of KHEI according the HEI standard [4]. In addition, the reference [5] proposed the following cleaning coefficient calculation method. c0tm K K (8) βC was cleanliness coefficient, K0 was heat transfer coef- ficient, βt was the cooling water inlet temperature correc- tion factor, βm was Pipe material and tube wall thickness correction factor. These cooling pipe cleaning coefficient formulas seemed contradict, their relationship was as follows. Kf and Kc in formula 6 was heat transfer coefficients of fouling pipes and new pipes,respectively. But they were measured by the fouling resistance test. In formula 7, the author proposed that the cleanliness coefficient was the ratio of test transfer coefficient and KHEI, and was cor- rected with CfD. In formula 8, the expression of cleanli- ness coefficient was different with formula 7, it was de- duced by formula 6, and corrected CfD was eliminated. So formulas 7 and 8, actually were a calculation method. The formula 6 and 7 and 8, although the same physical meaning, but has a completely different calculation and methods of expression. Reference [4] lists various components test data which impacted the heat transfer coefficient. These experimen- tal data had proven to be more accurately. In China we also refer to these data in national standard. Therefore, these test data was used to judge the condenser cleanli- ness coefficient. The following equations were obtained by fitting these test data in HEI standard. 2 01260.7 1609.63162.88 K V V 1 t h 1 1 (9) 2 11 0.6383 0.022980.00029 tt (10) 2 1.05573 0.22650.03104 mh (11) The equation 12 was obtained by the differentiation of equation 4. 1 01 0 01 (1609.632 162.88 ) ( 0.226520.03104 ) (0.0229820.00029 ) ct h ct ch th c K VV K hh K tt K (12) Then we calculated the condenser performance of TQNPC using the equation 12 and test data. The results were shown in Table 1. We can get the values of the pipes cleanliness using the above equations, and we can also get the amount of influence of factors on heat transfer coefficient. The condenser cleanliness coefficient was 0.82 in PT-01, which reduced the rate of 3.12% compared with the de- sign value. In PT-02 the condenser cleanliness coeffi- cient was dropped to 0.77, which reduced the rate of 10.23% compared with the design value. 4. The Condenser Correction Pressure We can get the following conclusions according to the condenser heat transfer equation in HEI standard [4]. The higher the cooling temperature, the higher the heat trans- fer coefficient; larger the cycle water volume flow, the higher the heat transfer coefficient. In the same, the cleaner the cooling water pipes, the higher the heat transfer coefficient, and vice versa. The cooling water temperature was not likely to be exactly the design value (eg. 20℃) when the condenser performance test carried on. Neither was the cooling wa- ter volume flow. The heat transfer coefficient correction equation was as follows: ctvtc K KFFF (13) D v T V FV (14) Table 1. The calculation of condenser cleanliness coefficient. Parameters Unit Design value PT-01 PT-02 Pipe diameter mm 25.4 25.425.4 Wall thickness mm 0.65 0.650.65 seawater flow rate m/s 1.97 2.021.98 Inlet Water temperature ℃ 18.8 18.814.9 Outlet Water temperature ℃ 27.8 27.523.8 Cleanliness coeffici e n t 0.85 0.820.77 Heat transfer coefficient kW/(m2·℃) 2880 28252483 Total changes of heat transfer coefficient kW/(m2·℃) -54.7-396.6 Influence of flow rate kW/(m2·℃) 34.78.2 Influence of wall thickness kW/(m2·℃) 0 0 Influence of water temperature kW/(m2·℃) -1.2-150.8 Influence of fouling kW/(m2·℃) -89.5-252.9 The ratio of test cleanliness coefficient and design value% 3.1 10.2 Copyright © 2013 SciRes. EPE 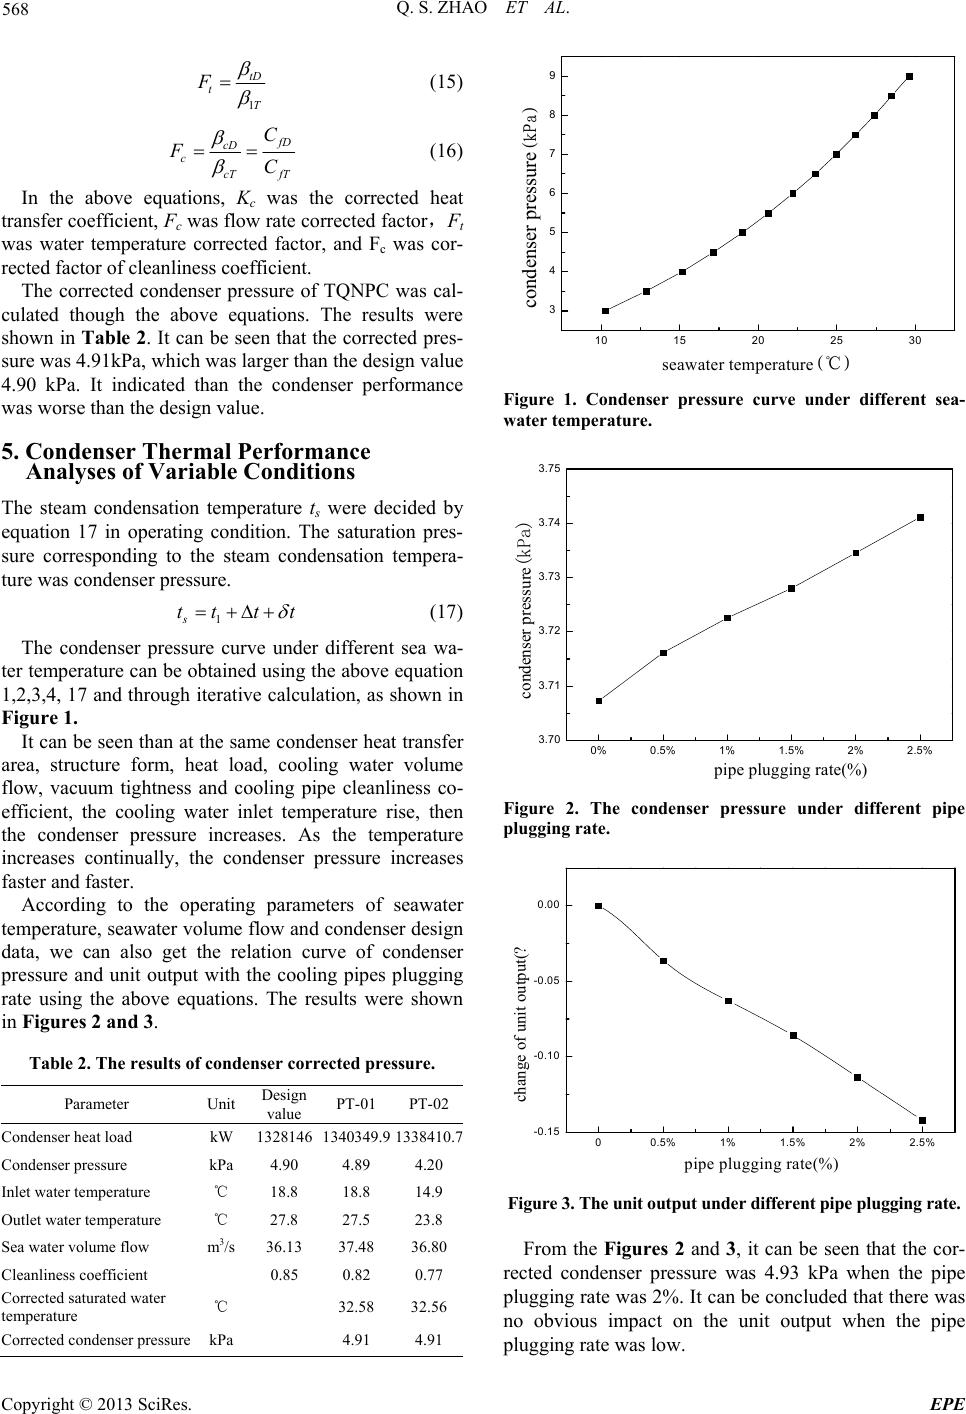 Q. S. ZHAO ET AL. 568 1 tD t T F (15) f D cD c cT fT C FC (16) In the above equations, Kc was the corrected heat transfer coefficient, Fc was flow rate corrected factor,Ft was water temperature corrected factor, and Fc was cor- rected factor of cleanliness coefficient. The corrected condenser pressure of TQNPC was cal- culated though the above equations. The results were shown in Table 2. It can be seen that the corrected pres- sure was 4.91kPa, which was larger than the design value 4.90 kPa. It indicated than the condenser performance was worse than the design value. 5. Condenser Thermal Performance Analyses of Variable Conditions The steam condensation temperature ts were decided by equation 17 in operating condition. The saturation pres- sure corresponding to the steam condensation tempera- ture was condenser pressure. 1s tttt (17) The condenser pressure curve under different sea wa- ter temperature can be obtained using the above equation 1,2,3,4, 17 and through iterative calculation, as shown in Figure 1. It can be seen than at the same condenser heat transfer area, structure form, heat load, cooling water volume flow, vacuum tightness and cooling pipe cleanliness co- efficient, the cooling water inlet temperature rise, then the condenser pressure increases. As the temperature increases continually, the condenser pressure increases faster and faster. According to the operating parameters of seawater temperature, seawater volume flow and condenser design data, we can also get the relation curve of condenser pressure and unit output with the cooling pipes plugging rate using the above equations. The results were shown in Figures 2 and 3. Table 2. The results of condenser corrected pressure. Parameter Unit Design value PT-01 PT-02 Condenser heat load kW 1328146 1340349.91338410.7 Condenser pressure kPa 4.90 4.89 4.20 Inlet water temperature ℃ 18.8 18.8 14.9 Outlet water temperature ℃ 27.8 27.5 23.8 Sea water volume flow m3/s 36.13 37.48 36.80 Cleanliness coefficien t 0.85 0.82 0.77 Corrected saturated water temperature ℃ 32.58 32.56 Corrected condenser pressure kPa 4.91 4.91 10 15 20 25 30 3 4 5 6 7 8 9 condenser pressure(kPa) seawater temperature(℃) Figure 1. Condenser pressure curve under different sea- water temperature. 0% 0.5% 1% 1.5% 2% 2.5% 3.70 3.71 3.72 3.73 3.74 3.75 condenser pressure(kPa) pipe plugging rate(%) Figure 2. The condenser pressure under different pipe plugging rate. 0 0.5%1%1.5%2%2.5% -0.15 -0.10 -0.05 0.00 change of unit output(? pipe plugging rate(%) Figure 3. The unit output under different pipe plugging rate. From the Figures 2 and 3, it can be seen that the cor- rected condenser pressure was 4.93 kPa when the pipe plugging rate was 2%. It can be concluded that there was no obvious impact on the unit output when the pipe plugging rate was low. Copyright © 2013 SciRes. EPE 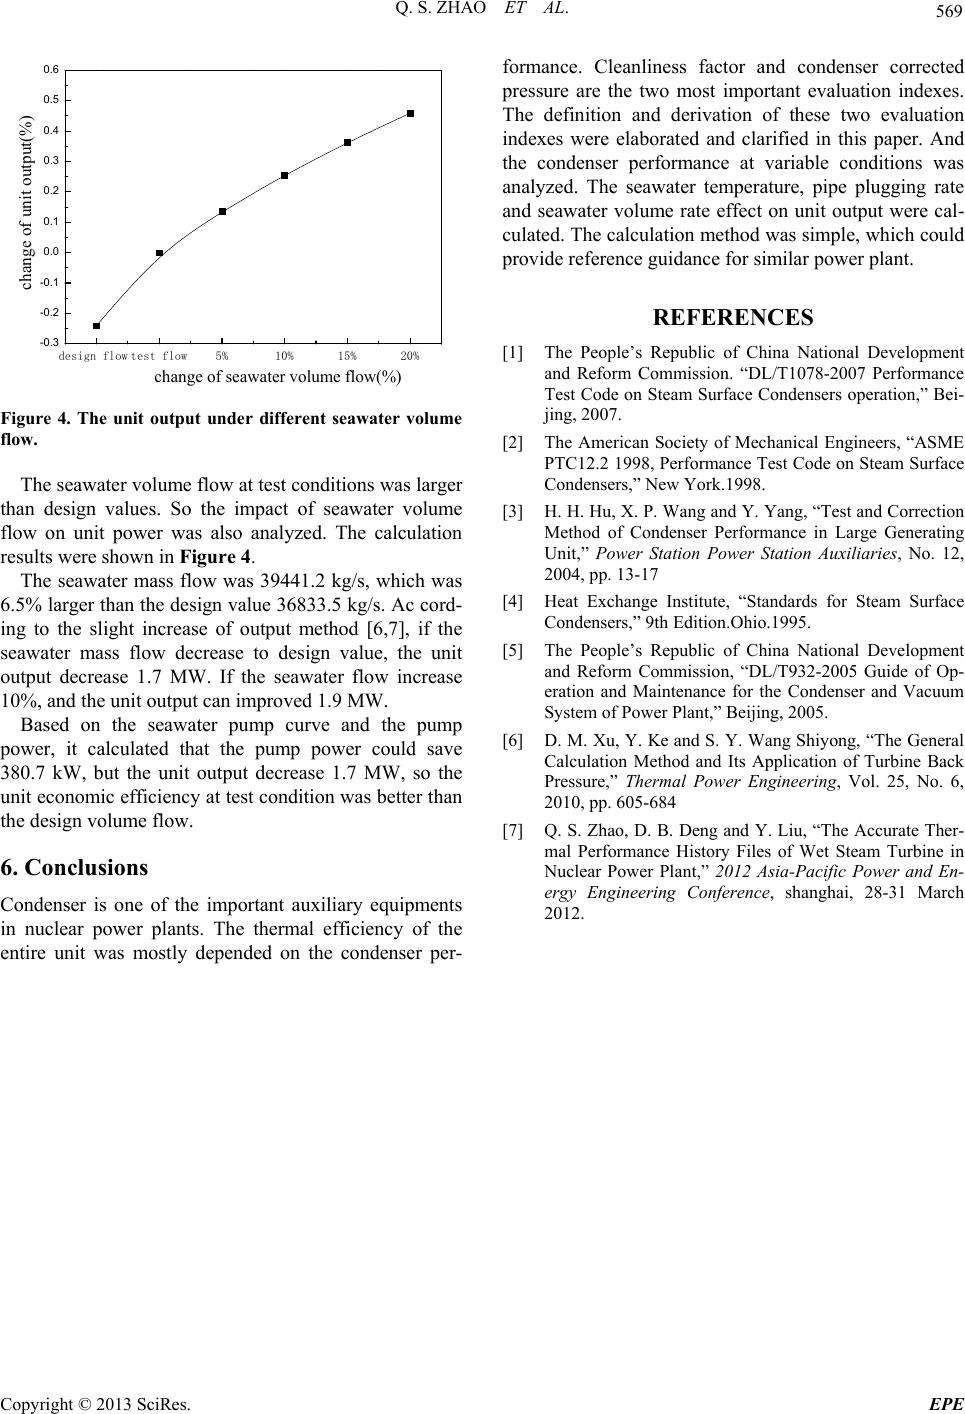 Q. S. ZHAO ET AL. Copyright © 2013 SciRes. EPE 569 design flow test flow5%10%15%20% -0.3 -0.2 -0.1 0.0 0.1 0.2 0.3 0.4 0.5 0.6 change of unit output(%) change of seawater volume flow(%) Figure 4. The unit output under different seawater volume flow. The seawater volume flow at test conditions was larger than design values. So the impact of seawater volume flow on unit power was also analyzed. The calculation results were shown in Figure 4. The seawater mass flow was 39441.2 kg/s, which was 6.5% larger than the design value 36833.5 kg /s. Ac cord- ing to the slight increase of output method [6,7], if the seawater mass flow decrease to design value, the unit output decrease 1.7 MW. If the seawater flow increase 10%, and the unit output can improved 1.9 MW. Based on the seawater pump curve and the pump power, it calculated that the pump power could save 380.7 kW, but the unit output decrease 1.7 MW, so the unit economic efficiency at test condition was better than the design volume flow. 6. Conclusions Condenser is one of the important auxiliary equipments in nuclear power plants. The thermal efficiency of the entire unit was mostly depended on the condenser per- formance. Cleanliness factor and condenser corrected pressure are the two most important evaluation indexes. The definition and derivation of these two evaluation indexes were elaborated and clarified in this paper. And the condenser performance at variable conditions was analyzed. The seawater temperature, pipe plugging rate and seawater volume rate effect on unit output were cal- culated. The calculation method was simple, which could provide reference guidance for similar power plant. REFERENCES [1] The People’s Republic of China National Development and Reform Commission. “DL/T1078-2007 Performance Test Code on Steam Surface Condensers operation,” Bei- jing, 2007. [2] The American Society of Mechanical Engineers, “ASME PTC12.2 1998, Performance Test Code on Steam Surface Condensers,” New York.1998. [3] H. H. Hu, X. P. Wang and Y. Yang, “Test and Correction Method of Condenser Performance in Large Generating Unit,” Power Station Power Station Auxiliaries, No. 12, 2004, pp. 13-17 [4] Heat Exchange Institute, “Standards for Steam Surface Condensers,” 9th Edition.Ohio.1995. [5] The People’s Republic of China National Development and Reform Commission, “DL/T932-2005 Guide of Op- eration and Maintenance for the Condenser and Vacuum System of Power Plant,” Beijing, 2005. [6] D. M. Xu, Y. Ke and S. Y. Wang Shiyong, “The General Calculation Method and Its Application of Turbine Back Pressure,” Thermal Power Engineering, Vol. 25, No. 6, 2010, pp. 605-684 [7] Q. S. Zhao, D. B. Deng and Y. Liu, “The Accurate Ther- mal Performance History Files of Wet Steam Turbine in Nuclear Power Plant,” 2012 Asia-Pacific Power and En- ergy Engineering Conference, shanghai, 28-31 March 2012. |