X. FEI
562
region of interest; denotes the scaling parameter or
scale, and measures the degree of compression. In the
frequency domain, this function is expressed as
a
*
(,)( ),
2
aj
x
WT axae d
(2)
where ()x
is the Fourier transform of ()
t; ()
is the Fourier transform of ()t
.
Selecting an appropriate wavelet converts ()t
in the
time domain into a finite support and turns ()
in the
frequency domain into a relatively concentrated variable.
Implementing wavelet transform in the time and fre-
quency domains also characterizes local signal features.
The energy distribution of various power disturbance
signals differs at various frequency bands. Thus, we can
incorporate different energy distributions in different
frequency bands as bases for distinguishing power dis-
turbances.
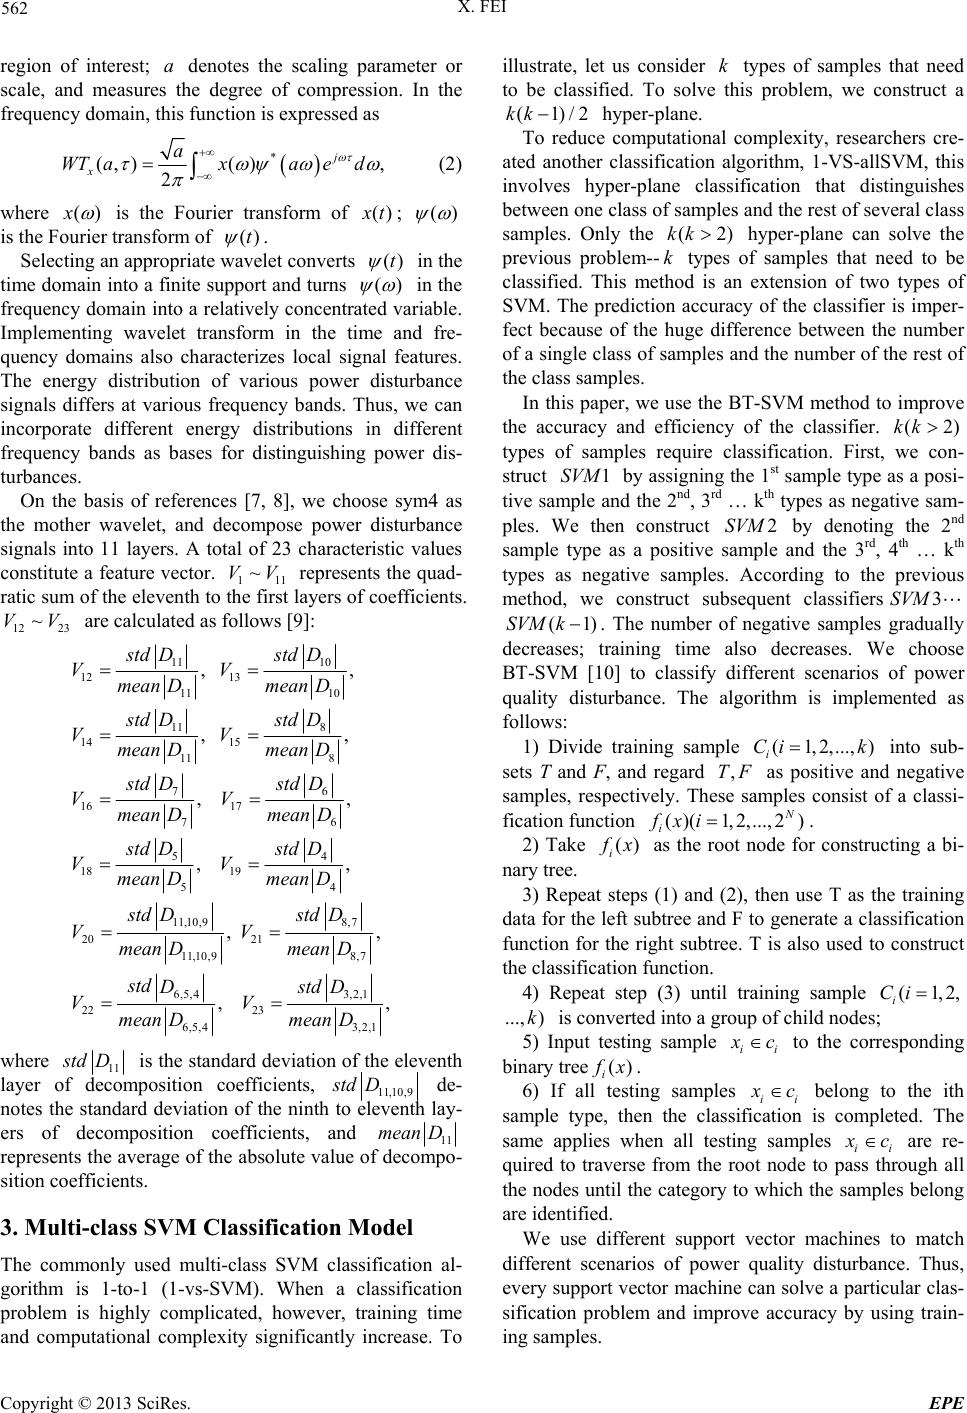
On the basis of references [7, 8], we choose sym4 as
the mother wavelet, and decompose power disturbance
signals into 11 layers. A total of 23 characteristic values
constitute a feature vector. 111
represents the quad-
ratic sum of the eleventh to the first layers of coefficients.
are calculated as follows [9]:
~VV
12 23
~VV
10
12 13
11 10
8
14 15
11 8
76
16 17
76
4
18 19
54
,10,9 8,7
20 21
11,10,9 8,7
22
, ,
, ,
, ,
, ,
, ,
std D
std
VV
meamean D
std D
std
VV
meamean D
stdstd D
VV
meamean D
std std D
VV
meanmean D
stdstd D
VV
meamean D
std
V
11
11
5
11
D
n D
D
n D
D
n D
D
D
D
n D
6,
n D
5,4 3,2,1
23
6,5,4 3,2,1
, ,
DstdD
V
meamean D
where 11
td D is the standard deviation of the eleventh
layer of decomposition coefficients, 11,10,9
std D de-
notes the standard deviation of the ninth to eleventh lay-
ers of decomposition coefficients, and 11
mean D
represents the average of the absolute value of decompo-
sition coefficients.
3. Multi-class SVM Classification Model
The commonly used multi-class SVM classification al-
gorithm is 1-to-1 (1-vs-SVM). When a classification
problem is highly complicated, however, training time
and computational complexity significantly increase. To
illustrate, let us consider types of samples that need
to be classified. To solve this problem, we construct a
k
(1)/2kk
hyper-plane.
To reduce computational complexity, researchers cre-
ated another classification algorithm, 1-VS-allSVM, this
involves hyper-plane classification that distinguishes
between one class of samples and the rest of several class
samples. Only the hyper-plane can solve the
previous problem-- types of samples that need to be
classified. This method is an extension of two types of
SVM. The prediction accuracy of the classifier is imper-
fect because of the huge difference between the number
of a single class of samples and the number of the rest of
the class samples.
(2kk
k)
)
In this paper, we use the BT-SVM method to improve
the accuracy and efficiency of the classifier.
types of samples require classification. First, we con-
struct by assigning the 1st sample type as a posi-
tive sample and the 2nd, 3rd … k th types as negative sam-
ples. We then construct by denoting the 2nd
sample type as a positive sample and the 3rd, 4th … kth
types as negative samples. According to the previous
method, we construct subsequent classifiers
(2kk
3SVM
1SVM
(1)k
2SVM
SVM
. The number of negative samples gradually
decreases; training time also decreases. We choose
BT-SVM [10] to classify different scenarios of power
quality disturbance. The algorithm is implemented as
follows:
1) Divide training sample into sub-
sets T and F, and regard as positive and negative
samples, respectively. These samples consist of a classi-
fication fu nct ion
(1,2,...,)
i
Ci k
F
,...,2 )
,T
1,2( )(
i
2) Take fxi
).
(
i
x as the root node for constructing a bi-
nary tree.
3) Repeat steps (1) and (2), then use T as the training
data for the left subtree and F to generate a classification
function for the right subtree. T is also used to construct
the classification function.
4) Repeat step (3) until training sample (1,2,
i
Ci
is converted into a group of child nodes; ..., )k
5) Input testing sample ii
c to the corresponding
binary tree()
i
x.
6) If all testing samples ii
c belong to the ith
sample type, then the classification is completed. The
same applies when all testing samples ii
c are re-
quired to traverse from the root node to pass through all
the nodes until the category to which the samples belong
are identified.
We use different support vector machines to match
different scenarios of power quality disturbance. Thus,
every support v ector machine can solve a particular clas-
sification problem and improve accuracy by using train-
ing samples.
Copyright © 2013 SciRes. EPE