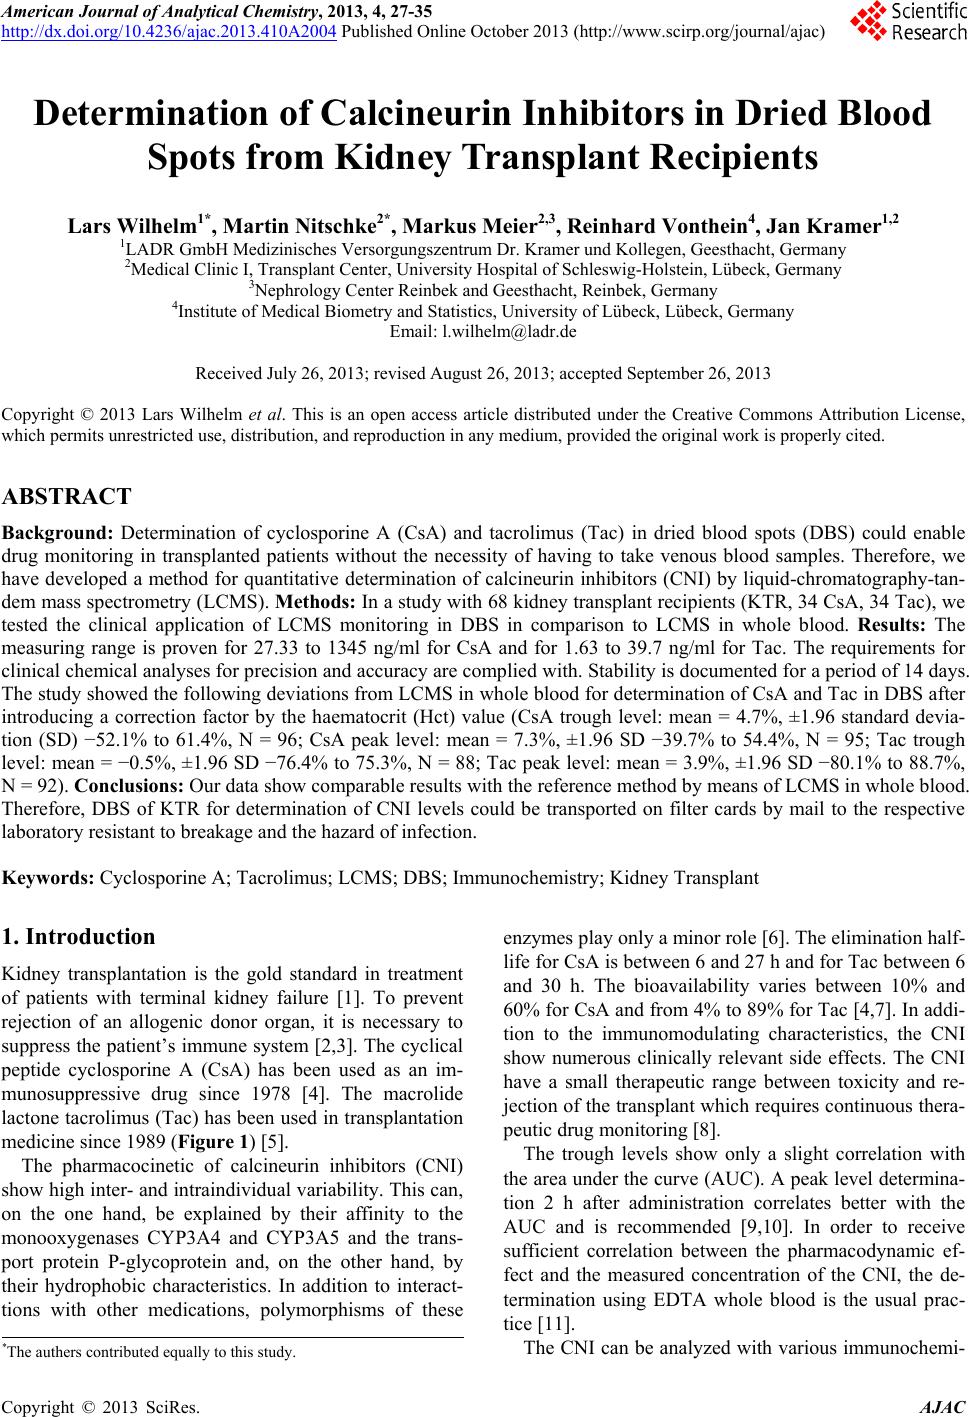
 American Journal of Analytical Chemistry, 2013, 4, 27-35 http://dx.doi.org/10.4236/ajac.2013.410A2004 Published Online October 2013 (http://www.scirp.org/journal/ajac) Determination of Calcineurin Inhibitors in Dried Blood Spots from Kidney Transplant Recipients Lars Wilhelm1*, Martin Nitschke2*, Markus Meier2,3, Reinhard Vonthein4, Jan Kramer1,2 1LADR GmbH Medizinisches Versorgungszentrum Dr. Kramer und Kollegen, Geesthacht, Germany 2Medical Clinic I, Transplant Center, University Hospital of Schleswig-Holstein, Lübeck, Germany 3Nephrology Center Reinbek and Geesthacht, Reinbek, Germany 4Institute of Medical Biometry and Statistics, University of Lübeck, Lübeck, Germany Email: l.wilhelm@ladr.de Received July 26, 2013; revised August 26, 2013; accepted September 26, 2013 Copyright © 2013 Lars Wilhelm et al. This is an open access article distributed under the Creative Commons Attribution License, which permits unrestricted use, distribution, and reproduction in any medium, provided the original work is properly cited. ABSTRACT Background: Determination of cyclosporine A (CsA) and tacrolimus (Tac) in dried blood spots (DBS) could enable drug monitoring in transplanted patients without the necessity of having to take venous blood samples. Therefore, we have developed a method for quantitative determination of calcineurin inhibitors (CNI) by liquid-chromatography-tan- dem mass spectrometry (LCMS). Methods: In a study with 68 kidney transplant recipients (KTR, 34 CsA, 34 Tac), we tested the clinical application of LCMS monitoring in DBS in comparison to LCMS in whole blood. Results: The measuring range is proven for 27.33 to 1345 ng/ml for CsA and for 1.63 to 39.7 ng/ml for Tac. The requirements for clinical chemical analyses for precision and accuracy are complied with. Stability is documented for a period of 14 days. The study showed the following deviations from LCMS in whole blood for determination of CsA and Tac in DBS after introducing a correction factor by the haematocrit (Hct) value (CsA trough level: mean = 4.7%, ±1.96 standard devia- tion (SD) −52.1% to 61.4%, N = 96; CsA peak level: mean = 7.3%, ±1.96 SD −39.7% to 54.4%, N = 95; Tac trough level: mean = −0.5%, ±1.96 SD −76.4% to 75.3%, N = 88; Tac peak level: mean = 3.9%, ±1.96 SD −80.1% to 88.7%, N = 92). Conclusions: Our data show comparable results with the reference method by means of LCMS in whole blood. Therefore, DBS of KTR for determination of CNI levels could be transported on filter cards by mail to the respective laboratory resistant to breakage and the hazard of infection. Keywords: Cyclosporine A; Tacrolimus; LCMS; DBS; Immunochemistry; Kidney Transplant 1. Introduction Kidney transplantation is the gold standard in treatment of patients with terminal kidney failure [1]. To prevent rejection of an allogenic donor organ, it is necessary to suppress the patient’s immune system [2,3]. The cyclical peptide cyclosporine A (CsA) has been used as an im- munosuppressive drug since 1978 [4]. The macrolide lactone tacrolimus (Tac) has been used in transplantation medicine since 1989 (Figure 1) [5]. The pharmacocinetic of calcineurin inhibitors (CNI) show high inter- and intraindividual variability. This can, on the one hand, be explained by their affinity to the monooxygenases CYP3A4 and CYP3A5 and the trans- port protein P-glycoprotein and, on the other hand, by their hydrophobic characteristics. In addition to interact- tions with other medications, polymorphisms of these enzymes play only a minor role [6]. The elimination half- life for CsA is between 6 and 27 h and for Tac between 6 and 30 h. The bioavailability varies between 10% and 60% for CsA and from 4% to 89% for Tac [4,7]. In addi- tion to the immunomodulating characteristics, the CNI show numerous clinically relevant side effects. The CNI have a small therapeutic range between toxicity and re- jection of the transplant which requires continuous thera- peutic drug monitoring [8]. The trough levels show only a slight correlation with the area under the curve (AUC). A peak level determina- tion 2 h after administration correlates better with the AUC and is recommended [9,10]. In order to receive sufficient correlation between the pharmacodynamic ef- fect and the measured concentration of the CNI, the de- termination using EDTA whole blood is the usual prac- tice [11]. The CNI can be analyzed with various immunochemi- *The authers contributed equally to this study. C opyright © 2013 SciRes. AJAC 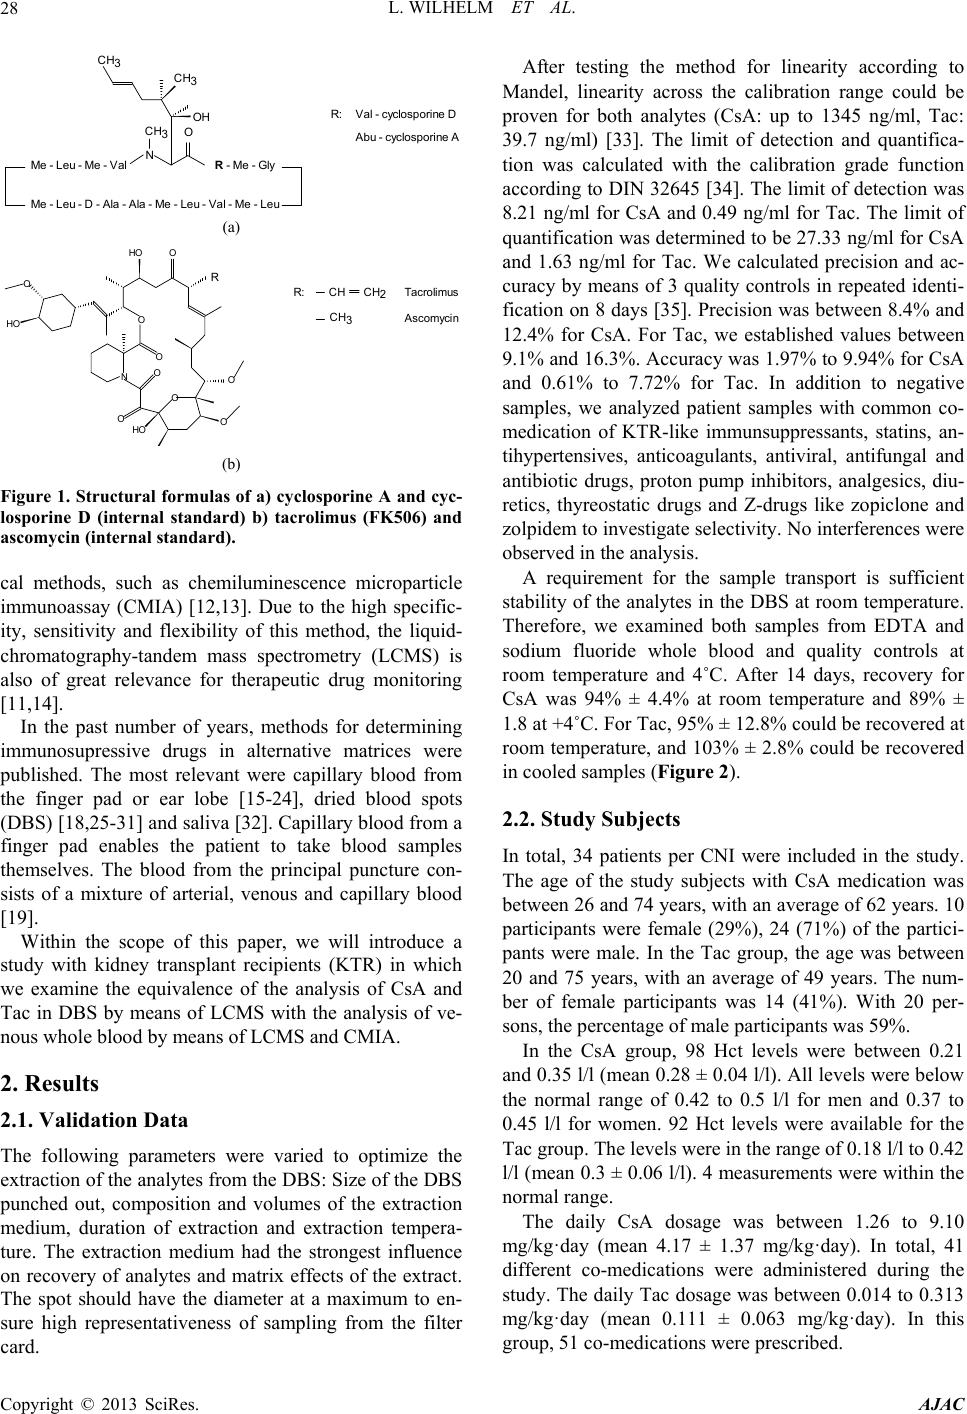 L. WILHELM ET AL. 28 N CH3O C 3 OH CH3 Me - Leu - Me - Val Me - Leu - D - la - la - Me - Leu - Val - Me- Leu R - Me - Gly R:Val - cyclosporine D Abu - cyclosporin e A (a) HO O HO O O O O O O HO N O O R CH CH3 CH2 R: Ascomycin Ta cr olimus (b) Figure 1. Structural formulas of a) cyclosporine A and cyc- losporine D (internal standard) b) tacrolimus (FK506) and ascomycin (internal standard). cal methods, such as chemiluminescence microparticle immunoassay (CMIA) [12,13]. Due to the high specific- ity, sensitivity and flexibility of this method, the liquid- chromatography-tandem mass spectrometry (LCMS) is also of great relevance for therapeutic drug monitoring [11,14]. In the past number of years, methods for determining immunosupressive drugs in alternative matrices were published. The most relevant were capillary blood from the finger pad or ear lobe [15-24], dried blood spots (DBS) [18,25-31] and saliva [32]. Capillary blood from a finger pad enables the patient to take blood samples themselves. The blood from the principal puncture con- sists of a mixture of arterial, venous and capillary blood [19]. Within the scope of this paper, we will introduce a study with kidney transplant recipients (KTR) in which we examine the equivalence of the analysis of CsA and Tac in DBS by means of LCMS with the analysis of ve- nous whole blood by means of LCMS and CMIA. 2. Results 2.1. Validation Data The following parameters were varied to optimize the extraction of the analytes from the DBS: Size of the DBS punched out, composition and volumes of the extraction medium, duration of extraction and extraction tempera- ture. The extraction medium had the strongest influence on recovery of analytes and matrix effects of the extract. The spot should have the diameter at a maximum to en- sure high representativeness of sampling from the filter card. After testing the method for linearity according to Mandel, linearity across the calibration range could be proven for both analytes (CsA: up to 1345 ng/ml, Tac: 39.7 ng/ml) [33]. The limit of detection and quantifica- tion was calculated with the calibration grade function according to DIN 32645 [34]. The limit of detection was 8.21 ng/ml for CsA and 0.49 ng/ml for Tac. The limit of quantification was determined to be 27.33 ng/ml for CsA and 1.63 ng/ml for Tac. We calculated precision and ac- curacy by means of 3 quality controls in repeated identi- fication on 8 days [35]. Precision was between 8.4% and 12.4% for CsA. For Tac, we established values between 9.1% and 16.3%. Accuracy was 1.97% to 9.94% for CsA and 0.61% to 7.72% for Tac. In addition to negative samples, we analyzed patient samples with common co- medication of KTR-like immunsuppressants, statins, an- tihypertensives, anticoagulants, antiviral, antifungal and antibiotic drugs, proton pump inhibitors, analgesics, diu- retics, thyreostatic drugs and Z-drugs like zopiclone and zolpidem to investigate selectivity. No interferences were observed in the analysis. A requirement for the sample transport is sufficient stability of the analytes in the DBS at room temperature. Therefore, we examined both samples from EDTA and sodium fluoride whole blood and quality controls at room temperature and 4˚C. After 14 days, recovery for CsA was 94% ± 4.4% at room temperature and 89% ± 1.8 at +4˚C. For Tac, 95% ± 12.8% could be recovered at room temperature, and 103% ± 2.8% could be recovered in cooled samples (Figure 2). 2.2. Study Subjects In total, 34 patients per CNI were included in the study. The age of the study subjects with CsA medication was between 26 and 74 years, with an average of 62 years. 10 participants were female (29%), 24 (71%) of the partici- pants were male. In the Tac group, the age was between 20 and 75 years, with an average of 49 years. The num- ber of female participants was 14 (41%). With 20 per- sons, the percentage of male participants was 59%. In the CsA group, 98 Hct levels were between 0.21 and 0.35 l/l (mean 0.28 ± 0.04 l/l). All levels were below the normal range of 0.42 to 0.5 l/l for men and 0.37 to 0.45 l/l for women. 92 Hct levels were available for the Tac group. The levels were in the range of 0.18 l/l to 0.42 l/l (mean 0.3 ± 0.06 l/l). 4 measurements were within the normal range. The daily CsA dosage was between 1.26 to 9.10 mg/kg·day (mean 4.17 ± 1.37 mg/kg·day). In total, 41 different co-medications were administered during the study. The daily Tac dosage was between 0.014 to 0.313 mg/kg·day (mean 0.111 ± 0.063 mg/kg·day). In this roup, 51 co-medications were prescribed. g Copyright © 2013 SciRes. AJAC 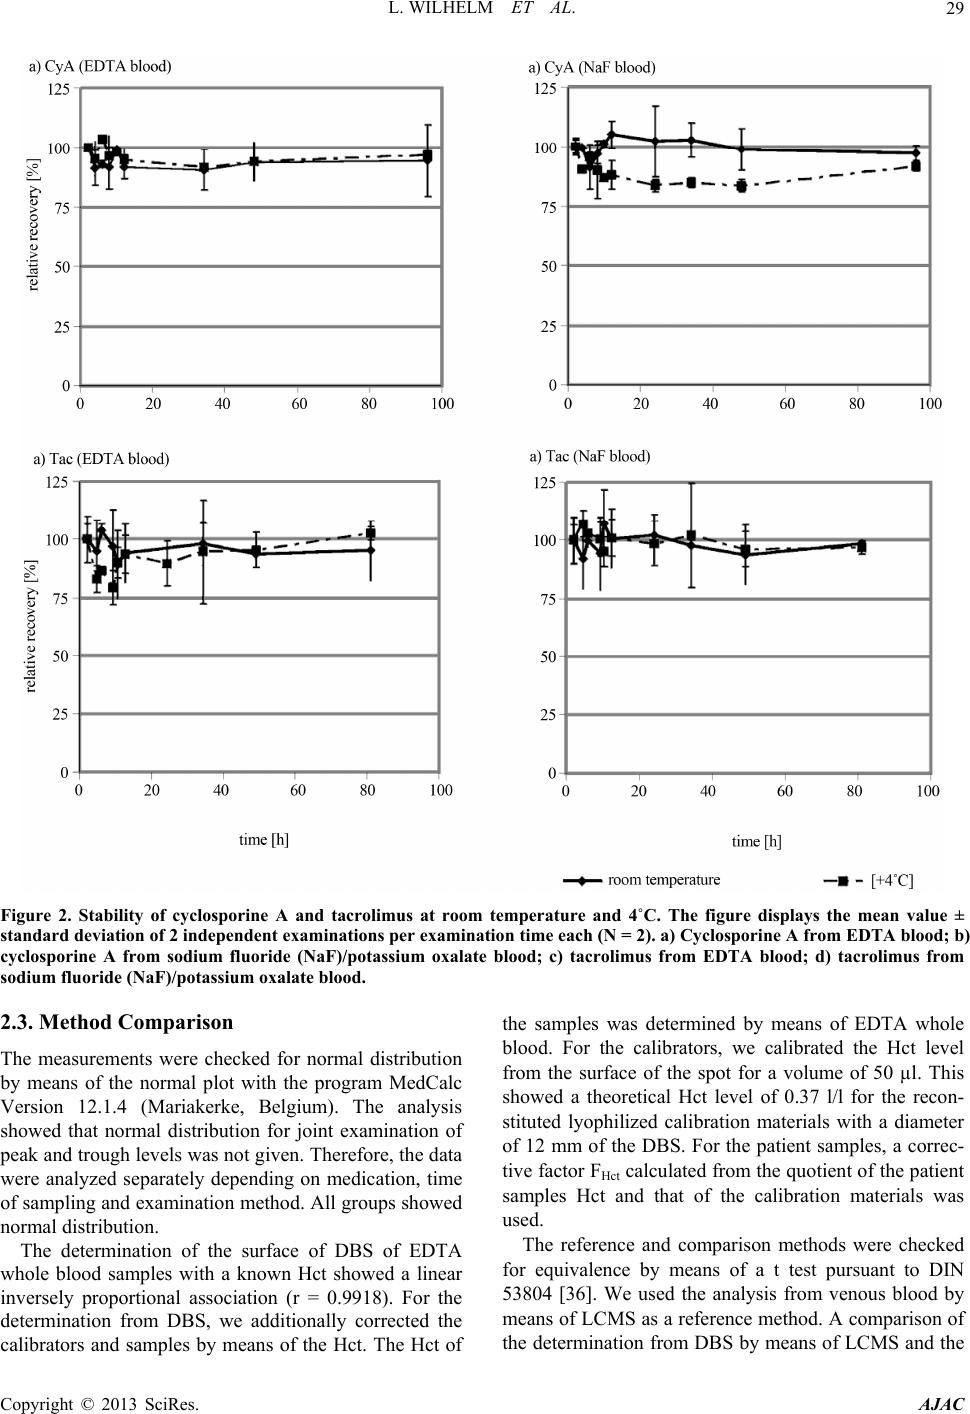 L. WILHELM ET AL. Copyright © 2013 SciRes. AJAC 29 Figure 2. Stability of cyclosporine A and tacrolimus at room temperature and 4˚C. The figure displays the mean value ± standard deviation of 2 independent examinations per examination time each (N = 2). a) Cyclosporine A from EDTA blood ; b) cyclosporine A from sodium fluoride (NaF)/potassium oxalate blood; c) tacrolimus from EDTA blood; d) tacrolimus from sodium fluoride (NaF)/potassium oxalate blood. 2.3. Method Comparison the samples was determined by means of EDTA whole blood. For the calibrators, we calibrated the Hct level from the surface of the spot for a volume of 50 µl. This showed a theoretical Hct level of 0.37 l/l for the recon- stituted lyophilized calibration materials with a diameter of 12 mm of the DBS. For the patient samples, a correc- tive factor FHct calculated from the quotient of the patient samples Hct and that of the calibration materials was used. The measurements were checked for normal distribution by means of the normal plot with the program MedCalc Version 12.1.4 (Mariakerke, Belgium). The analysis showed that normal distribution for joint examination of peak and trough levels was not given. Therefore, the data were analyzed separately depending on medication, time of sampling and examination method. All groups showed normal distribution. The reference and comparison methods were checked for equivalence by means of a t test pursuant to DIN 53804 [36]. We used the analysis from venous blood by means of LCMS as a reference method. A comparison of the determination from DBS by means of LCMS and the The determination of the surface of DBS of EDTA whole blood samples with a known Hct showed a linear inversely proportional association (r = 0.9918). For the determination from DBS, we additionally corrected the calibrators and samples by means of the Hct. The Hct of  L. WILHELM ET AL. 30 determination from venous blood by means of CMIA with the reference method showed no equivalence of the methods both for CsA and for Tac. After correcting the measurements by the Hct, equivalence of determination from DBS with the reference method by means of LCMS from venous blood could be established pursuant to DIN 53804. We prepared an illustration pursuant to Bland-Altman to enable graphic assessment of the method comparisons (Figure 3). The assessment of the trough levels of the analysis from the DBS with the reference method re- sulted in a mean of −23.3% (±1.96 SD: −74.2% to 27.7%, N = 98) for CsA. For the peak levels, the mean was −21.5% (±1.96 SD: −63.7% to 20.8%, N = 96). The comparison of the immunochemical method in the Bland-Altman plot also showed a negative mean with a similar spread (trough level: mean = −8%, ±1.96 SD: −54.9% to 38.7%, N = 97; peak level: mean = −20.6%, ±1.96 SD: −7.5% to 36.3%). The SD for the through and peak level was 26% and 21.5% using the DBS assay in comparison to the reference method LCMS using venous whole blood. The CMIA method showed a little higher SD with 23.9% and 29% in comparison to the reference method. After correcting the measurements from DBS by FHct, a smaller deviation with a slightly higher spread was determined (trough level: mean = 4.7%, ±1.96 SD: −52.1% to 61.4%, N = 96; peak level: mean = 7.3%, ±1.96 SD: −39.7% to 54.4%, N=95). For Tac, the mean were also negative in the assessment of the analysis from DBS with the reference method (trough level: mean = −22.3%, ±1.96 SD: −86.4% to 41.8%, N=101; peak level: mean = −16.6%, ±1.96 SD: −94.3% to 61.1%, N=106). The analysis of the immuno- chemical method to the reference method showed a mean of −11.1% (±1.96 SD: −64.2% to 41.9%, N = 101) for the trough level as well as −11.7% (±1.96 SD: −71.5% to 48.1%, N = 106) for the peak level. The calculation showed SD for the DBS analysis with 32.7% and 39.6% at through and peak level in comparison to the reference method LCMS using venous whole blood. CMIA SD were a little lower with 27.1% and 30.5% in comparison to the reference method. Correcting them by the Hct (FHct) could compensate for the deviation of the determination from DBS for Tac as well (trough level: mean = −0.5%, ±1.96 SD −76.4% to 75.3%, N = 88; peak level: mean = 3.9%, ±1.96 SD: −80.1% to 88.7%, N = 92). The values were subjected to a Passing-Bablok regres- sion. Tables 1 and 2 show the linear equation and the 95% confidence interval. The data confirms the results of the Bland-Altman plot. 3. Discussion 3.1. Method Validation A simple and robust extraction was proposed for the Table 1. Intercept (a) and slope (b) and the 95% confidence interval (CI) for the Passing-Bablok regression for the analysis of cyclosporine A. Group N Intercept a (±95% CI) Slope b (±95% CI) CsA-DBS-trough 98 −3.36 (−43.3 - 19.8) 1.270 (1.058 - 1.554) CsA-DBS-peak 96 −173 (−294 - −56.5) 1.481 (1.318 - 1.657) CsA-CMIA-trough97 −3.74 (−22.8 - 14.2) 1.091 (0.940 - 1.276) CsA-CMIA-peak 95 −122 (−222 - −45.3) 1.447 (1.333 - 1.591) CsA-DBS-trough Hct corrected 96 −18.5 (−45.2 - 7.2) 1.068 (0.870 - 1.273) CsA-DBS-peak Hct corrected 95 −124 (−221 - −38.7) 1.124 (0.978 - 1.287) Table 2. Intercept (a) and slope (b) and the 95% confidence interval (CI) for the Passing-Bablok regression for the ana- lysis of tacrolimus. Group N Intercept a (±95% CI) Slope b (±95% CI) Tac-DBS-trough 101 −1.28 (−2.49 - −0.30) 1.402 (1.246 - 1.640) Tac-DBS-peak 106 −0.77 (−3.43 - 0.61) 1.230 (1.106 - 1.390) Tac-CMIA-trough 101 −0.42 (−1.15 - 0.35) 1.178 (1.063 - 1.304) Tac-CMIA-peak 106 0.40 (−0.90 - 1.75) 1.104 (1.021 - 1.194) Tac-DBS-trough Hct corrected 88 −2.69 (−4.43 - −1.20) 1.482 (1.236 - 1.778) Tac-DBS-peak Hct corrected 92 −1.40 (−3.92 - 0.71) 1.079 (0.907 - 1.293) method developed in this study. The LCMS analysis shows a linear range which covers the measuring range also for peak levels as far as possible. 16 CsA levels and 3 Tac levels show values above the calibration range (max. 1964 ng/ml and 52.8 ng/ml). The measuring range of the method can be expanded experimentally by using in-house calibrators with higher concentrations [17]. No values below the determination limit were found for any of the Tac or CsA patients. Therefore, sufficient sensibil- ity and linearity was established for the method. With values below 15%, the precision and accuracy of the analysis method meets the requirements for clinical- chemical analyses. Only the low control for Tac with a concentration of 3.30 ng/ml close to the limit of detection had a laboratory precision of 16.17% (<20%). These data were up to standard. Specificity could be assessed and proven by means of the test for interference of common co-medication. Fur- hermore, we performed a research in spectra libraries for t Copyright © 2013 SciRes. AJAC  L. WILHELM ET AL. Copyright © 2013 SciRes. AJAC 31 0100 200 300 400 -150 -100 -50 0 50 100 150 Mean LCMS (whole blood) and DBS Assay [ng/ml] Difference (DBS - LCMS (whole blood)) [%] Mean -23,3 -1.96 SD -74,2 +1.96 SD 27,7 010002000 3000 4000 -150 -100 -50 0 50 100 150 Mean of LCMS (wh ole b lood ) an d DBS Assay [ n g/ m l] Difference (DBS - LCMS ( whole blood)) [%] Mean -21,4 -1.96 SD -63,7 +1.96 SD 20,8 (a) 0100 200300 400 -150 -100 -50 0 50 100 150 Mean of LCMS (whole blood) and CMIA Assay [ng/ml] Differe n ce ( CMIA - LCMS ( w ho l e blood)) [%] Mea n -8,0 -1. 96 SD -54,8 +1. 96 SD 38,7 01000 2000 3000 4000 -150 -100 -50 0 50 100 150 Mean of LCMS (wh ole blood) an d CMIA Assay [ ng/m l] Difference (CMIA - LCMS (whole blood)) [%] Mean -20,6 -1.96 SD -77,5 +1.96 SD 36,3 (b) 010203040 0204060 -150 -100 -50 0 50 100 150 Mean of LCMS (whole blood) a nd DBS A ssay [ ng/ ml] Diff erence (DB S - LCM S (whole bl ood)) [%] Mean -16,6 -1.96 SD -94,3 +1.96 SD 61,1 -150 -100 -50 0 50 100 150 Mean of LCMS (whol e blood) an d DBS A ssay [ ng/ ml] Diff erence (DB S - LCM S (whole blood)) [%] +1.96 SD 41,8 Mean -22,3 -1.96 SD -86,4 (c) 0 10203040 -150 -100 -50 0 50 100 150 0204060 -150 -100 -50 0 50 100 150 Mean of LCMS (whol e blood) an d CM I A Assay [ng /ml] Diff erence (CMI A - LCMS (whole blood)) [ %] Mean -11,7 -1.96 SD -71,5 +1.96 SD 48,1 Mean of LCMS (whole blood) a nd CMI A A ssay [ ng/ ml] Difference (CMIA - LCMS (whole blood)) [%] +1.96 SD 41,9 Mean -11,1 -1.9 6 S D -64,2 (d) Figure 3. Bland-Altman Plot for the analysis of cyclosporine A and tacrolimus with mean (continuous line) and 1.96-fold standard deviation (dotted line). Trough levels on the left and peak levels on the right. a) Cyclosporine A for the methods LCMS from DBS versus LCMS from venous blood (trough le vel N = 98, peak levels N = 96); b) cyclosporine A for the meth- ods CMIA versus LCMS from venous blood (trough level N = 97, peak levels N = 95); c) tacrolimus for the methods LCMS from DBS versus LCMS from venous blood (trough level N = 101, peak levels N = 106); d) tacrolimus for the methods CMIA versus LCMS from venous blood (trough level N = 101, peak levels N = 106).  L. WILHELM ET AL. 32 isobaric mass transition which did not lead to any identi- fication of potential interferences. A significant advantage of the introduced method is sending filter cards instead of blood samples to the ex- amining laboratory. Contrary to blood samples in test tubes, filter cards are break-proof and not contagious. However, there are certain requirements for stability of the analytes on the filter card. The proven stability meets the requirement for shipping by mail. The stability tests in this study showed an advantage of storage at room temperature compared to cooled storage. 3.2. Method Equivalents When checking for equivalence of the methods by means of a t test according to DIN 53804, sufficient correspon- dence with the reference method by means of LCMS from venous blood could not be established for any of the two analytes. This was the case for both the immu- nochemical method and the identification from DBS. Representation in the Bland-Altman plot showed that the analysis from DBS lead to 16.6% to 23.3% higher values than those in the venous blood. This leads to the question about the mechanism of this effect. It suggests itself that the cause is the influence of different viscosity of the samples or calibrators and con- trols. Lyophilized calibrators and controls show a differ- ent flow behavior on the filter cards than whole blood samples. In addition, we gathered evidence of a low Hct in the patients. This influences the samples’ viscosity as well. To compensate this systematic influence, a corrective factor was used which takes into consideration the vis- cosity of the calibrators and controls and the Hct of the patient samples. The corrective factor by Hct resulted in equivalence of the method for both analytes and sam- pling times with the reference method. In this study the Hct was measured from venous blood and not from DBS. Hct measurement from DBS would be expedient in fu- ture studies. Capiau et al. developed a method to predict the Hct by a simple potassium measurement from the DBS [37]. In a method comparison, Hinchliffe et al. showed good compliance of the analysis from DBS and venous blood using spiked whole blood calibrators [31]. Problems of spiked whole blood calibrators are a low stability and reproducibility. Therefore, the corrective factor could be a helpful tool establishing standardized methods. Training of the patients on taking samples and feed- back on errors can further reduce the error rate of 6% proven by Yonan et al. [24]. In the present study, capil- lary and venous blood sampling was performed by medical staff under in-patient conditions. The use for outpatients who take the samples themselves and send them to a medical laboratory by mail must be examined further. Analysis from DBS can improve the quality of life of the patients by reducing cost and time intensive visits to the doctor. The simplified blood taking facili- tates a more continuous therapeutic drug monitoring as well as analysis of peak levels and might help to recog- nize complications in the therapy at an early stage. 4. Materials and Methods 4.1. Study Protocol Tac and CsA were determined on several days within 2 weeks during stable drug therapy. The trough levels were taken immediately prior to the patient taking the medica- tion. Blood samples for the peak levels were taken 2 h after the patient had taken the medication. The vital signs were documented under random names. 2 to 4 samples were taken for each patient. The values are determined in venous ethylenediaminetetraacetate (EDTA) blood by means of CMIA and LCMS and in DBS by means of LCMS. In addition, the haematocrit (Hct) was deter- mined within the scope of routine diagnostics in EDTA blood. The study was approved by the ethics committee of the University of Lübeck. All patients gave their writ- ten consent after information about the study. The methods were compared by means of a t test ac- cording to DIN 53804, a Bland-Altman plot and a Pass- ing-Bablok regression. The comparison of methods pur- suant to Bland-Altman and Passing-Bablok was per- formed with the statistic analysis software MedCalc ver- sion 12.1.4 (Mariakerke, Belgium). The t test according to DIN 53804 was calculated in the spreadsheet program Microsoft Office Excel 2003. 4.2. Chemicals and Materials Acetonitrile HPLC ultragradient and methanol LCMS grade were procured from Baker (Griesheim, Germany). Formic acid, ammonium acetate and zinc sulfate hepta- hydrate were products attained from Merck (Darmstadt, Germany). The Milli-Q water was of ultra-pure quality (>18 MΩ/cm) and was produced in-house. We used cali- brators, the quality checks L1, L3 and the internal stan- dards ascomycin and cyclosporine D by Recipe (Munich, Germany). As an additional quality check, we used an UTAK L3 by Invicon (Munich, Germany). A Nova Pack C18 2.1 × 10 mm by Waters (Eschborn, Germany) was used as an analytic column. LCMS analysis was per- formed on a Waters Quattro Micro with a Waters Alli- ance 2795 HPLC (Eschborn, Germany). Evaluation was made with the MassLynx 4.1 software by Waters (Esch- born, Germany). The monovettes EDTA and reaction tubes each 2 ml were produced by Sarstedt (Nürnbrecht, Germany). We used 96 well microtiter plates by Waters (Eschborn, Germany). The hole punch we used had a diameter of 10 mm. The 1.5 mm safty lancets were pro- Copyright © 2013 SciRes. AJAC  L. WILHELM ET AL. 33 duced by HTL-Strefa (Ozorkow, Poland). Proteinsaver 903 Cards were produced by Whatman (Maidstone, U. K.). Immunochemical analysis was carried out on an Architect i2000 SR with the Architect reagent kit CsA and Tac by Abbott (Wiesbaden, Germany). As a precipitation reagent, a 0.2 M zinc sulphate solu- tion in methanol 34% (v/v) with 500 ng/ml cyclosporine D and 80 ng/ml ascomycin was produced. 4.3. Sample Preparation for DBS We applied 50 µl calibrators or controls to the filter pa- per. The filter paper was dried at room temperature for at least 2 h. For sample preparation, we punched out a 10 mm spot of the patient samples, calibrators and controls from the filter card and mixed it with 250 µl precipitation reagent in a 2 ml reaction vessel. Then, the samples were vortexed and incubated in the heating thermomixer for 20 min at 40˚C. We centrifuged the samples for 3 min at 13,000 rpm before transferring 100 µl of the extract to a 96 well microtiter plate for LCMS analysis. 4.4. LCMS Analysis We injected 30 µl of the processed DBS sample into the LCMS. We used a gradient of the mobile phase from 2 mM ammonium acetate/0.1% formic acid in Milli-Q wa- ter and 2 mM ammonium acetate/0.1% formic acid in methanol. The gradient started at 50% and was increased to 100% of the methanolic component with a flow rate of 0.5 ml within 0.3 min. The separation was performed at 50˚C. The absolute analysis time was 2.5 min. We performed the mass spectrometric detection in the multi reaction mode (MRM). MRM transitons and device settings were made after automatic optimization with the MassLynx software (CsA m/z 1220/1203, Tac m/z 821/768, cyclosporine D m/z 1234/1217, ascomycin m/z 810/756). We used lyophilized calibrators with concen- trations of 48.4, 92.4, 187, 472 and 1345 ng/ml for CsA and 2.46, 5.03, 10.2, 20.5 and 39.7 ng/ml for Tac for calibration. As internal standard, we used cyclosporine D for CsA and ascomycin for Tac. 4.5. Whole Blood Measurement Analysis by means of CMIA was performed according to the test producer’s instructions on an Architect System i2000 SR [12,13]. We performed the LCMS analysis with a validated method within the scope of routine ana- lytical chemistry. 5. Acknowledgments Patients, clinical data and sampling were performed by the interdisciplinary transplantation center of the Univer - sity Medical Center Schleswig-Holstein (Lübeck, Ger- many). The calcineurin inhibitors were analyzed by means of CMIA in the central laboratory, department for clinical chemistry, of the University Medical Center Schleswig-Holstein (Lübeck, Germany). The reference method was performed in the LADR GmbH Medizi- nisches Versorgungszentrum (MVZ) Dr. Kramer und Kollegen (Geesthacht, Germany). We would like to thank all people who were involved in this study for their medical and technical assistance. REFERENCES [1] S. F. Yu, L. H. Wu and S. S. Zheng, “Genetic Factors for Individual Administration of Immunosuppressants in Or- gan Transplantation,” Hepatobiliary & Pancreatic Dis- eases International, Vol. 5, No. 3, 2006, pp. 337-344. [2] A. L. Taylor, C. J. Watson and J. A. Bradley, “Immuno- suppressive Agents in Solid Organ Transplantation: Me- chanisms of Action and Therapeutic Efficacy,” Critical Reviews in Oncology/Hematology, Vol. 56, No. 1, 2005, pp. 23-46. http://dx.doi.org/10.1016/j.critrevonc.2005.03.012 [3] J. E. Murray, A. G. Sheil, R. Moseley, P. Knight, J. D. McGavic and G. J. Dammin, “Analysis of Mechanism of Immunosuppressive Drugs in Renal Homotransplanta- tion,” Annals of Surgery, Vol. 160, No. 3, 1964, pp. 449- 473. http://dx.doi.org/10.1097/00000658-196409000-00009 [4] F. Akhlaghi and A. K. Trull, “Distribution of Cyclosporin in Organ Transplant Recipients,” Clinical Pharmacoki- netics, Vol. 41, No. 9, 2002, pp. 615-37. http://dx.doi.org/10.2165/00003088-200241090-00001 [5] T. E. Starzl, S. Todo, J. Fung, A. J. Demetris, R. Venka- taramman and A. Jain, “FK 506 for Liver, Kidney, and Pancreas Transplantation,” Lancet, Vol. 2, No. 8670, 1989, pp. 1000-1004. http://dx.doi.org/10.1016/S0140-6736(89)91014-3 [6] M. Fireman, A. F. DiMartini, S. C. Armstrong and K. L. Cozza, “Immunosuppressants,” Psychosomatics, Vol. 45, No. 4, 2004, pp. 354-360. http://dx.doi.org/10.1176/appi.psy.45.4.354 [7] P. M. Shaw, T. S. Barnes, D. Cameron, J. Engeset, W. T. Melvin, G. Omar, J. C. Petrie, W. R. Rush, C. P. Snyder and P. H. Whiting, “Purification and Characterization of an Anticonvulsant-Induced Human Cytochrome P-450 Catalysing Cyclosporin Metabolism,” Biochemical Jour- nal, Vol. 263, No. 3, 1989, pp. 653-663. [8] L. M. Shaw, “Advances in Cyclosporine Pharmacology, Measurement, and Therapeutic Monitoring,” Clinical Chemistry, Vol. 35, No. 7, 1989, pp. 1299-308. [9] M. Naesens, D. R. Kuypers and M. Sarwal, “Calcineurin Inhibitor Nephrotoxicity,” Clinical Journal of the Ameri- can Society of Nephrology, Vol. 4, No. 2, 2009, pp. 481- 508. [10] B. L. Kasiske, M. G. Zeier, J. R. Chapman, J. C. Craig, H. Ekberg, C. A. Garvey, M. D. Green, V. Jha, M. A, Jose- phson, B. A. Kiberd, H. A. Kreis, R. A. McDonald, J. M. Newmann, G. T. Obrador, F. G. Vincenti, M. Cheung, A. Copyright © 2013 SciRes. AJAC  L. WILHELM ET AL. 34 Earley, G. Raman, S. Abariga, M. Wagner and E. M. Balk, “KDIGO Clinical Practice Guideline for the Care of Kid- ney Transplant Recipients: A Summary,” Kidney Interna- tional, Vol. 77, No. 4, 2009, pp. 299-311. [11] K. M. Rentsch, “Monitoring of Immunosuppressant Drug,” Therapeutische Umschau, Vol. 65, No. 9, 2008, pp. 545-550. http://dx.doi.org/10.1024/0040-5930.65.9.545 [12] Abbott-Laboratories, “Architect System—Cyclosporine,” 2010. [13] Abbott-Laboratories, “Architect System—Tacrolimus,” 2010. [14] U. Ceglarek, J. Lembcke, G. M. Fiedler, M. Werner, H. Witzigmann, J. P. Hauss and J. Thiery, “Rapid Simulta- neous Quantification of Immunosuppressants in Trans- plant Patients by Turbulent Flow Chromatography Com- bined with Tandem Mass Spectrometry,” Clinica Chimica Acta, Vol. 346, No. 2, 2004, pp. 181-190 http://dx.doi.org/10.1016/j.cccn.2004.03.017 [15] P. D. Acott, “Home Fingerprick Sampling for Immu- nosuppressant Drug Monitoring in Pediatric Renal Trans- plant Patients,” Clinical Journal of the American Society of Nephrology, Vol. 2, No. 6, 2006, pp. 304-305. [16] B. G. Keevil, J. Fildes, A. Baynes and N. Yonan, “Liquid Chromatography-Mass Spectrometry Measurement of Tacrolimus in Finger-Prick Samples Compared with Ve- nous Whole Blood Samples,” Annals of Clinical Bioche- mistry, Vol. 46, No. 2, 2009, pp. 144-145. http://dx.doi.org/10.1258/acb.2008.008147 [17] B. G. Keevil, D. P. Tierney, D. P. Cooper, M. R. Morris, A. Machaal, N. Yonan, “Simultaneous and Rapid Analy- sis of Cyclosporin A and Creatinine in Finger Prick Blood Samples Using Liquid Chromatography Tandem Mass Spectrometry and Its Application in C2 Monitoring,” Therapeutic Drug Monitoring, Vol. 24, No. 6, 2002, pp. 757-767. http://dx.doi.org/10.1097/00007691-200212000-00013 [18] A. B. Leichtle, U. Ceglarek, H. Witzigmann, G. Gabel, J. Thiery and G. M. Fiedler, “Potential of Dried Blood Self- Sampling for Cyclosporine c(2) Monitoring in Transplant Outpatients,” Journal of Transplantation, Vol. 2010, 2010, Article ID. 201918. [19] G. Merton, K. Jones, M. Lee, A. Johnston, D. W. Holt, “Accuracy of Cyclosporin Measurements Made in Capil- lary Blood Samples Obtained by Skin Puncture,” Thera- peutic Drug Monitoring, Vol. 22, No. 5, 2000, pp. 594- 598. http://dx.doi.org/10.1097/00007691-200010000-00015 [20] M. D. Pettersen, D. J. Driscoll, T. P. Moyer, J. A. Dearani and C. G. McGregor, “Measurement of Blood Serum Cyclosporine Levels Using Capillary “Fingerstick” Sam- pling: A Validation Study,” Transplant International, Vol. 12, No. 6, 1999, pp. 429-432. [21] R. J. Profumo, T. M. Foy and R. E. Kane, “Correlation between Venous and Capillary Blood Samples for Cy- closporine Monitoring in Pediatric Liver Transplant Pa- tients,” Clinical Transplantation, Vol. 9, No. 5, 1995, pp. 424-426. [22] N. J. Webb, M. G. Coulthard, R. S. Trompeter, M. M. Fitzpatrick, S. Stephens, J. Dudley, H. Maxwell, S. Waller, G. C. Smith, A. R. Watson, D. A. Hughes, B. G. Keevil and J. S. Ellis, “Correlation between Fingerprick and Venous Ciclosporin Levels: Association with Gin- gival Overgrowth and Hypertrichosis,” Pediatric Nephro- logy, Vol. 22, No. 12, 2007, pp. 2111-2118. http://dx.doi.org/10.1007/s00467-007-0586-z [23] N. J. Webb, D. Roberts, R. Preziosi and B. G. Keevil, “Fingerprick Blood Samples Can Be Used to Accurately Measure Tacrolimus Levels by Tandem Mass Spectro- metry, ” Pediatric Transplantation, Vol. 9, No. 6, 2005, pp. 729-733. http://dx.doi.org/10.1111/j.1399-3046.2005.00367.x [24] N. Yonan, R. Martyszczuk, A. Machaal, A. Baynes and B. G. Keevil, “Monitoring of Cyclosporine Levels in Trans- plant Recipients Using Self-Administered Fingerprick Sampling,” Clinical Transplantation, Vol. 20, No. 2, 2006, pp. 221-225. http://dx.doi.org/10.1111/j.1399-0012.2005.00472.x [25] C. Y. Cheung, J. van der Heijden, K. Hoogtanders, M. Christiaans, Y. L. Liu, Y. H. Chan, K. S. Choi, A. van de Plas, C. C. Shek, K. F. Chau, C. S. Li, J. van Hooff and L. Stolk, “Dried Blood Spot Measurement: Application in Tacrolimus Monitoring Using Limited Sampling Strategy and Abbreviated AUC Estimation,” Transplant Interna- tional, Vol. 21, No. 2, 2008, pp. 140-145. [26] K. Hoogtanders, J. van der Heijden, M. Christiaans, P. Edelbroek, J. P. van Hooff and L. M. Stolk, “Therapeutic Drug Monitoring of Tacrolimus with the Dried Blood Spot Method,” Journal of Pharmaceutical and Biome- dical Analysis, Vol. 44, No. 3, 2007, pp. 658-664. http://dx.doi.org/10.1016/j.jpba.2006.11.023 [27] K. Hoogtanders, J. van der Heijden, M. Christiaans, A. van de Plas, J. van Hooff and L. Stolk, “Dried Blood Spot Measurement of Tacrolimus Is Promising for Patient Monitoring,” Transplantation, Vol. 83, No. 2, 2007, pp. 237-238. http://dx.doi.org/10.1097/01.tp.0000250730.30715.63 [28] B. G. Keevil, “The Analysis of Dried Blood Spot Sam- ples Using Liquid Chromatography Tandem Mass Spec- trometry,” Clinical Biochemistry, Vol. 44, No. 1, 2011, pp. 110-108. http://dx.doi.org/10.1016/j.clinbiochem.2010.06.014 [29] D. Lampe, D. Scholz, H. J. Prumke, W. Blank and H. Huller, “Capillary Blood, Dried on Filter Paper, as Sam- ple for Monitoring Cyclosporin A Concentrations,” Clini- cal Chemistry, Vol. 33, No. 9, 1987, pp. 1643-1644. [30] A. J. Wilhelm, J. C. den Burger, R. M. Vos, A. Chah- bouni and A. Sinjewel, “Analysis of Cyclosporin A in Dried Blood Spots Using Liquid Chromatography Tan- dem Mass Spectrometry,” Journal of Chromatography B, Vol. 877, No. 14-15, 2009, pp. 1595-1598. http://dx.doi.org/10.1016/j.jchromb.2009.03.024 [31] E. Hinchliffe, J. E. Adaway and B. G. Keevil, “Simulta- neous Measurement of Cyclosporin A and Tacrolimus from Dried Blood Spots by Ultra High Performance Liq- uid Chromatography Tandem Mass Spectrometry,” Jour- nal of Chromatography B, Vol. 883-884, 2012, pp. 102- 107. http://dx.doi.org/10.1016/j.jchromb.2011.05.016 Copyright © 2013 SciRes. AJAC  L. WILHELM ET AL. Copyright © 2013 SciRes. AJAC 35 [32] A. Mendonza, R. Gohh and F. Akhlaghi, “Determination of Cyclosporine in Saliva Using Liquid Chromatogra- phy-Tandem Mass Spectrometry,” Therapeutic Drug Mo- nitoring, Vol. 26, No. 5, 2004, pp. 569-575. http://dx.doi.org/10.1097/00007691-200410000-00016 [33] W. Funk, V. Dammann and G. Donnevert, “Qualitätsiche- rung in der Analytischen Chemie,” Wiley-VCH Verlag GmbH &Co.KgaA, Weinheim, 2005. [34] W. Funk, D.-I. Vera Dammann, D.-I. Gerhild Donnevert, “Qualitätssicherung in der Analytischen Chemie: Anwen- dungen in der Umwelt-, Lebensmittel- und Werkstoffa- nalytik, Biotechnologie und Medizintechnik,” 1994. http://dx.doi.org/10.1002/9783527624508 [35] F. T. Peters, L. D. Paul, F. Mußhoff, B. Aebi, V. Auwär- ter, T. Kraemer and G. Skopp, “Anforderungen an die Validierung von Analysenmethoden,” ToxChem und KrimTech, Vol. 76, No. 3, 2009, pp. 185-209. [36] DIN 53804, “Teil 1: Statistische Auswertung,” 1990. [37] S. Capiau, V. V. Stove, W. E. Lambert and C. P. Stove, “Prediction of the Hematocrit of Dried Blood Spots via Potassium measurement on a Routine Clinical Chemistry Analyzer,” Analytical Chemistry, Vol. 85, No. 1, 2013, pp. 404-410. http://dx.doi.org/10.1021/ac303014b
|