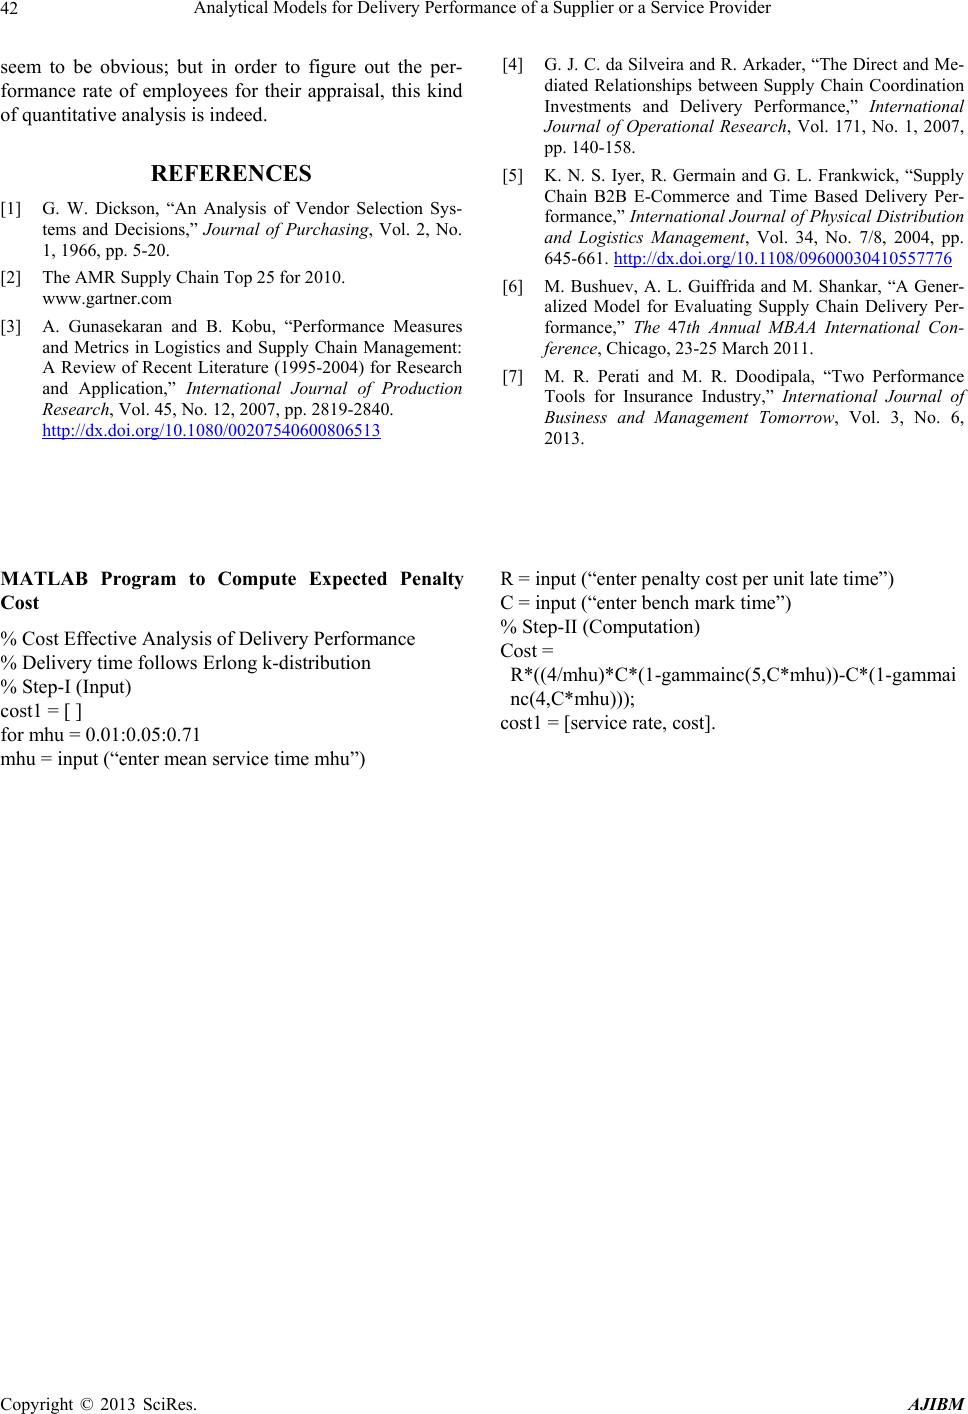
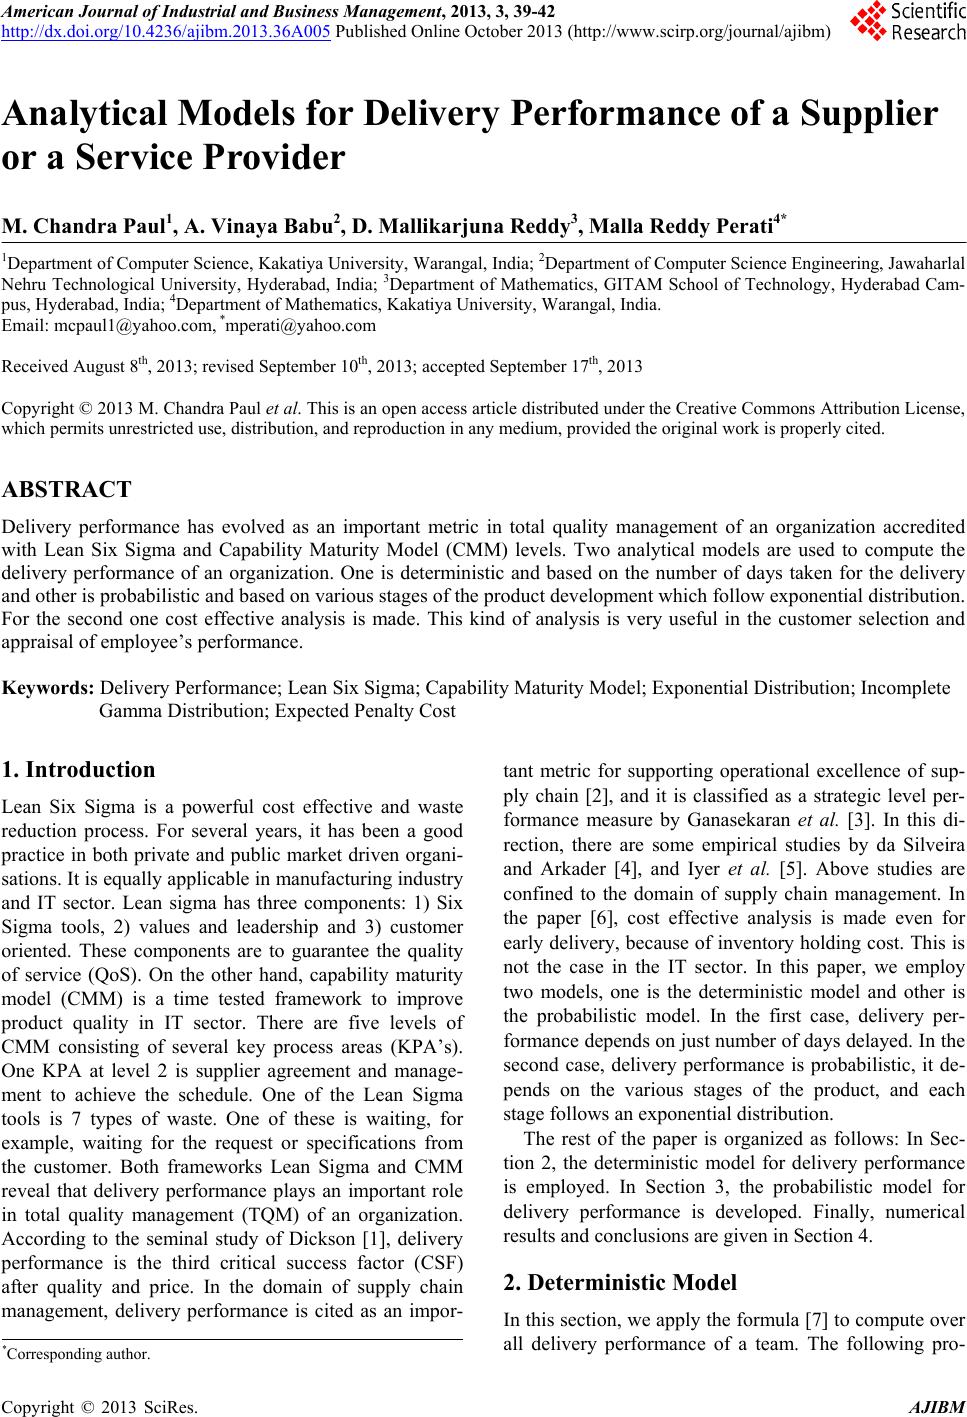
American Journal of Industrial and Business Management, 2013, 3, 39-42
http://dx.doi.org/10.4236/ajibm.2013.36A005 Published Online October 2013 (http://www.scirp.org/journal/ajibm) 39
Analytical Models for Delivery Performance of a Supplier
or a Service Provider
M. Chandra Paul1, A. Vinaya Babu2, D. Mallikarjuna Reddy3, Malla Reddy Perati4*
1Department of Computer Science, Kakatiya University, Warangal, India; 2Department of Computer Science Engineering, Jawaharlal
Nehru Technological University, Hyderabad, India; 3Department of Mathematics, GITAM School of Technology, Hyderabad Cam-
pus, Hyderabad, India; 4Department of Mathematics, Kakatiya University, Warangal, India.
Email: mcpaul1@yahoo.com, *mperati@yahoo.com
Received August 8th, 2013; revised September 10th, 2013; accepted September 17th, 2013
Copyright © 2013 M. Chandra Paul et al. This is an open access article distributed under the Creative Commons Attribution License,
which permits unrestricted use, distribution, and reproduction in any medium, provided the original work is properly cited.
ABSTRACT
Delivery performance has evolved as an important metric in total quality management of an organization accredited
with Lean Six Sigma and Capability Maturity Model (CMM) levels. Two analytical models are used to compute the
delivery performance of an organization. One is deterministic and based on the number of days taken for the delivery
and other is pro babilistic and based on various stages of the product development which follow exponential distribution.
For the second one cost effective analysis is made. This kind of analysis is very useful in the customer selection and
appraisal of employee’s performance.
Keywords: Delivery Performance; Lean Six Sigma; Capability Maturity Model; Exponential Distribution; Incomplete
Gamma Distribution; Expected Penalty Cost
1. Introduction
Lean Six Sigma is a powerful cost effective and waste
reduction process. For several years, it has been a good
practice in both private and public market driven organi-
sations. It is equally applicable in manufacturing industry
and IT sector. Lean sigma has three components: 1) Six
Sigma tools, 2) values and leadership and 3) customer
oriented. These components are to guarantee the quality
of service (QoS). On the other hand, capability maturity
model (CMM) is a time tested framework to improve
product quality in IT sector. There are five levels of
CMM consisting of several key process areas (KPA’s).
One KPA at level 2 is supplier agreement and manage-
ment to achieve the schedule. One of the Lean Sigma
tools is 7 types of waste. One of these is waiting, for
example, waiting for the request or specifications from
the customer. Both frameworks Lean Sigma and CMM
reveal that delivery performance plays an important role
in total quality management (TQM) of an organization.
According to the seminal study of Dickson [1], delivery
performance is the third critical success factor (CSF)
after quality and price. In the domain of supply chain
management, delivery performance is cited as an impor-
tant metric for supporting operational excellence of sup-
ply chain [2], and it is classified as a strategic level per-
formance measure by Ganasekaran et al. [3]. In this di-
rection, there are some empirical studies by da Silveira
and Arkader [4], and Iyer et al. [5]. Above studies are
confined to the domain of supply chain management. In
the paper [6], cost effective analysis is made even for
early delivery, because of inventory holding cost. This is
not the case in the IT sector. In this paper, we employ
two models, one is the deterministic model and other is
the probabilistic model. In the first case, delivery per-
formance depends on just number of days delayed. In the
second case, delivery performance is probabilistic, it de-
pends on the various stages of the product, and each
stage follows an expon ential distribution.
The rest of the paper is organized as follows: In Sec-
tion 2, the deterministic model for delivery performance
is employed. In Section 3, the probabilistic model for
delivery performance is developed. Finally, numerical
results and conclusion s are given in Section 4.
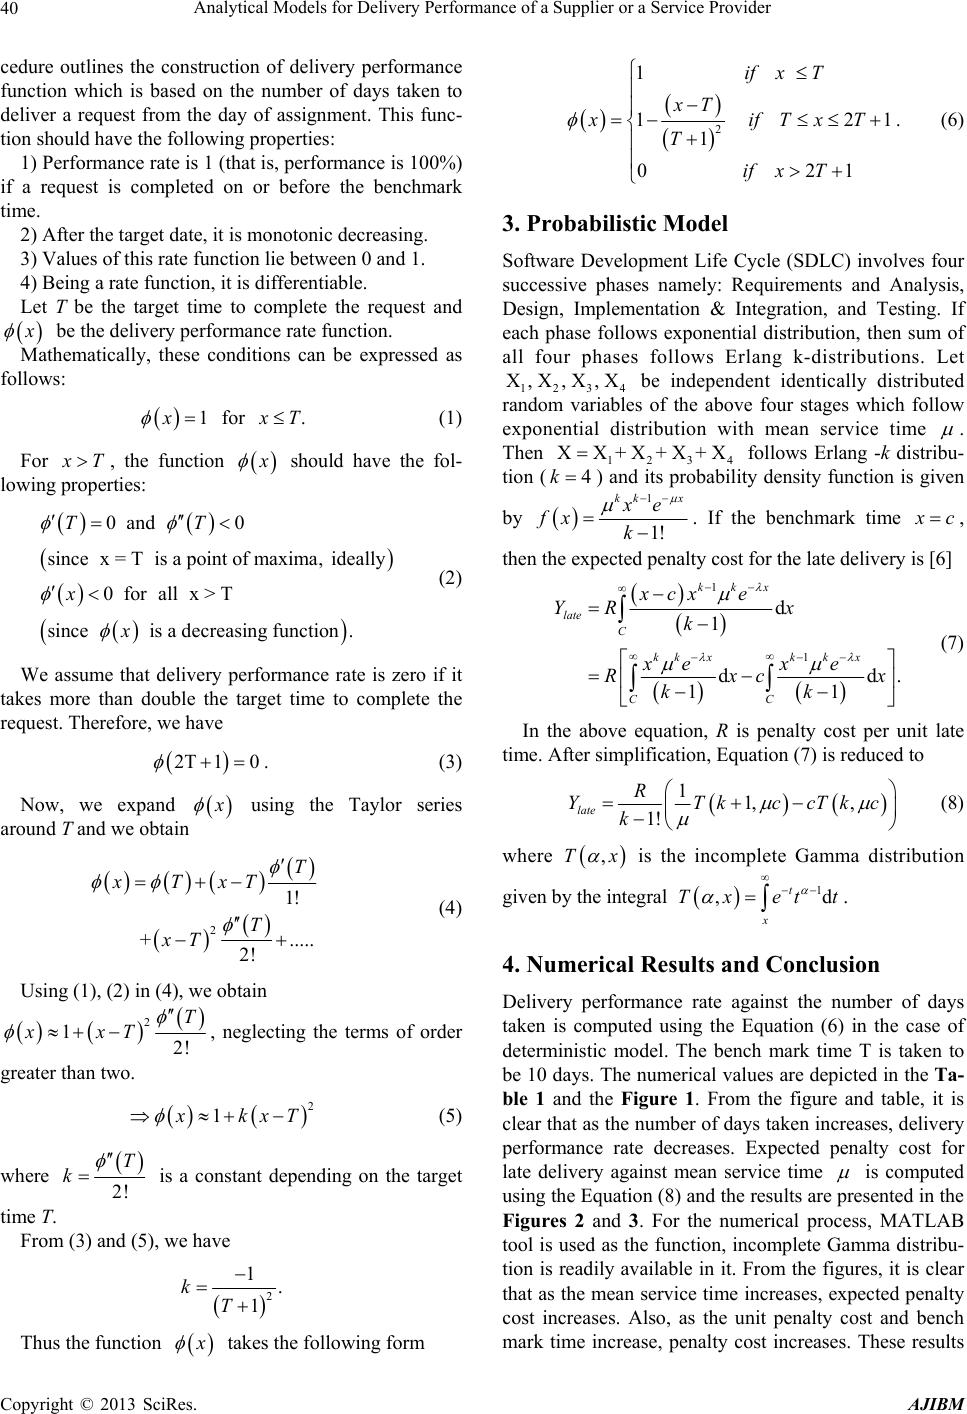
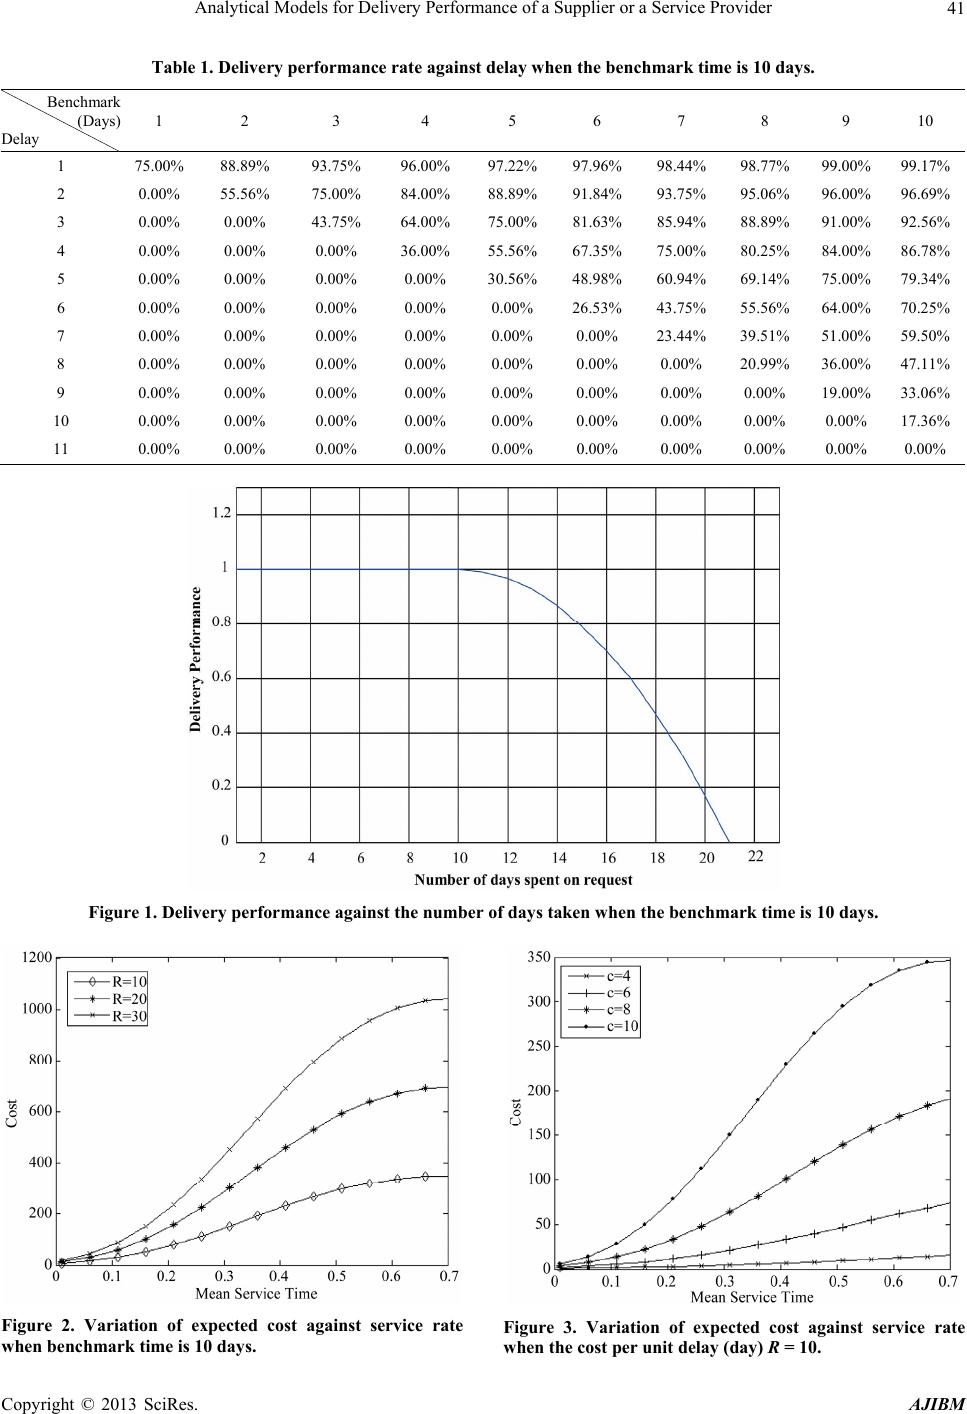
2. Deterministic Model
In this section, we apply the formula [7] to compute over
all delivery performance of a team. The following pro-
*Corresponding a uthor.
Copyright © 2013 SciRes. AJIBM
Analytical Models for Delivery Performance of a Supplier or a Service Provider
40
cedure outlines the construction of delivery performance
function which is based on the number of days taken to
deliver a request from the day of assignment. This func-
tion should have the following properties:
1) Performance rate is 1 (that is, performance is 100%)
if a request is completed on or before the benchmark
time.
2) After the target date, it is monotonic decreasing.
3) Values of this rate function lie between 0 and 1.
4) Being a rate function, it is differentiable.
Let T be the target time to complete the request and

x
be the delivery performance rate function.
Mathematically, these conditions can be expressed as
follows:

1x
for .
x
T (1)
For
x
T, the function
x
should have the fol-
lowing properties:



0and 0
sincex = Tis a point of maxima, ideally
0forallx > T
sinceis a decreasing function.
TT
x
x



(2)
We assume that delivery performance rate is zero if it
takes more than double the target time to complete the
request. Therefore, we have

2T 10
. (3)
Now, we expand

x
using the Taylor series
around T and we obtain
 


2
1!
+ .....
2!
T
xTxT
T
xT




(4)
Using (1), (2) in (4) , we o btain
 
2
12!
T
xxT

 , neglecting the terms of order
greater than two.
 
2
1
x
kx T
 (5)
where

2!
T
k

is a constant depending on the target
time T.
From (3) and (5), we have

2
1.
1
kT
Thus the function

x
takes the following form
 

2
1
1 2
1
0 21
if xT
xT
xif Tx
T
if xT
1T


. (6)
3. Probabilistic Model
Software Development Life Cycle (SDLC) involves four
successive phases namely: Requirements and Analysis,
Design, Implementation & Integration, and Testing. If
each phase follows exponential distribution, then sum of
all four phases follows Erlang k-distributions. Let
1234
be independent identically distributed
random variables of the above four stages which follow
exponential distribution with mean service time
X, X, X, X
.
Then 1234
XX+ X+ X+ X
follows Erlang -k distribu-
tion (4k
) and its probability density function is given
by

1x
1!
xe
fx k
kk

x
c. If the benchmark time
,
then the expected penalty cost for the late delivery is [6]

 
1
1
d
1
dd
11
kkx
late
C
kk xk k x
CC
xcxe
YR x
k
xex e
Rxc
kk





.
x



(7)
In the above equation, R is penalty cost per unit late
time. After simplification, Equation (7) is reduced to

11, ,
1!
late R
YTkccTk
k




c
(8)
where
,Tx
is the incomplete Gamma distribution
given by the integral .

1
,d
t
x
Tx et

t
4. Numerical Results and Conclusion
Delivery performance rate against the number of days
taken is computed using the Equation (6) in the case of
deterministic model. The bench mark time T is taken to
be 10 days. The numerical values are depicted in the Ta-
ble 1 and the Figure 1. From the figure and table, it is
clear that as the number of days taken increases, delivery
performance rate decreases. Expected penalty cost for
late delivery against mean service time
is computed
using the Equation (8) and the resu lts are presented in the
Figures 2 and 3. For the numerical process, MATLAB
tool is used as the function, incomplete Gamma distribu-
tion is readily available in it. From the figures, it is clear
that as the mean service time increases, expected penalty
cost increases. Also, as the unit penalty cost and bench
mark time increase, penalty cost increases. These results
Copyright © 2013 SciRes. AJIBM
Analytical Models for Delivery Performance of a Supplier or a Service Provider
Copyright © 2013 SciRes. AJIBM
41
Table 1. Delivery performance rate against delay when the benchmark time is 10 days.
Benchmark
(Days)
Delay 1 2 3 4 5 6 7 8 9 10
1 75.00% 88.89% 93.75% 96.00% 97.22% 97.96% 98.44% 98.77% 99.00% 99.17%
2 0.00% 55.56% 75.00% 84.00% 88.89% 91.84% 93.75% 95.06% 96.00% 96.69%
3 0.00% 0.00% 43.75% 64.00% 75.00% 81.63% 85.94% 88.89% 91.00% 92.56%
4 0.00% 0.00% 0.00% 36.00% 55.56% 67.35% 75.00% 80.25% 84.00% 86.78%
5 0.00% 0.00% 0.00% 0.00% 30.56% 48.98% 60.94% 69.14% 75.00% 79.34%
6 0.00% 0.00% 0.00% 0.00% 0.00% 26.53% 43.75% 55.56% 64.00% 70.25%
7 0.00% 0.00% 0.00% 0.00% 0.00% 0.00% 23.44% 39.51% 51.00% 59.50%
8 0.00% 0.00% 0.00% 0.00% 0.00% 0.00% 0.00% 20.99% 36.00% 47.11%
9 0.00% 0.00% 0.00% 0.00% 0.00% 0.00% 0.00% 0.00% 19.00% 33.06%
10 0.00% 0.00% 0.00% 0.00% 0.00% 0.00% 0.00% 0.00% 0.00% 17.36%
11 0.00% 0.00% 0.00% 0.00% 0.00% 0.00% 0.00% 0.00% 0.00% 0.00%
Figure 1. Delivery performance against the number of days taken when the benchmark time is 10 days.
Figure 2. Variation of expected cost against service rate
when benchmark time is 10 day s. Figure 3. Variation of expected cost against service rate
when the cost per unit delay (day) R = 10.
Analytical Models for Delivery Performance of a Supplier or a Service Provider
42
seem to be obvious; but in order to figure out the per-
formance rate of employees for their appraisal, this kind
of quantitative analysis is indeed.
REFERENCES
[1] G. W. Dickson, “An Analysis of Vendor Selection Sys-
tems and Decisions,” Journal of Purchasing, Vol. 2, No.
1, 1966, pp. 5-20.
[2] The AMR Supply Chain Top 25 for 2010.
www.gartner.com
[3] A. Gunasekaran and B. Kobu, “Performance Measures
and Metrics in Logistics and Supply Chain Management:
A Review of Recent Literature (1995-2004) for Research
and Application,” International Journal of Production
Research, Vol. 45, No. 12, 2007, pp. 2819-2840.
http://dx.doi.org/10.1080/00207540600806513
[4] G. J. C. da Silveira and R. Arkader, “The Direct and Me-
diated Relationships between Supply Chain Coordination
Investments and Delivery Performance,” International
Journal of Operational Research, Vol. 171, No. 1, 2007,
pp. 140-158.
[5] K. N. S. Iyer, R. Germain and G. L. Frankwick, “Supply
Chain B2B E-Commerce and Time Based Delivery Per-
formance,” International Journal of Physical Distribution
and Logistics Management, Vol. 34, No. 7/8, 2004, pp.
645-661. http://dx.doi.org/10.1108/09600030410557776
[6] M. Bushuev, A. L. Guiffrida and M. Shankar, “A Gener-
alized Model for Evaluating Supply Chain Delivery Per-
formance,” The 47th Annual MBAA International Con-
ference, Chicago, 23-25 March 2011.
[7] M. R. Perati and M. R. Doodipala, “Two Performance
Tools for Insurance Industry,” International Journal of
Business and Management Tomorrow, Vol. 3, No. 6,
2013.
MATLAB Program to Compute Expected Penalty
Cost
% Cost Effective Analysis of Delivery Perform ance
% Delivery time follows Erlong k-distribution
% Step-I (Input)
cost1 = [ ]
for mhu = 0.01:0.05:0.71
mhu = input (“enter mean service time mhu”)
R = input (“enter penalty cost per unit late time”)
C = input (“enter bench mark time”)
% Step-II (Computation)
Cost =
R*((4/mhu)*C*(1-gammainc(5,C*mhu))-C*(1-gammai
nc(4,C*mhu)));
cost1 = [service rate, cost].
Copyright © 2013 SciRes. AJIBM