Energy and Power Engineering, 2013, 5, 498-504
doi:10.4236/epe.2013.54B096 Published Online July 2013 (http://www.scirp.org/journal/epe)
In-Depth Study on Synthesis Load Modeling
Qi Wang, Yong Tang, Bing Zhao
Power System Department, China Electric Power Research Institute, Beijing, China
Email: wangqi@epri.sgcc.com.cn
Received April, 2013
ABSTRACT
Detailed procedures for the modeling of synthesis load models (SLM) of actual power network are presented, then the
classification indices based on 1oad characteristics and the principle of load classification are expounded. Based on the
results of general investigation of 220 kV and 330 kV substations in China’s power grid, the load characteristics are
classified, and detailed load characteristic investigation of selected different kinds of typical substations are carried out.
By use of statistical synthesis, the SLM for typical substations, in which the distribution networks are taken into account,
are built; and the modeling results are disseminated and applied to whole Chinese power grid. Besides, the load model
parameters are evaluated and verified via post-disturbance simulation method. The effectiveness of the built SLM is
validated by the fitting of some disturbance incidents.
Keywords: Chinese Power Grid; Load Characteristics; Load Composition; Load Modeling; Synthesis Load Model
(SLM)
1. Introduction
Load modeling is critical for power system dynamic
analysis [1]. In power system stability analysis, inappro-
priate load models could introduce non-consistent even
reversely against actual results [1-5]. The study results
from CIGRE workgroup indicate that precise load mod-
els could help operation engineers to accurately estimate
the system operation limits. In other words, the load
models with large differences from actual case could
introduce wrong analysis outcome, resulting in improper
security and stability control measures, further worse
operation and finally system splitting and blackout [6]. In
1987, the voltage collapse accident in Japan was mainly
caused by heavy load. The voltage decreased after acci-
dent, and the reactive power characteristics of air-condi-
tioning loads made the further decrease of voltage [7].
The results from WSCC load modeling workgroup in
USA show that pure static load model over estimates the
damping characteristics. Only the hybrid model with
25% motor model can achieve fairly accurate dynamic
stability characteristics [8-9]. For transit power system
angle stability analysis, the plant electric consumption
has significant impact on stability characteristics of gen-
erators, since the percentage of plant electric consump-
tion in most thermal power stations can reach 4%~
6%[10]. Therefore load modeling becomes a hot topic in
academic and power grid companies in China and over-
seas.
Chinese power grid covers very large areas with com-
plicated structure, including typical huge power supply
sending-end systems, e.g. west Inner Mongolia power
grid and Shanxi power grid, and typical large receiving-
end power centers, e.g. Beijing-Tianjin-Tang-shan grid.
There exist dynamic stability and receiving-end voltage
issues of inter-connected power grids, due to long dis-
tance between sending-end and load center. Thus load
characteristics have obvious impacts on the stability cha-
racteristics of Chinese power grid.
Now Chinese regional power grids usually use uni-
form load models and parameters in simulation, which
are non-conformant with practical situations. One of the
most effective methods is load survey, and load modeling
based on practical composition of each substation. But
there need huge work for load modeling for each substa-
tion. Thus some typical substations should be modeled
with practical loads, then promote typical models in
whole power grid.
2. Power Grid Load Survey and
Classification
2.1. Load Characteristics Survey
The objective of load characteristics survey is to find the
load type of each 220 (330) kV substation, then provide
the base for further load classification and typical substa-
tion modeling. Load characteristics survey use table
questionnaires, which are disseminated to province pow-
er grids. The survey covers wide range and need many
people, e.g. dispatch and sales departments, involved in.
Copyright © 2013 SciRes. EPE
Q. WANG ET AL. 499
Considering the time variance of load, survey should
focus on specified time range. This survey includes 2199
220 kV and 330 kV substations in China.
The content of survey includes the percentages of each
load type in the substation. For example, the survey re-
sults of Chengxi substation are shown in Table 1.
Based on survey results, the substation load character-
istics can be determined.
2.2. Classification of Load Characteristics
Based on survey results from above section, all the
220kV and 330kV substations are classified into several
types, which could represent the load characteristics in
this area. The classification principle and basis are shown
in Table 2.
The survey scope in this paper includes 2199 substa-
tions in North China, Central China, East China, North-
west China and Northeast China power grids. Based on
the survey results, all 2199 220 kV and 330 kV substa-
tions are classified into ten types: (a) typical industry
load, (b) hybrid commerce & civilization load, (c) hybrid
industry & civilization load, (d) hybrid civilization &
agriculture load, (e) hybrid industry & agriculture load, (f)
hybrid industry & civilization & agriculture load, (g)
hybrid high energy consuming industry load, (h) elec-
trolysis high energy consuming industry load, (i) di-
rect-supply steel industry load, (j) marine chemical in-
dustry load. The statistical results are shown in Table 3.
Table 1. Load composition statistical results for Chengxi
substation.
Load
Type
Active
Power
(MW)
Reactive
Power
(MVar)
Percentage
of Active
Power
Percentage
of Reactive
Power
Industry 205 73 57% 62%
Commerce46 11 13% 9%
Civilization78 26 21% 22%
Agriculture32 8 9% 7%
Total 361 118 100% 100%
Table 2. Load classification principle of 220(330)kV substation.
Load Type Percentage of
Industry Load ()
Percentage of
Commerce Load ()
Percentage of
Civilization Load ()
Percentage of
Agriculture Load ()
Industry load 75 <20 <20 <20
Hybrid commerce & civilization load <20 20 20 <20
agriculture load <20 <20 <20 75
hybrid industry & civilization load 20 <20 20 <20
Hybrid industry & agriculture load 20 <20 <20 20
hybrid Civilization & agriculture load <20 <20 20 20
hybrid industry & civilization & agriculture load 20 <20 20 20
Table 3. Statistical results of load compositions.
Load Type Index North China Central China East China North-east ChinaNorth-west China Total
(a) 167 113 123 54 20 477
(b) 26 36 67 10 2 141
(c) 200 390 208 84 32 914
(d) 5 12 7 15 --- 39
(e) 26 18 10 51 13 118
(f) 94 66 79 51 17 307
(g) 40 --- --- --- 11 51
(h) 12 36 8 3 12 71
(i) 21 29 23 6 --- 79
(j) 2 --- --- --- --- 2
Total 593 700 525 274 107 2199
Copyright © 2013 SciRes. EPE
Q. WANG ET AL.
500
From the results of five Chinese regional power grids,
the hybrid industry & civilization load substations are the
biggest part, the second and third place are industry load
and hybrid industry & civilization & agriculture load.
The load characteristics distribution results are shown in
Figure 1. Figure 1 shows the distribution of several
common load classes, since special load types, including
steel industry, electrolysis and other high-energy- con-
suming industry, occupy small percentages in total power
load of each regional power grid. It could be found that
one common feature of all power grids: the biggest part
is hybrid industry & civilization load and the second
place is industry load. There are differences in other load
classes of each regional power grid. For example, hybrid
civilization & agriculture load is the third place (16%) in
Northeast China power grid. While the same load class
only occupies 2.7% in Central China power grid. The
hybrid commerce & civilization load in North China
power grid occupies 7.4% of whole load, since Bei-
jing-Tianjin-Tanggu area is a large business load center,
while there is nearly zero hybrid commerce & civiliza-
tion load in Northwest China power grid.
Even in the same regional power grid, the load com-
position could be different between areas (province/city/
autonomous region). Figure 2 shows the main load dis-
tribution of seven areas grids in North China power grid.
It is found that besides hybrid industry & civilization
load, 45% of whole load is commerce load and nearly
zero industry load in Beijing, which is the political, eco-
nomic and culture centre of China. Conversely in Shanxi
power grid, industry load is the biggest part with 50%. In
Southern Hebei power grid, 46% of whole load is hybrid
industry & civilization & agriculture load, which is also
significant part in Tianjin power grid. In West Inner
Mongolia power grid, high-energy-consuming and in-
dustry loads are the main classes. It is clear that there are
significant differences between load characteristics of
different province/city in North China power grid.
Figure 1. Column chart of the distribution of load types for the 5 regional power grids.
Figure 2. Column chart of the distribution of load types for North China power grid.
Copyright © 2013 SciRes. EPE
Q. WANG ET AL. 501
From the comparisons of load characteristics between
regional power grids, and different areas in the same re-
gional power grid, it is found that the differences cannot
be ignorable. It is necessary to divide substations into
different classes, and model each load classes, to get
SLM parameters applicable for practical power grids.
3. Selection of Typical Substation and Detail
Survey
3.1. Selection of Typical Substation
Usually the typical substations are selected according to
load survey and classification results. From each load
classes, typical substations with clear load characteristics
and representative for its area will be selected.
240 typical 220 kV and 330 kV substations have been
selected according to load characteristics survey, statis-
tics and analysis, and considering both location and load
composition. The selected substations have been investi-
gated in details of distribution networks, load composi-
tion and load characteristics. The selected typical substa-
tions distribution is shown in Table 4.
The survey results show that hybrid industry & civili-
zation load and industry load are the first and second
place in load composition, and hybrid industry & civili-
zation & agriculture load occupies significant part in
most areas. Thus there are a large number of typical sub-
stations selected for these three load types, and the selec-
tion is adjusted in each regional power grid. It could be
found from Table 4 that the selected typical substations
could represent the practical load composition in each
regional power grid.
3.2. Detail Survey of Typical Substations
There are large amount data in detail load characteristics
survey of typical substation. The data include network
topology of 220 (330) kV substations; transformer, line,
reactive power compensation and relevant data of 220
Table 4. Distribution of typical substations.
Load Type
Index
North
China
Central
China
East
China
Northeast
China
Northwest
China Total
(a) 24 16 186 2 66
(b) 3 4 7 1 1 16
(c) 14 23 148 3 62
(d) 1 1 1 1 --- 4
(e) 6 3 1 6 1 17
(f) 14 9 106 1 40
(g) 7 --- ------ 1 8
(h) 2 6 2 1 1 12
(i) 4 5 4 1 --- 14
(j) 1 --- ------ --- 1
Total 76 67 57 30 10 240
(330) kV substations; the load data of all feeders in sur-
vey time, including active power, reactive power, current,
voltage, power factor, etc.; detailed load composition of
each feeder.
The load types under survey include civilization load,
commerce load, agriculture load, textile industry load,
paper industry load, medicine industry load, food indus-
try load, mechanic industry load, etc. Electrical power
loads consist of many different electrical devices. To
understand load composition, firstly should understand
the main load types. Normally, power load could be di-
vided into four types: 1) civilization load, including air-
conditioning, lighting, electrical appliance, etc.; 2) com-
merce load, i.e. power consumed by business organiza-
tion, e.g. business service organization; 3) industry load,
including production, machining, manufacturing enter-
prises, e.g. mining, food, tobacco, textile, wood machin-
ing, furniture, paper, printing, chemical, oil chemical; 4)
agriculture load, including farm irrigating, village etc.
Electrical demand consists of different load types,
each load type consists of many electrical devices, which
have different characteristics. Thus the percentage of each
kind of electrical device is also important survey data.
Chengxi substation is used as an example to show
above method. The total load is about 361 MW in
Cheng- xi substation. The detail load composition of
Chengxi substation is shown in Table 5.
4. Load Modeling with Statistics Synthesis
Method
The statistics synthesis method obtains the synthesized
model of all loads connected with one node considering
distribution networks, via a series of statistic and synthe-
sis, i.e. the relationship of node active power and reactive
power with node voltage and frequency variations. Fig-
ure 3 shows the SLM modeling process based on statistic
synthesis method and considering distribution network.
The detailed survey results including substation load
composition is the basis of SLM modeling, the kernel of
load modeling is the calculation of SLM parameters ac-
cording to statistic data.
Table 5. Electrical device composition of Chengxi substa-
tion.
Index Load Type Percentage (%)
1 Big industrial motor 46.31
2 Fluorescent Lamp 19.47
3 TV 9.59
4 Electrical furnace 8.4
5 Water heater 6.61
6 Cooling aircon 3.83
7 Refrigerating equipment 2.43
8 Washing machine 2.15
9 Small industrial motor 1.21
Copyright © 2013 SciRes. EPE
Q. WANG ET AL.
502
Figure 3. SLM modeling process based on statistic sy nthesis
method.
The induction motor load is more than 60% of power
loads. The power system load dynamic process within
tens of seconds is mainly caused by induction motor. In
previous research, the proposed motor cluster equiva-
lence algorithms have issues in accuracy and applicabil-
ity.
In this paper, the motor cluster equivalence algorithm
in paper [12,13] is used. This equivalence algorithm di-
vides the induction motor cluster into two sub-clusters,
according to the rotor patterns and mechanic pattern re-
sistance ratio. Then all motors could equivalent to sin-
gle-machine equivalence model based on induction mo-
tor physical characteristics. In order to improve model
accuracy, the master motor cluster is introduced to revise
the model. Since the obtained single machine equiva-
lence model has clear physical characteristics, the model
performs good applicability even in large disturbance
operation mode.
As shown in Figure 3, SLM modeling for typical sub-
station is the basis of SLM model for whole power grid.
Based on the practical load composition shown in Table
3, some representative substations have been selected as
shown in Table 4.
For example, the Chengxi substation SLM model is
shown in Table 6, in which ZP is the constant resistance
component in static active power, ZQ is the constant re-
sistance component in static reactive power, IP is the
constant current component in static active power, IQ is
the constant current component in static reactive power,
PP is the constant power component in static active pow-
er, PQ is the constant power component in static reactive
power, Nm is motor percentage, Lf is load factor, Tj is
motor inertia time constant, Rs is motor stator resistance,
Xs is motor stator reactance, Xm is motor excitation re-
actance, Rr is motor rotor resistance, Xr is motor rotor
reactance, R* is distribution network branch resistance,
X* is distribution network branch reactance.
After calculating SLM parameters for each typical
substation, SLM parameters of the same load class in
different regional power grids have been further synthe-
sized. The SLM dynamic model, static model and distri-
bution network equivalent impedance have been com-
pared and combined, to calculate the uniform SLM pa-
rameters for this load type. The results show that SLM
parameters of the same load type in different regional
power grids have high similarity, which is the result of
load characteristics classification principle introduced in
Section 2.2. Based on such results, multiple typical sub-
station SLM parameters could be combined into uniform
SLM parameters for whole power grid.
In East China power grid, the hybrid industry & civi-
lization load and industry load are the largest part of total
load, with percentage of 40% and 23%. The SLM pa-
rameters for industry load and hybrid industry & civiliza-
tion load in East China power grid have been listed in
Table 7 and Table 8.
Table 6. SLM parameters for Chengxi substation.
ZP% ZQ% IP% IQ% PP% PQ%
34 34 43 43 23 23
Rs Xs Xm Rr Xr Tj
0.015 0.118 3.67 0.01 0.118 2.82
Nm Lf R* X*
56% 0.4 0.004 0.08
Table 7. SLM parameters for industry load.
ZP% ZQ% IP% IQ% PP% PQ%
10 10 70 70 20 20
Rs Xs Xm Rr Xr Tj
0.015 0.118 3.68 0.04 0.118 2.84
Nm Lf R* X*
70% 0.4 0.003 0.08
Copyright © 2013 SciRes. EPE
Q. WANG ET AL. 503
Table 8. SLM parameters for hy brid industry & civilization
load.
ZP% ZQ% IP% IQ% PP% PQ%
34 34 43 43 23 23
Rs Xs Xm Rr Xr Tj
0.015 0.118 3.67 0.04 0.118 2.82
Nm Lf R* X*
55% 0.4 0.004 0.08
Compared with existing 40% constant resistance+60%
constant power static model used in East China power
grid, SLM considers load dynamic characteristics: the
motor percentages in industry load and hybrid industry &
civilization load are 70% and 55%, respectively. The
static load composition of SLM is more complicated than
that of existing static model. SLM motor inertia time
constant of industry load is higher than that of hybrid
industry & civilization load. The SLM motor exciting
reactance of industry load is also higher than that of hy-
brid industry & civilization load. The key reason is that
industrial motor has higher load inertia than residential
motor, and industrial motor also has higher exciting re-
actance.
5. SLM Model Verification Based on
Disturbance Incidents
In this section, the post-disturbance simulation method is
used to verify SLM parameters, by collecting various
disturbance incidents in practical power grids.
In May.20, 2007, three phase short circuit fault hap-
pened at the Nanjiang side of 110 kV Nanju line. This
incident is a typical incident close to load side. Following
figure shows the electric connection chart of Nanjiang
220 kV substation.
From Figure 4, it is clear that Nanju line had no load
when the fault happened. The Nanju line and Nanluo
line(Nanjiang bus #2 to Luofu) fault current simulated by
both existing load model and SLM model, and measured
current curves are shown in Figure 5. For fault line cur-
rent, the existing model simulation result has greatest
1kA difference from measured one. While SLM simula-
tion results are closer to measured results. For non-fault
line current, the existing model simulation results change
conversely with the measured curve during the fault du-
ration. After the fault duration, the change features are
also quite different from the measured curve. The simu-
lation curve based on SLM model results change close to
the measured curve with small variance. Based on above
results, it is clear that SLM has higher simulation accu-
racy in current simulation.
Figure 4. Electric conne ction chart of Nanjiang 220 kV sub-
station.
(a)
(b)
Figure 5. Comparing the simulating fault current curves for
different load models with the measured curve when a
three-phase fault is occurred on the 110 kV transmission
line from Nanjiang to Juxi. (a) 110 kV Nanju line fault cur-
rent curves. (b) 110 kV Nanluo line fault current curves.
Copyright © 2013 SciRes. EPE
Q. WANG ET AL.
Copyright © 2013 SciRes. EPE
504
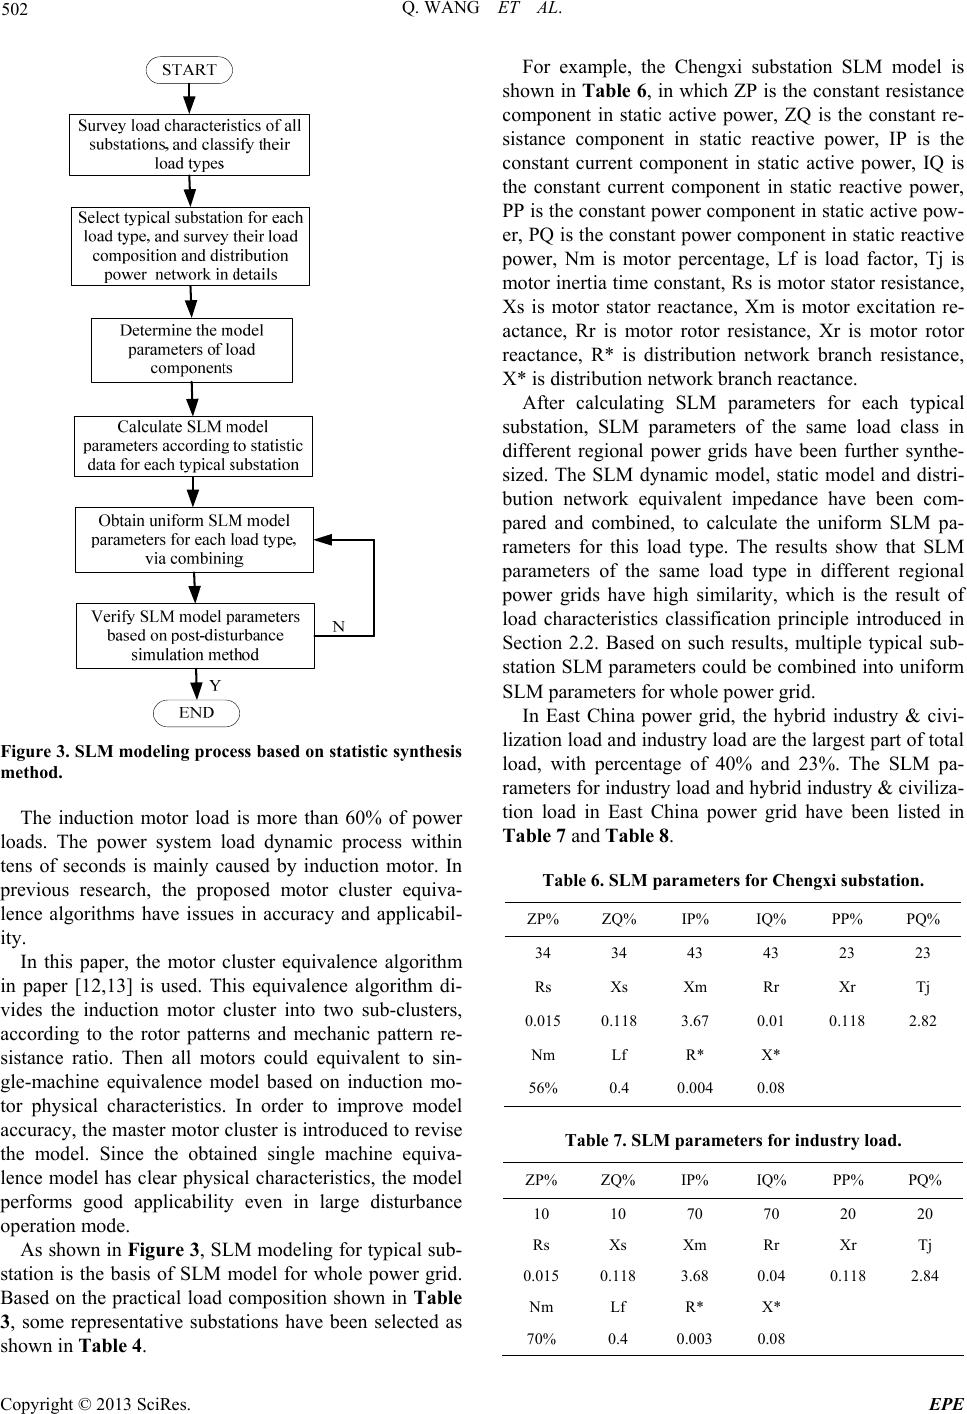
Figure 6. Comparison of voltage curves of Nanjiang 110 kV
bus for different load models.
Nanjiang bus #2 voltage curves simulated by both ex-
isting load model, SLM, and measured voltage curve are
shown in Figure 6.
From Figure 6, in existing model simulation results,
the bus voltage recover very fast to original level with even
no delay, while the measured voltage recovers slower.
SLM simulation results are close to measured ones with
small variance. Thus it is clear that SLM model has
higher accuracy in voltage simulation.
6. Conclusions
Detailed procedures for the modeling of synthesis load of
actual power network have been proposed in this paper,
then the classification indices based on 1oad characteris-
tics and the principle of load classification have been
expounded. The load characteristics of 2199 220 kV and
330kV substations in Chinese five regional power grids
have been surveyed. Based on the results of general in-
vestigation, the load characteristics have been classified
according to the proposed principle, then based on the
detailed investigation and statistics of load composition
at 220 kV and 330 kV substations, the distribution of
different types of load in domestic power grids has been
analyzed and 120 typical substations have been selected.
Detailed load characteristic investigation of these se-
lected different kinds of typical substations has been car-
ried out. The statistical synthesis method has been used
to model typical substations with SLM model parameters.
The SLM model parameters of same load types in dif-
ferent regional power grids have been synthesized, and
the dynamic model, static model and distribution power
network equivalent reactance have been compared and
combined, then unified SLM model parameters in whole
power grid have been introduced. Finally, the load model
arameters have been evaluated and verified via post-
disturbance simulation method. The effectiveness of
SLM has been validated by the fitting of some distur-
bance incidents.
REFERENCES
[1] IEEE Task Force on Load Representation for Dynamic
Performance, Load Representation for Dynamic Per-
formance Analysis, IEEE Transactions on Power Systems,
Vol. 8, No. 2, pp. 472-482. doi:10.1109/59.260837
[2] IEEE, Computer Analysis of Power Systems Working
Group of the Computer and Analytical Methods Sub-
committee-Power System Engineering Committee. Sys-
tem Load Dynamics-Simulation Effects and Determina-
tion of load Constants. IEEE Trans, Vol. PAS-92, 1973,
pp. 600-609.
[3] Y. Sekine and H. Ohtsuki, “Cascaded Voltage Collapse,”
IEEE Transactions on Power Systems, Vol. 5, No. 1,
1990, pp. 250-256. doi:10.1109/59.49113
[4] D. Popovic, I. A. Hiskens and D. J. Hill, “Investigations
of Load-Tap Change Interaction,” Electrical Power &
Energy Systems, Vol. 18, No. 2, 1996, pp. 81-97.
doi:10.1016/0142-0615(94)00003-4
[5] M. K. Pal, “Assessment of Corrective Measures for Volt-
age Stability Considering Loads Dynamics,” Electrical
Power & Energy Systems, Vol.17, No. 5, 1995, pp.
325-334. doi:10.1016/0142-0615(95)00049-4
[6] CIGRE Task Force 38.02.05. Load Modeling and Dy-
namics. Electra, May 1990.
[7] A. Kurita and T. Sakurai, “The Power System Failure on
July 23, 1987 in Tokyo,” 27th IEEE Conference on Deci-
sion and Control, Vol. 3, 1988, pp. 2093-2097.
doi:10.1109/CDC.1988.194703
[8] D. N. Kosterev, C. W. Tayor and Mittelstadt, “Model
Validation for the August 10, 1996 WSCC System Out-
age,” IEEE Trans. on Power Systems, Vol. 14, No. 3,
1999, pp. 967-979doi:10.1109/59.780909
[9] L. Pereira, D. Kosterev, P. Mackin, et al., “An Interim
Dynamic Induction Motor Model for Stability Studies in
the WSCC,” IEEE Transactions on Power Systems
Vol. 17, No. 4, 2002, pp. 1108-1115
doi:10.1109/TPWRS.2002.804960
[10] S. Z. Zhu, J. H. Zheng, L. Li, et al., “Effect of Load Mod-
eling on Voltage Stability,” IEEE PES Summer Meeting,
2000
[11] General Electric Company, “Load Modeling for Power
Flow and Transient Stability Computer Studies,” EPRI
Report EL-5003, Project 849-7, Vol. 1-2, 1987.
[12] B. Zhao and Y. Tang, “Dynamic Characteristics an
Analysis of Induction Motor Loads,” Proceedings of the
CSEE, Vol. 29, No. 7, 2009, pp. 71-77
[13] B. Zhao, Y. Tang and W. C. Zhang, “Study on Sin-
gle-unit Equivalent Algorithm of Induction Motor
Group,” Proceedings of the CSEE, Vol. 29, No. 19, 2009,
pp. 43-49
p