 American Journal of Industrial and Business Management, 2013, 3, 12-22 http://dx.doi.org/10.4236/ajibm.2013.36A002 Published Online October 2013 (http://www.scirp.org/journal/ajibm) The Adoption of e-Government Services in Mexico: A Citizens’ Perception Analysis Juan Manuel Gomez-Reynoso1, Rodrigo Sandoval-Almazan2 1Departamento de Sistemas Electronicos, Universidad Autonoma de Aguascalientes, Aguascalientes, México; 2Facultad de Conta- duría y Administración, Universidad Autonoma del Estado de México, Toluca, México. Email: jmgr@correo.uaa.mx, rsandovala@uaemex.mx Received August 28th, 2013; revised October 1st, 2013; accepted October 8th, 2013 Copyright © 2013 Juan Manuel Gomez-Reynoso, Rodrigo Sandoval-Almazan. This is an open access article distributed under the Creative Commons Attribution License, which permits unrestricted use, distribution, and reproduction in any medium, provided the original work is properly cited. ABSTRACT Governments have provided services to citizens by using means such as: face-to-face, regular mail, telephone, among others. These services have been proven to be good channels of communication and interaction, but they have limita- tions. For example, services are provided only on time and days previously established and not all government person- nel are service-oriented. These services can be improved by using information and communication technologies. Therefore, these are some reasons why the Mexican government has been pursuing the implementation of services over the Internet so that users can have access any time. In the present research an existing model proposed in the previous research [1] was adapted and analyzed in order to understand whether it is suitable to Mexican e-government efforts. Data collection was made through an online survey, which was answered for 217 citizens from all 32 Mexican states. Results show that such model is not suitable for the Mexican case; this could be due to cultural, demographic and eco- nomic differences. Thus, further research that identifies a new model is needed. Keywords: e-Government; Information and Communication Technologies (ICT); Digital Transactions; eServices 1. Introduction Internet has emerged as a great phenomenon, which has had a transforming effect in the society. Internet has opened up new means of communication for individuals and organizations and has provided the opportunity to access services and information in ways that two decades ago were not possible [1]. Internet growth was driven mainly to support activities for private organizations. A large number of companies have adopted e-Commerce because of its associated advantages [2]. Internet be- comes an interaction platform among officials and citi- zens. Nowadays the link between business and Internet has been related to e-Commerce, and e-Commerce has a long story. Applications start at the beginning of the 70s with some innovations such as the fundamentals of elec- tronic transfers, but until the early 90s they began the commercialization of th e Internet and the introd uction of the Web, and it was then that the applications of e-Commerce began at a very rapid pace, Scholl [3] has been compared with e-Commerce and e-Goverment and found that the first one is the stepping stone of the con- cepts and basic elements of electronic government. Information and communication technologies (ICTs) are also becoming prominently for governments, which is why they are developing and improving Internet por- tals for offering services to citizens. A number of initia- tives have been performed to improve the efficiency and effectiveness of government’s internal operations, com- municating with citizens, transactions with individuals and organizations; all of these are through electronic means [1]. The evolution of digital services provided by govern- ments around the world has been at a very rapid pace. For example, in 1995 there were only 142 e-G overnment Websites around the world; this number increased to 2617 in 1998; while in 2001 there existed more than 50,000 [1]. Results of recent studies indicate that gov- ernments are having th e tendency to ado pt e-Govern ment services [4]. However, it is necessary that the public sec- tor should consider a series of requirements for the im- plementation of this type of technology such as: infra- structure, appropriate policies, development capabilities, ICT applications and relevant content, among others. The following sectio ns descr ibe details about e-Gover- Copyright © 2013 SciRes. AJIBM 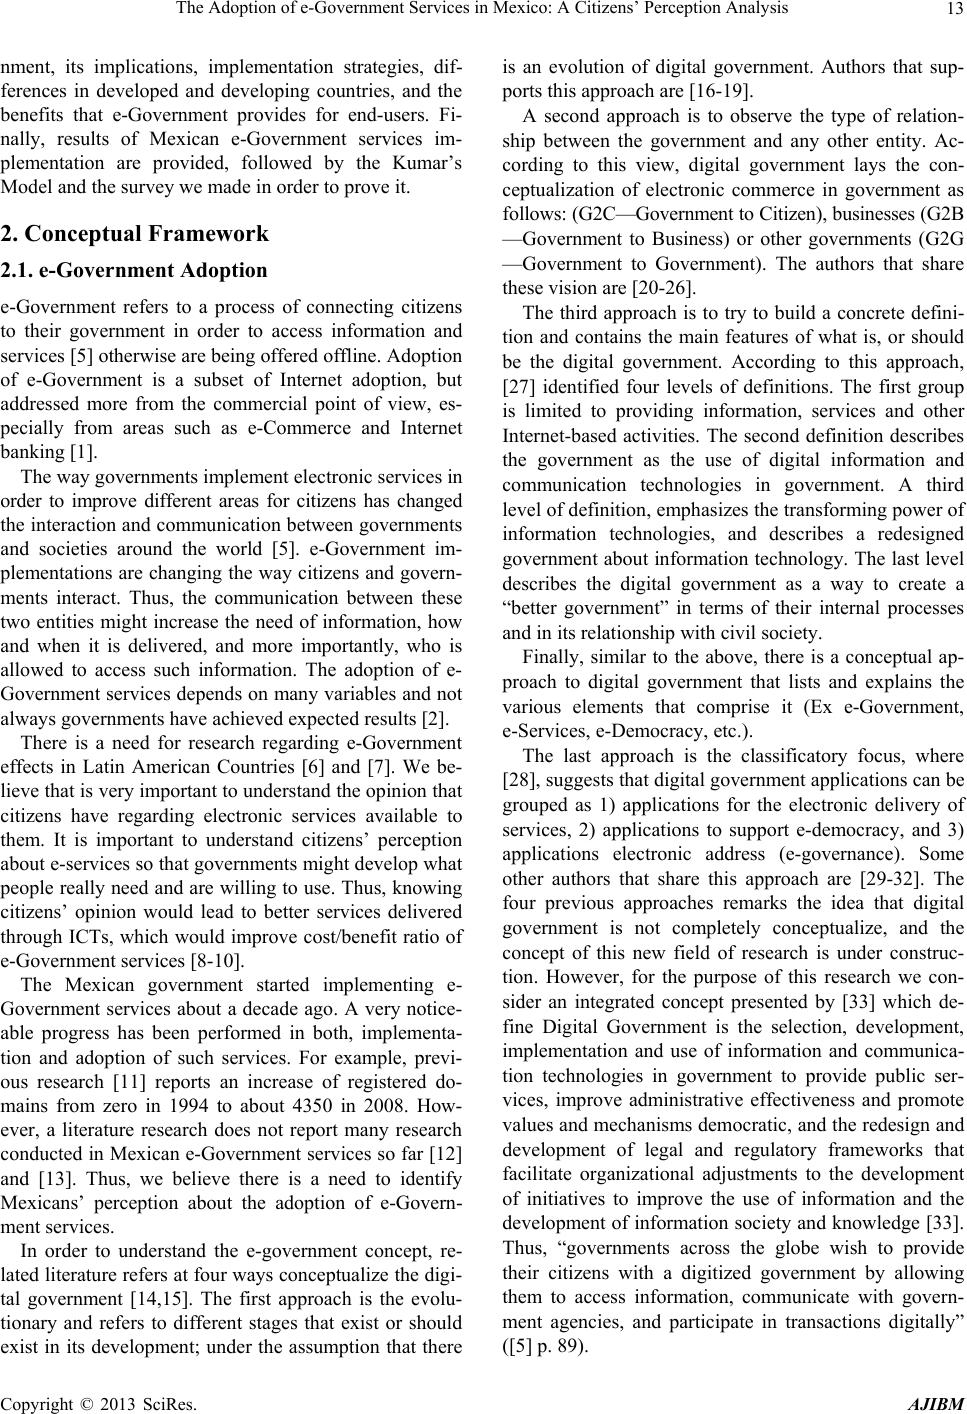 The Adoption of e-Government Services in Mexico: A Citizens’ Perception Analysis 13 nment, its implications, implementation strategies, dif- ferences in developed and developing countries, and the benefits that e-Government provides for end-users. Fi- nally, results of Mexican e-Government services im- plementation are provided, followed by the Kumar’s Model and the survey we made in order to prove it. 2. Conceptual Framework 2.1. e-Government Adoption e-Government refers to a process of connecting citizens to their government in order to access information and services [5] otherwise are being offered offline. Adoption of e-Government is a subset of Internet adoption, but addressed more from the commercial point of view, es- pecially from areas such as e-Commerce and Internet banking [1] . The way governments implement electronic services in order to improve different areas for citizens has changed the interaction and communication between governments and societies around the world [5]. e-Government im- plementations are changing the way citizens and govern- ments interact. Thus, the communication between these two entities might increase the need of information, how and when it is delivered, and more importantly, who is allowed to access such information. The adoption of e- Government services depends on many variables and not always governments have achieved expected results [2]. There is a need for research regarding e-Government effects in Latin American Countries [6] and [7]. We be- lieve that is very important to understand the opinion that citizens have regarding electronic services available to them. It is important to understand citizens’ perception about e-services so that governments might develop what people really need and are willing to us e. Thus, knowing citizens’ opinion would lead to better services delivered through ICTs, which would improve cost/benefit ratio of e-Government serv ices [8-10]. The Mexican government started implementing e- Government services about a decade ago. A very notice- able progress has been performed in both, implementa- tion and adoption of such services. For example, previ- ous research [11] reports an increase of registered do- mains from zero in 1994 to about 4350 in 2008. How- ever, a literature research does not report many research conducted in Mexican e-Government services so far [12] and [13]. Thus, we believe there is a need to identify Mexicans’ perception about the adoption of e-Govern- ment services. In order to understand the e-government concept, re- lated literature refers at four ways conceptualize the digi- tal government [14,15]. The first approach is the evolu- tionary and refers to different stages that exist or should exist in its development; under the assumption that there is an evolution of digital government. Authors that sup- ports this approach are [16-19]. A second approach is to observe the type of relation- ship between the government and any other entity. Ac- cording to this view, digital government lays the con- ceptualization of electronic commerce in government as fo llows: (G2C—Government to Citizen), businesses (G2B —Government to Business) or other governments (G2G —Government to Government). The authors that share these vision are [20-26]. The third approach is to try to build a concrete defini- tion and contains the main features of what is, or should be the digital government. According to this approach, [27] identified four levels of definitions. The first group is limited to providing information, services and other Internet-based activities. The second definition describes the government as the use of digital information and communication technologies in government. A third level of definition, emphasizes the transforming power of information technologies, and describes a redesigned government about information technology. The last level describes the digital government as a way to create a “better government” in terms of their internal processes and in its relationship with civil society. Finally, similar to the above, there is a conceptual ap- proach to digital government that lists and explains the various elements that comprise it (Ex e-Government, e-Services, e-Democracy, etc.). The last approach is the classificatory focus, where [28], suggests that digital government applications can be grouped as 1) applications for the electronic delivery of services, 2) applications to support e-democracy, and 3) applications electronic address (e-governance). Some other authors that share this approach are [29-32]. The four previous approaches remarks the idea that digital government is not completely conceptualize, and the concept of this new field of research is under construc- tion. However, for the purpose of this research we con- sider an integrated concept presented by [33] which de- fine Digital Government is the selection, development, implementation and use of information and communica- tion technologies in government to provide public ser- vices, improve administrative effectiveness and promote values and mechanisms democratic, and the redesign and development of legal and regulatory frameworks that facilitate organizational adjustments to the development of initiatives to improve the use of information and the development of information society and knowledge [33]. Thus, “governments across the globe wish to provide their citizens with a digitized government by allowing them to access information, communicate with govern- ment agencies, and participate in transactions digitally” ([5] p. 89). Copyright © 2013 SciRes. AJIBM 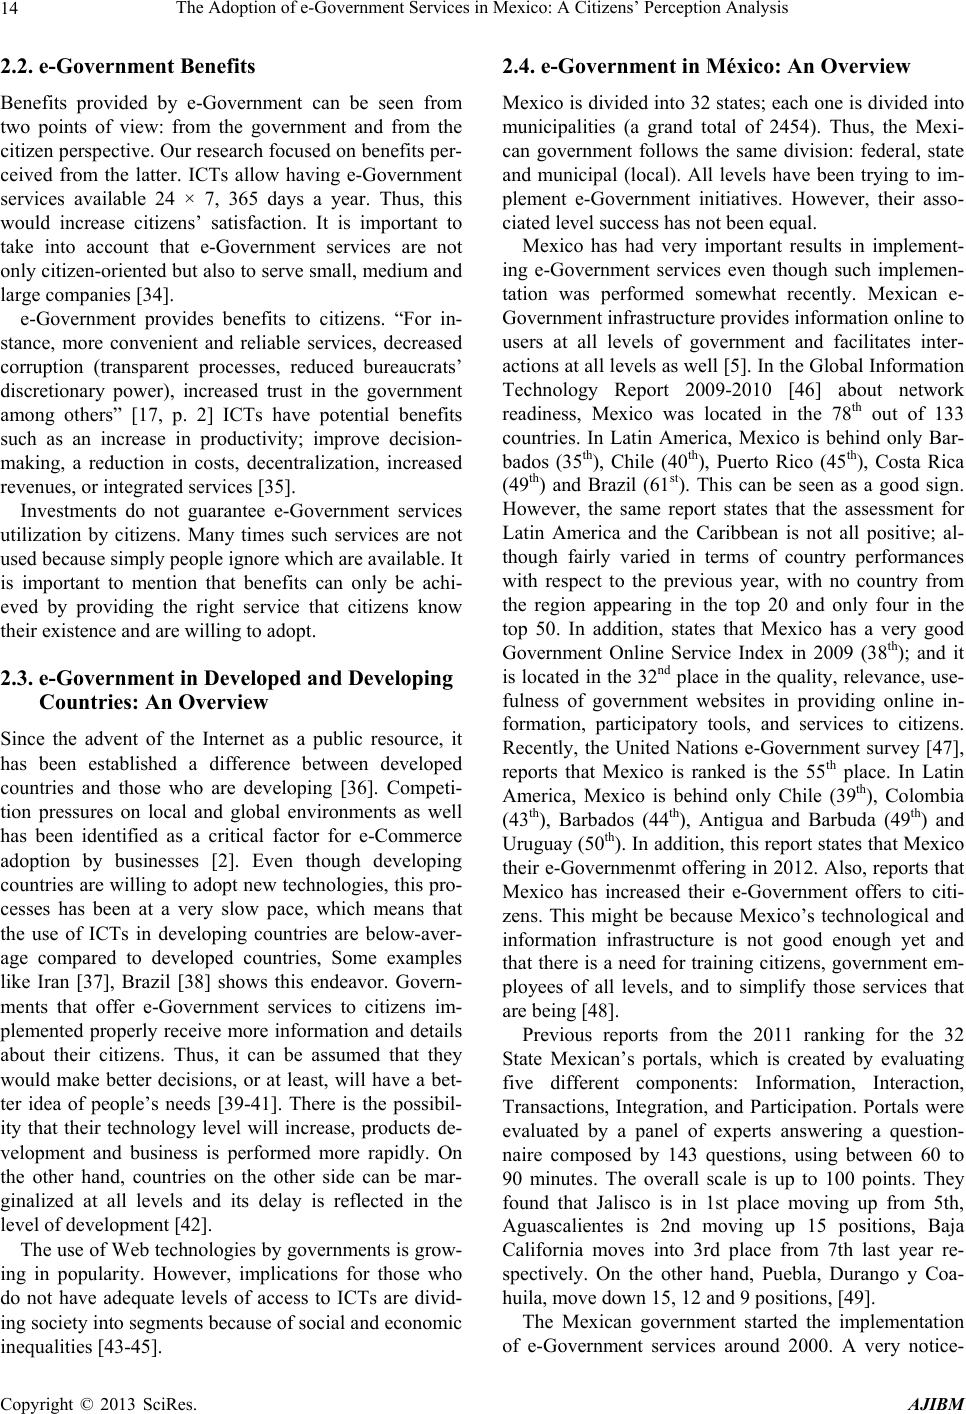 The Adoption of e-Government Services in Mexico: A Citizens’ Perception Analysis 14 2.2. e-Government Benefits Benefits provided by e-Government can be seen from two points of view: from the government and from the citizen perspective. Our resear ch focused on benef its per- ceived from the latter. ICTs allow having e-Government services available 24 × 7, 365 days a year. Thus, this would increase citizens’ satisfaction. It is important to take into account that e-Government services are not only citizen-oriented but also to serv e small, medium and large companies [34]. e-Government provides benefits to citizens. “For in- stance, more convenient and reliable services, decreased corruption (transparent processes, reduced bureaucrats’ discretionary power), increased trust in the government among others” [17, p. 2] ICTs have potential benefits such as an increase in productivity; improve decision- making, a reduction in costs, decentralization, increased revenues, or integrated services [35]. Investments do not guarantee e-Government services utilization by citizens. Many times such services are not used because simply people ignore which are available. It is important to mention that benefits can only be achi- eved by providing the right service that citizens know their existence and are willing to adopt. 2.3. e-Government in Developed and Developing Countries: An Overview Since the advent of the Internet as a public resource, it has been established a difference between developed countries and those who are developing [36]. Competi- tion pressures on local and global environments as well has been identified as a critical factor for e-Commerce adoption by businesses [2]. Even though developing countries are willing to adopt new techn ologies, this pro- cesses has been at a very slow pace, which means that the use of ICTs in developing countries are below-aver- age compared to developed countries, Some examples like Iran [37], Brazil [38] shows this endeavor. Govern- ments that offer e-Government services to citizens im- plemented properly receive more information and details about their citizens. Thus, it can be assumed that they would make better decisions, or at least, will have a bet- ter idea of people’s needs [39-41]. There is the possibil- ity that their technology level will increase, products de- velopment and business is performed more rapidly. On the other hand, countries on the other side can be mar- ginalized at all levels and its delay is reflected in the level of development [42]. The use of Web technologies by governments is grow- ing in popularity. However, implications for those who do not have adequate levels of access to ICTs are divid- ing society into segments because of social and economic inequalities [43-45]. 2.4. e-Government in México: An Overview Mexico is divided into 32 states; each one is divided into municipalities (a grand total of 2454). Thus, the Mexi- can government follows the same division: federal, state and municipal (local). All levels have been trying to im- plement e-Government initiatives. However, their asso- ciated level success has not been equal. Mexico has had very important results in implement- ing e-Government services even though such implemen- tation was performed somewhat recently. Mexican e- Government infrastructure provides information online to users at all levels of government and facilitates inter- actions at all levels as well [5]. In th e Global Information Technology Report 2009-2010 [46] about network readiness, Mexico was located in the 78th out of 133 countries. In Latin America, Mexico is behind only Bar- bados (35th), Chile (40th), Puerto Rico (45th), Costa Rica (49th) and Brazil (61st). This can be seen as a good sign. However, the same report states that the assessment for Latin America and the Caribbean is not all positive; al- though fairly varied in terms of country performances with respect to the previous year, with no country from the region appearing in the top 20 and only four in the top 50. In addition, states that Mexico has a very good Government Online Service Index in 2009 (38th); and it is located in the 32nd place in the quality, relevance, use- fulness of government websites in providing online in- formation, participatory tools, and services to citizens. Recently, the United Nations e-Government survey [47], reports that Mexico is ranked is the 55th place. In Latin America, Mexico is behind only Chile (39th), Colombia (43th), Barbados (44th), Antigua and Barbuda (49th) and Uruguay (50th). In addition, this rep ort states that Mexico their e-Governmenmt offering in 2012. Also, reports that Mexico has increased their e-Government offers to citi- zens. This might be because Mexico’s technological and information infrastructure is not good enough yet and that there is a need for training citizens, government em- ployees of all levels, and to simplify those services that are being [48]. Previous reports from the 2011 ranking for the 32 State Mexican’s portals, which is created by evaluating five different components: Information, Interaction, Transactions, Integration, and Participation. Portals were evaluated by a panel of experts answering a question- naire composed by 143 questions, using between 60 to 90 minutes. The overall scale is up to 100 points. They found that Jalisco is in 1st place moving up from 5th, Aguascalientes is 2nd moving up 15 positions, Baja California moves into 3rd place from 7th last year re- spectively. On the other hand, Puebla, Durango y Coa- huila, move down 15, 12 and 9 pos itions, [49]. The Mexican government started the implementation of e-Government services around 2000. A very notice- Copyright © 2013 SciRes. AJIBM  The Adoption of e-Government Services in Mexico: A Citizens’ Perception Analysis 15 able progress has been made in both, implementation and adoption of such services. However, previous literature does not report many research conducted in Mexican e-Government services. Thus, we believe there is a need to identify Mexicans’ perception about the adoption of e-Government services. The following sections describe briefly some effects of e- Government projects. 2.5. Federal Level Some Mexican research has been focused in very narrow aspects of e-Government implementations. For example, focused in classifying and describing e-Government [36, 50,51]. Past research on e-government [11] argues that there is a need for identifying what are the critical factors that determine these portals functionality. Further re- search states that the absence of e-Government models for the Mexican context presents a big hurdle for taking very good decisions regarding what citizens are de- manding from the government [48]. Past research [52] argues that in Mexico e-Govern- ment developments are more a political policy rather than a technical issue. In addition, they mention that strategic, tactic and operative levels are adapted depend- ing on each institution needs. Past research [11] states that e-Government po rtal attributes such as functionality, design, and available services have a strong relationship with expected outcomes. In addition, [53] argue that the Mexican e-Government strategy includes state and local levels as well, which is seen as a means to ensure that all Mexicans to exercise their right to be informed and to access offered services by the government at all levels, federal, regional, state and municipal. 2.6. State Level Government’s portals are just one of many examples of e-Government. These applications are developed because citizens demand the same services that are being pro- vided to private organizations; and because perceived potential benefits such as cost reductions, enhanced effi- ciency, improved quality of service, improved transpar- ency, better decision-making process and the ability to create communities [54]. e-Government portals success is determined by factors such as demand for electronic services and by organizational processes and structures in charge of the ICTs in each Mexican state [11]. Other research argues that the introduction of e-Gov- ernment portals has the potential demand for an organ- izational change within the government [11 ]. In addition, he states that these changes intend to offer new services, or because the availability of new resources intended for making an easier way of work for government executives. The Mexican efforts intend to build its own model, un- derstanding from other e-government implementation abroad [36,51]. However, Mexican states are not coordi- nating their e-Government initiatives or following a unique policy for such efforts. 2.7. Municipal (Local) Past research argue that many local governments in Mexico do not have the basic infrastructure for develop- ing a digital government strategy [55]. Past research [53] found that only 360 Mexican municipalities are consid- ered moderately or highly technologically prepared, which ICT is located in the organizational chart as a strategic, not operational. The closest relationship be- tween the government and citizens is through munici- palities. However, there have been few efforts to analyze the impact of e-Government at this first level of [48]. “Local government IT departments have limited influ- ence on the main government strategies and they do not have the appropriate organizational structure, trained staff, or budget to manage a digital government strategy” [49, p. 2]. In addition, argue that the lack of resources available to local governments and their municipal CIOs is a problem in Mexico. Thus, it is highly lik ely that lo cal governments often fail to achieve the objectives for the e-Government initiative. Sandoval-Almazán and Colin [48] conducted a re- search in 518 Mexican municipalities’ e-Government websites. They analyzed several aspects of such applica- tions. They found that 89.27% of such applications do not have at least one security mechanism; this might be because most of them do not offer on-line payments. Regarding technology, 78.81% are below average even though the availability of many technologies nowadays. Another aspect evaluated is maturity; they found that at least 57.33% of the municipalities have the opportunity for delivering services that are citizen-oriented. In addi- tion, their data show that most municipaliti es are making a poor use of IT government openness, web design and Web 2.0 too ls; also, se r vices offered are not what citizens really need. In summary, e-Government applications have deliv- ered very good outcomes not without demanding great investments and addressing many problems. However, not all governments have been able to exploit such tech- nology to its full potential, especially in developing countries such as Mexico. 3. Methodology According with the described background, several hy- potheses were tested for the present research in order to provide evidence of the citizen perspective on e-govern- ment implementation in Mexico. Such hypotheses are based on Kumar’s model [1] and they are defined as fol- lows: Copyright © 2013 SciRes. AJIBM 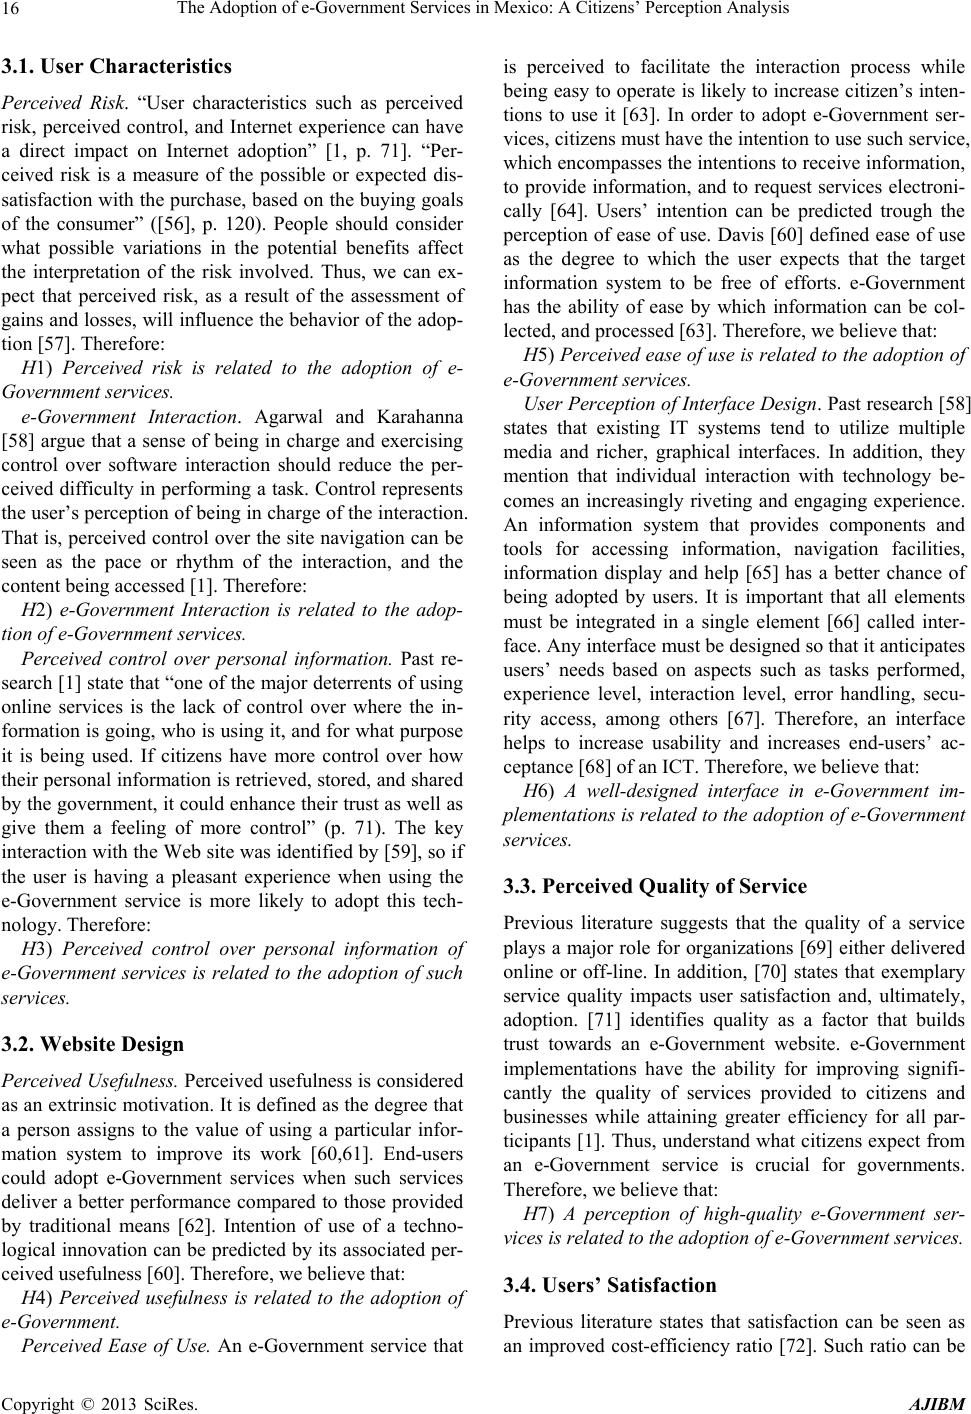 The Adoption of e-Government Services in Mexico: A Citizens’ Perception Analysis 16 3.1. User Characteristics Perceived Risk. “User characteristics such as perceived risk, perceived control, and Internet experience can have a direct impact on Internet adoption” [1, p. 71]. “Per- ceived risk is a measure of the possible or expected dis- satisfaction with the purchase, based on the buying goals of the consumer” ([56], p. 120). People should consider what possible variations in the potential benefits affect the interpretation of the risk involved. Thus, we can ex- pect that perceived risk, as a result of the assessment of gains and losses, will influence the behav ior of the adop- tion [57]. Therefore: H1) Perceived risk is related to the adoption of e- Government services. e-Government Interaction. Agarwal and Karahanna [58] argue that a sense of being in charge and exercising control over software interaction should reduce the per- ceived difficulty in performing a task. Control represen ts the user’s perception of being in charg e of the interaction. That is, perceived control over the site navigation can be seen as the pace or rhythm of the interaction, and the content being accessed [1]. Therefore: H2) e-Government Interaction is related to the adop- tion of e-Government services. Perceived control over personal information. Past re- search [1] state that “one of the major deterrents of using online services is the lack of control over where the in- formation is going, who is using it, an d for what purpose it is being used. If citizens have more control over how their personal information is retrieved, stored, and shared by the government, it could enhance their trust as well as give them a feeling of more control” (p. 71). The key interaction with the Web site was identified by [59], so if the user is having a pleasant experience when using the e-Government service is more likely to adopt this tech- nology. Therefore: H3) Perceived control over personal information of e-Government services is related to the adoption of such services. 3.2. Website Design Perceived Usefulness. Perceived usefulness is considered as an extrinsic motivation. It is defined as the degree that a person assigns to the value of using a particular infor- mation system to improve its work [60,61]. End-users could adopt e-Government services when such services deliver a better performance compared to those provided by traditional means [62]. Intention of use of a techno- logical innovation can be predicted by its associated per- ceived usefuln ess [60] . Therefore, we believe that: H4) Perceived usefulness is related to the adoption of e-Government. Perceived Ease of Use. An e-Government service that is perceived to facilitate the interaction process while being easy to operate is likely to increase citizen’s inten- tions to use it [63]. In order to adopt e-Government ser- vices, citizens must have the intention to use such service, which encompasses the intentions to receive information, to provide information, and to request services electroni- cally [64]. Users’ intention can be predicted trough the perception of ease of use. Davis [60] defined ease of use as the degree to which the user expects that the target information system to be free of efforts. e-Government has the ability of ease by which information can be col- lected, and processed [63]. Therefore, we believe that: H5) Perceived ease of use is related to the adoption of e-Government services. User Perception of Interface Design. Past research [58] states that existing IT systems tend to utilize multiple media and richer, graphical interfaces. In addition, they mention that individual interaction with technology be- comes an increasingly riveting and engaging experience. An information system that provides components and tools for accessing information, navigation facilities, information display and help [65] has a better chance of being adopted by users. It is important that all elements must be integrated in a single element [66] called inter- face. Any interface must be designed so that it anticipates users’ needs based on aspects such as tasks performed, experience level, interaction level, error handling, secu- rity access, among others [67]. Therefore, an interface helps to increase usability and increases end-users’ ac- ceptance [68] of an ICT. Therefore, we believe that: H6) A well-designed interface in e-Government im- plementations is related to the adoption of e-Government services. 3.3. Perceived Quality of Service Previous literature suggests that the quality of a service plays a major role for organizations [69] either delivered online or off-line. In addition, [70] states that exemplary service quality impacts user satisfaction and, ultimately, adoption. [71] identifies quality as a factor that builds trust towards an e-Government website. e-Government implementations have the ability for improving signifi- cantly the quality of services provided to citizens and businesses while attaining greater efficiency for all par- ticipants [1]. Thus, understand what citizens expect from an e-Government service is crucial for governments. Therefore, we believe that: H7) A perception of high-quality e-Government ser- vices is related to the adop tion of e-Government services. 3.4. Users’ Satisfaction Previous literature states that satisfaction can be seen as an improved cost-efficiency ratio [72]. Such ratio can be Copyright © 2013 SciRes. AJIBM 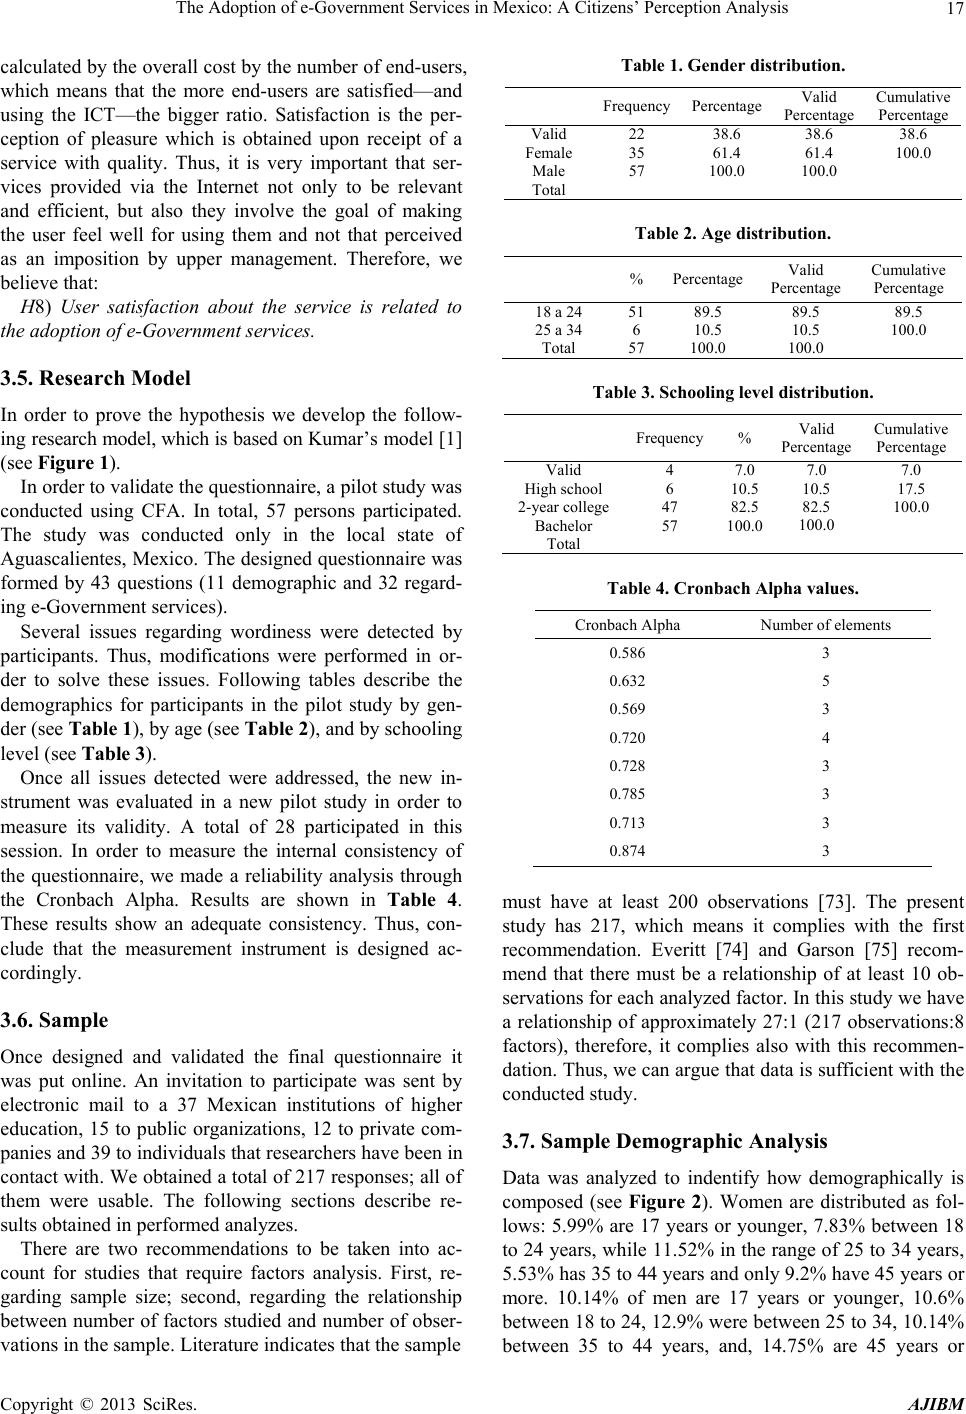 The Adoption of e-Government Services in Mexico: A Citizens’ Perception Analysis 17 calculated by the overall cost by the number of end-users, which means that the more end-users are satisfied—and using the ICT—the bigger ratio. Satisfaction is the per- ception of pleasure which is obtained upon receipt of a service with quality. Thus, it is very important that ser- vices provided via the Internet not only to be relevant and efficient, but also they involve the goal of making the user feel well for using them and not that perceived as an imposition by upper management. Therefore, we believe that: H8) User satisfaction about the service is related to the adoption of e-Government services. 3.5. Research Model In order to prove the hypothesis we develop the follow- ing r esearch model, which is based on Kumar ’ s mo de l [ 1 ] (see Figure 1). In order to validate the questionnaire, a pilo t study was conducted using CFA. In total, 57 persons participated. The study was conducted only in the local state of Aguascalientes, Mexico. The designed questionnaire was formed by 43 questions (11 demographic and 32 regard- ing e-Government services). Several issues regarding wordiness were detected by participants. Thus, modifications were performed in or- der to solve these issues. Following tables describe the demographics for participants in the pilot study by gen- der (see Table 1), by age (see Table 2), and by schoo ling level (see Table 3). Once all issues detected were addressed, the new in- strument was evaluated in a new pilot study in order to measure its validity. A total of 28 participated in this session. In order to measure the internal consistency of the questionnaire, we made a reliability analysis through the Cronbach Alpha. Results are shown in Table 4. These results show an adequate consistency. Thus, con- clude that the measurement instrument is designed ac- cordingly. 3.6. Sample Once designed and validated the final questionnaire it was put online. An invitation to participate was sent by electronic mail to a 37 Mexican institutions of higher education, 15 to public organizations, 12 to private com- panies and 39 to individuals that researchers have been in contact with. We obtained a total of 217 responses; all of them were usable. The following sections describe re- sults obtained in performed analyzes. There are two recommendations to be taken into ac- count for studies that require factors analysis. First, re- garding sample size; second, regarding the relationship between number of factors studied and number of obser- vations in the sample. Literature indicates that th e sample Table 1. Gender distribution. FrequencyPercentage Valid Percentage Cumulative Percentage Valid Female Male Total 22 35 57 38.6 61.4 100.0 38.6 61.4 100.0 38.6 100.0 Table 2. Age distribution. %Percentage Valid Percentage Cumulative Percentage 18 a 24 25 a 34 Total 51 6 57 89.5 10.5 100.0 89.5 10.5 100.0 89.5 100.0 Table 3. Schooling level distribution. Frequency% Valid Percentage Cumulative Percentage Valid High school 2-year college Bachelor Total 4 6 47 57 7.0 10.5 82.5 100.0 7.0 10.5 82.5 100.0 7.0 17.5 100.0 Table 4. Cronbach Alpha values. Cronbach Alpha Number of elements 0.586 3 0.632 5 0.569 3 0.720 4 0.728 3 0.785 3 0.713 3 0.874 3 must have at least 200 observations [73]. The present study has 217, which means it complies with the first recommendation. Everitt [74] and Garson [75] recom- mend that there must be a relationship of at least 10 ob- servations for each analyzed factor. In this study we have a relationship of approximately 27:1 (217 observations:8 factors), therefore, it complies also with this recommen- dation. Thus, we can argue that data is sufficien t with the conducted study. 3.7. Sample Demographic Analysis Data was analyzed to indentify how demographically is composed (see Figure 2). Women are distributed as fol- lows: 5.99% are 17 years or younger, 7.83% between 18 to 24 years, while 11.52% in the rang e of 25 to 34 years, 5.53% has 35 to 44 years and only 9.2% have 45 years or more. 10.14% of men are 17 years or younger, 10.6% between 18 to 24, 12.9% were between 25 to 34, 10.14% between 35 to 44 years, and, 14.75% are 45 years or Copyright © 2013 SciRes. AJIBM 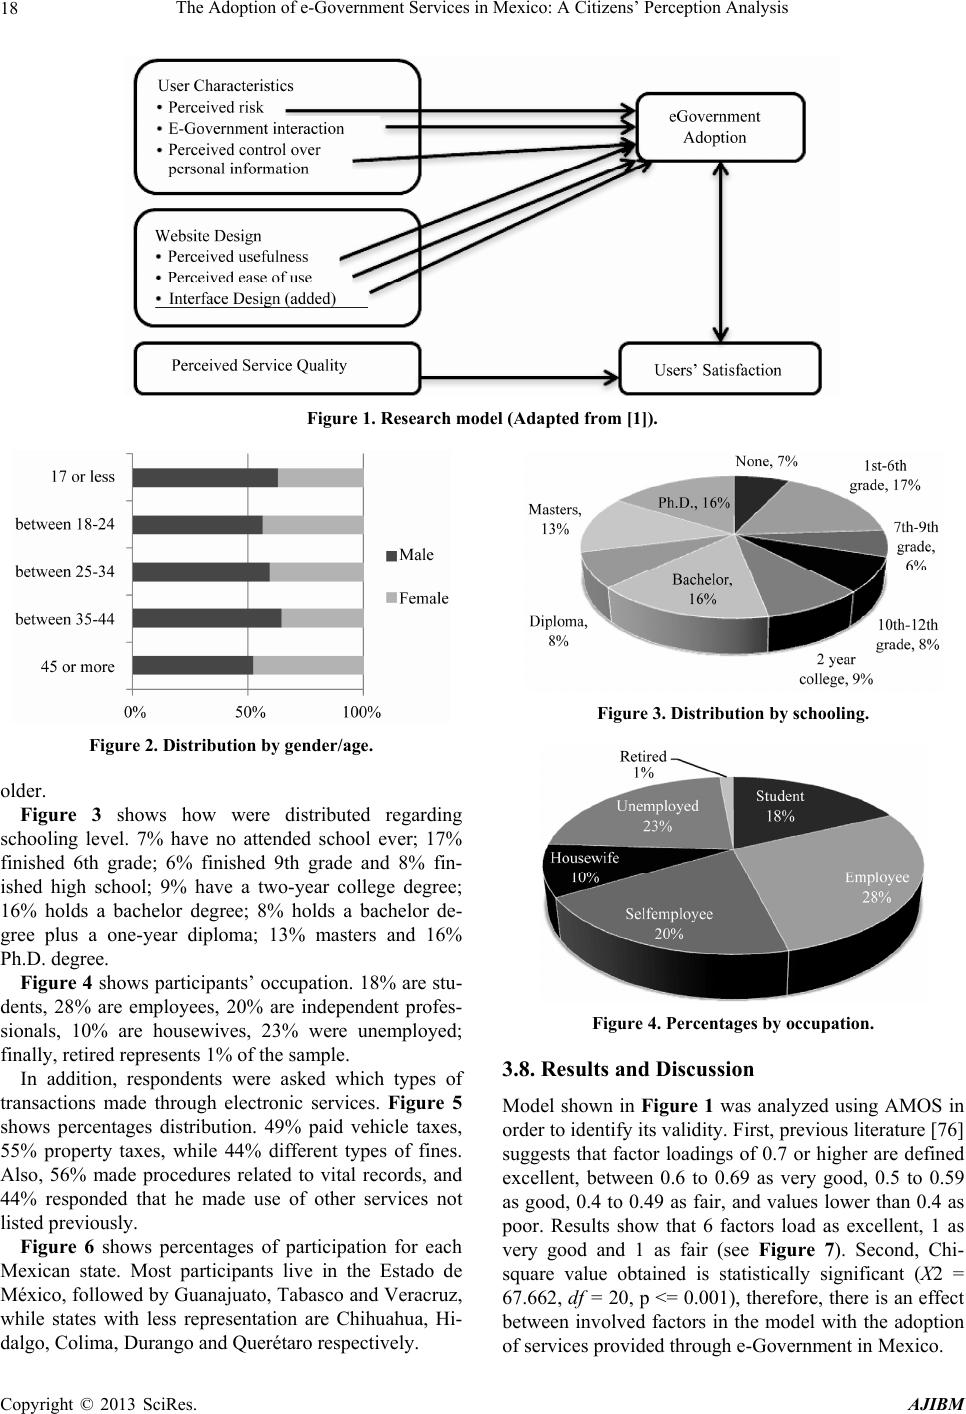 The Adoption of e-Government Services in Mexico: A Citizens’ Perception Analysis Copyright © 2013 SciRes. AJIBM 18 Figure 1. Research model (Adapted from [1]). Figure 3. Distribution by schooling. Figure 2. Distribution by gender /age. older. Figure 3 shows how were distributed regarding schooling level. 7% have no attended school ever; 17% finished 6th grade; 6% finished 9th grade and 8% fin- ished high school; 9% have a two-year college degree; 16% holds a bachelor degree; 8% holds a bachelor de- gree plus a one-year diploma; 13% masters and 16% Ph.D. deg ree. Figure 4 shows participants’ occupation . 18% are stu- dents, 28% are employees, 20% are independent profes- sionals, 10% are housewives, 23% were unemployed; finally, retired represents 1% of the sample. Figure 4. Percentages by occupation. 3.8. Results and Discussion In addition, respondents were asked which types of transactions made through electronic services. Figure 5 shows percentages distribution. 49% paid vehicle taxes, 55% property taxes, while 44% different types of fines. Also, 56% made procedures related to vital records, and 44% responded that he made use of other services not listed previously. Model shown in Figure 1 was analyzed using AMOS in order to identify its v alid ity. First, previou s literature [7 6] suggests that factor loadings of 0.7 or higher are defined excellent, between 0.6 to 0.69 as very good, 0.5 to 0.59 as good, 0.4 to 0.49 as fair, and values lower than 0.4 as poor. Results show that 6 factors load as excellent, 1 as very good and 1 as fair (see Figure 7). Second, Chi- square value obtained is statistically significant (X2 = 67.662, df = 20, p <= 0.001), therefore, there is an effect between involved factors in the model with the adoption of services provided through e-Government in Mexico. Figure 6 shows percentages of participation for each Mexican state. Most participants live in the Estado de México, followed by Guanajuato, Tabasco and Veracruz, while states with less representation are Chihuahua, Hi- dalgo, Colima, Durango and Querétaro respectively.  The Adoption of e-Government Services in Mexico: A Citizens’ Perception Analysis 19 Figure 5. e-Government services used by respondents. Figure 6. Number of respondents for Mexican state. Figure 7. Results of model analysis. Copyright © 2013 SciRes. AJIBM 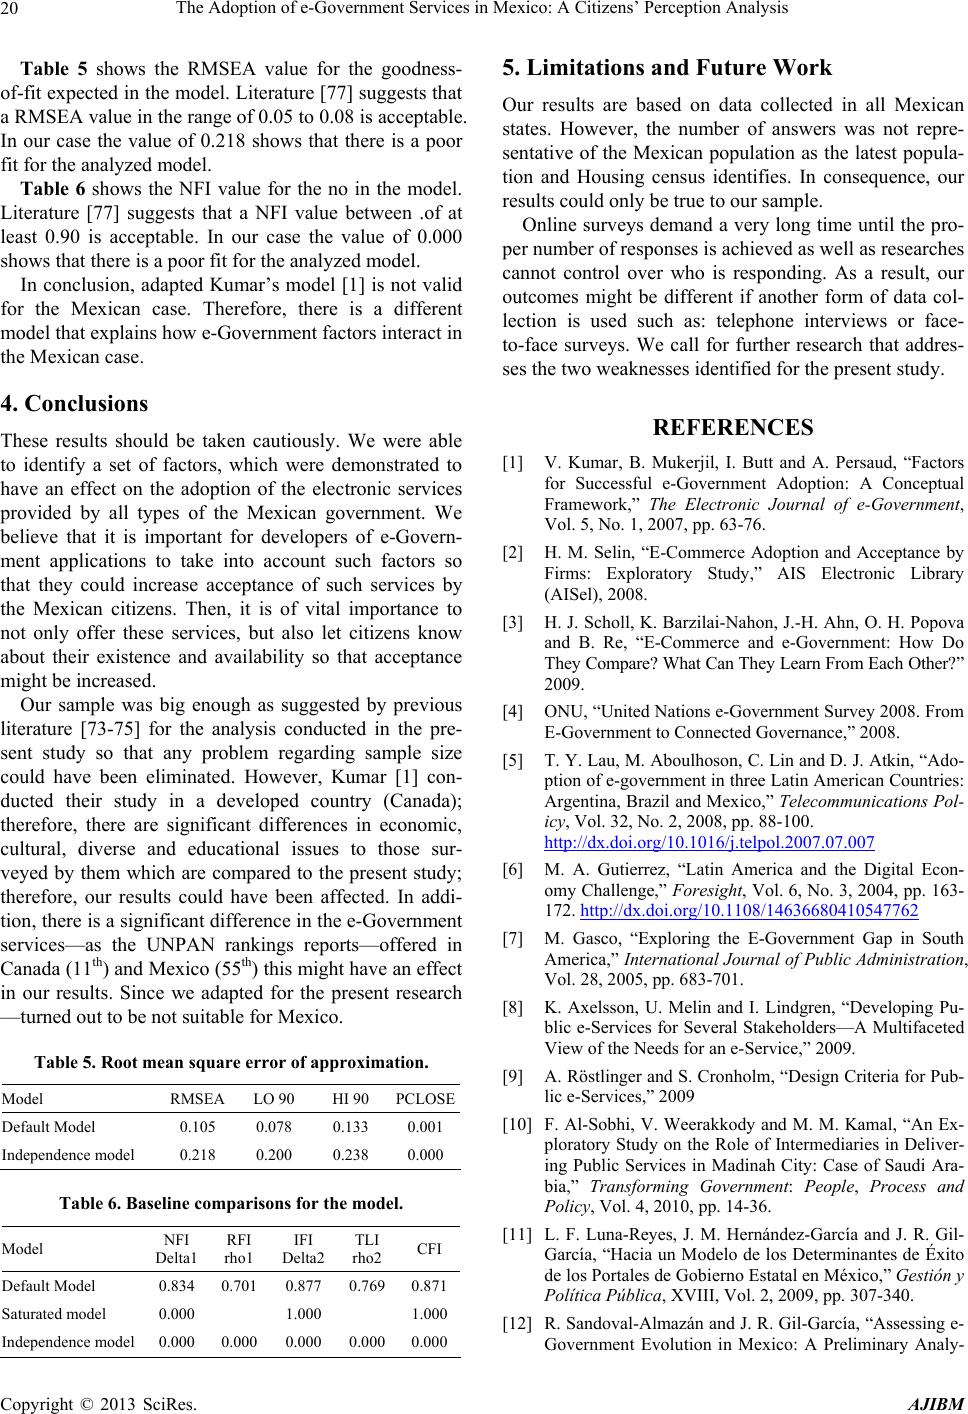 The Adoption of e-Government Services in Mexico: A Citizens’ Perception Analysis 20 Table 5 shows the RMSEA value for the goodness- of-fit expected in the model. Literature [77 ] suggests that a RMSEA value in the range of 0.05 to 0.08 is acceptable. In our case the value of 0.218 shows that there is a poor fit for the analyzed model. Table 6 shows the NFI value for the no in the model. Literature [77] suggests that a NFI value between .of at least 0.90 is acceptable. In our case the value of 0.000 shows that there is a poor fit for the analyzed model. In conclusion, adapted Kumar’s model [1] is not valid for the Mexican case. Therefore, there is a different model that explains how e-Government factors interact in the Mexican case. 4. Conclusions These results should be taken cautiously. We were able to identify a set of factors, which were demonstrated to have an effect on the adoption of the electronic services provided by all types of the Mexican government. We believe that it is important for developers of e-Govern- ment applications to take into account such factors so that they could increase acceptance of such services by the Mexican citizens. Then, it is of vital importance to not only offer these services, but also let citizens know about their existence and availability so that acceptance might be increased. Our sample was big enough as suggested by previous literature [73-75] for the analysis conducted in the pre- sent study so that any problem regarding sample size could have been eliminated. However, Kumar [1] con- ducted their study in a developed country (Canada); therefore, there are significant differences in economic, cultural, diverse and educational issues to those sur- veyed by them which are compared to the present study; therefore, our results could have been affected. In addi- tion, there is a significant difference in the e-Government services—as the UNPAN rankings reports—offered in Canada (11th) and Mexico (55th) this might have an effect in our results. Since we adapted for the present research —turned out to be not suitable for Mexico. Table 5. Root mean square error of approximation. Model RMSEA LO 90 HI 90 PCLOSE Default Model 0.105 0.078 0.133 0.001 Independence model 0.218 0.200 0.238 0.000 Table 6. Baseline comparisons for the model. Model NFI Delta1 RFI rho1 IFI Delta2 TLI rho2 CFI Default Model 0.834 0.701 0.877 0.7690.871 Saturated model 0.000 1.000 1.000 Independence model 0.000 0.000 0.000 0.0000.000 5. Limitations and Future Work Our results are based on data collected in all Mexican states. However, the number of answers was not repre- sentative of the Mexican population as the latest popula- tion and Housing census identifies. In consequence, our results could only be true to our sample. Online surveys demand a very long time until the pro - per number of responses is achieved as well as researches cannot control over who is responding. As a result, our outcomes might be different if another form of data col- lection is used such as: telephone interviews or face- to-face surveys. We call for further research that addres- ses the two weaknesses identified for the present study. REFERENCES [1] V. Kumar, B. Mukerjil, I. Butt and A. Persaud, “Factors for Successful e-Government Adoption: A Conceptual Framework,” The Electronic Journal of e-Government, Vol. 5, No. 1, 2007, pp. 63-76. [2] H. M. Selin, “E-Commerce Adoption and Acceptance by Firms: Exploratory Study,” AIS Electronic Library (AISel), 2008. [3] H. J. Scholl, K. Barzilai-Nahon, J.-H. Ahn, O. H. Popova and B. Re, “E-Commerce and e-Government: How Do They Compare? What Can They Learn From Each Other? ” 2009. [4] ONU, “United Nations e-Government Survey 2008. From E-Government to Connected Governance,” 2008. [5] T. Y. Lau, M. Aboulhoson, C. Lin and D. J. Atkin, “Ado- ption of e-government in three Latin American Countries: Argentina, Brazil and Mexico,” Telecommunications Pol- icy, Vol. 32, No. 2, 2008, pp. 88-100. http://dx.doi.org/10.1016/j.telpol.2007.07.007 [6] M. A. Gutierrez, “Latin America and the Digital Econ- omy Challenge,” Foresight, Vol. 6, No. 3, 2004, pp. 163- 172. http://dx.doi.org/10.1108/14636680410547762 [7] M. Gasco, “Exploring the E-Government Gap in South America,” International Journal of Public Administration, Vol. 28, 2005, pp. 683-701. [8] K. Axelsson, U. Melin and I. Lindgren, “Developing Pu- blic e-Services for Several Stakeholders—A Multifaceted View of the Needs for an e-Service,” 2009. [9] A. Röstlinger and S. Cronholm, “Design Criteria for Pub- lic e-Services,” 2009 [10] F. Al-Sobhi, V. Weerakkody and M. M. Kamal, “An Ex- ploratory Study on the Role of Intermediaries in Deliver- ing Public Services in Madinah City: Case of Saudi Ara- bia,” Transforming Government: People, Process and Policy, Vol. 4, 2010, pp. 14-36. [11] L. F. Luna-Reyes, J. M. Hernández-García and J. R. Gil- García, “Hacia un Modelo de los Determinantes de Éxito de los Portales de Gobierno Estatal en México,” Gestión y Política Pública, XVIII, Vol. 2, 2009, pp. 307-340. [12] R. Sandoval-Almazán and J. R. Gil-García, “Assessing e- Government Evolution in Mexico: A Preliminary Analy- Copyright © 2013 SciRes. AJIBM 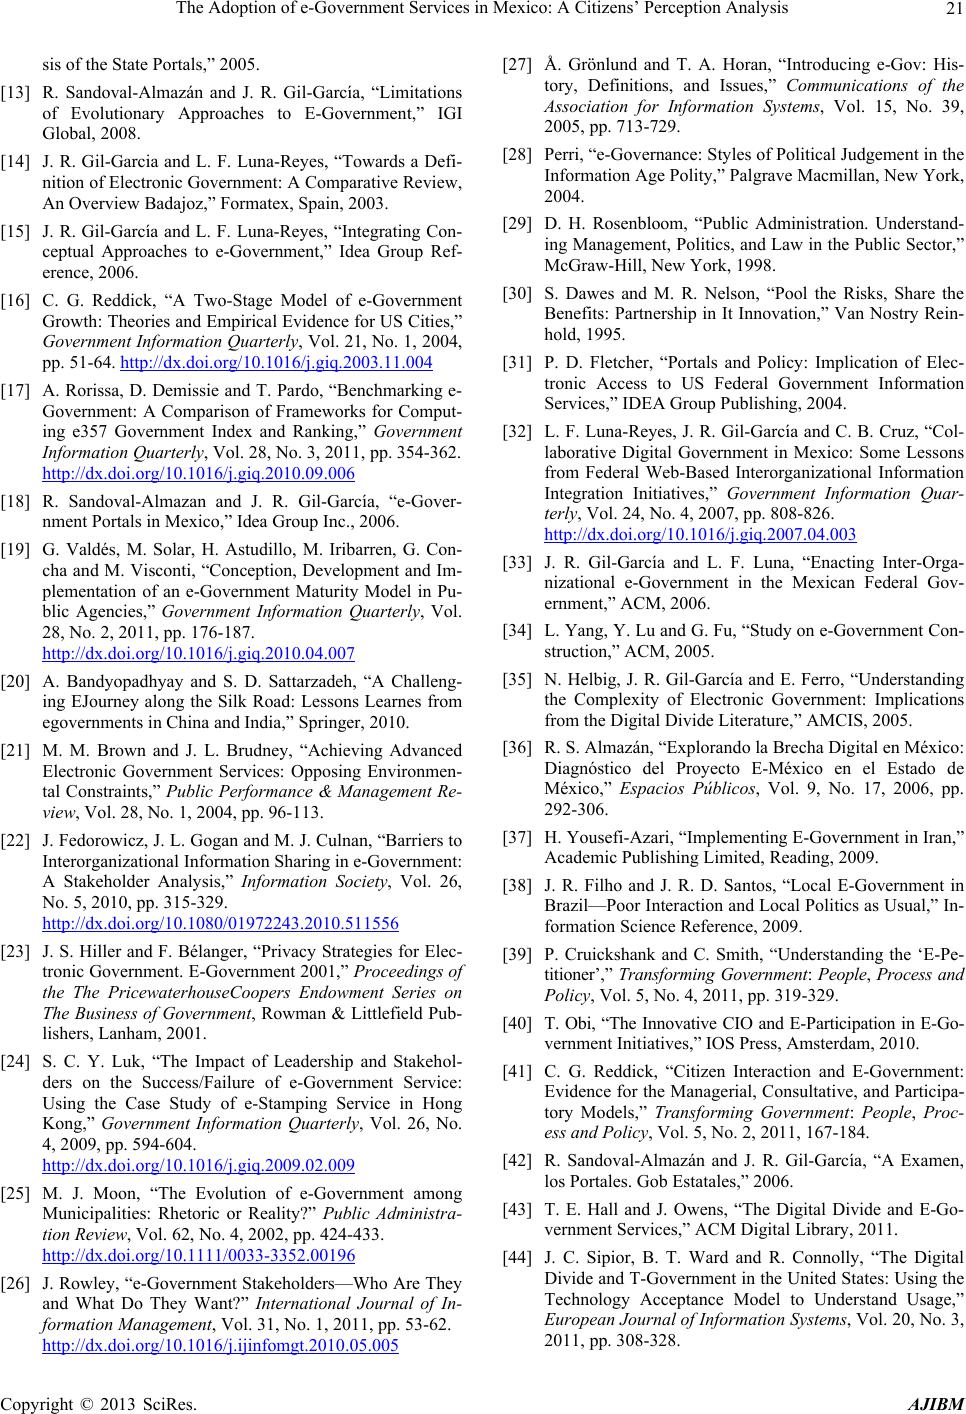 The Adoption of e-Government Services in Mexico: A Citizens’ Perception Analysis 21 sis of the State Portals,” 2005. [13] R. Sandoval-Almazán and J. R. Gil-García, “Limitations of Evolutionary Approaches to E-Government,” IGI Global, 2008. [14] J. R. Gil-Garcia and L. F. Luna-Reyes, “Towards a Defi- nition of Electronic Government: A Comparative Review, An Overview Badajoz,” Formatex, Spain, 2003. [15] J. R. Gil-García and L. F. Luna-Reyes, “Integrating Con- ceptual Approaches to e-Government,” Idea Group Ref- erence, 2006. [16] C. G. Reddick, “A Two-Stage Model of e-Government Growth: Theories and Empirical Evidence for US Cities,” Government Information Quarterly, Vol. 21, No. 1, 2004, pp. 51-64. http://dx.doi.org/10.1016/j.giq.2003.11.004 [17] A. Rorissa, D. Demissie and T. Pardo, “Benchmarking e- Government: A Comparison of Frameworks for Comput- ing e357 Government Index and Ranking,” Government Information Quarterly, Vol. 28, No. 3, 2011, pp. 354-362. http://dx.doi.org/10.1016/j.giq.2010.09.006 [18] R. Sandoval-Almazan and J. R. Gil-García, “e-Gover- nment Portals in Mexico,” Idea Group Inc., 2006. [19] G. Valdés, M. Solar, H. Astudillo, M. Iribarren, G. Con- cha and M. Visconti, “Conception, Development and Im- plementation of an e-Government Maturity Model in Pu- blic Agencies,” Government Information Quarterly, Vol. 28, No. 2, 2011, pp. 176-187. http://dx.doi.org/10.1016/j.giq.2010.04.007 [20] A. Bandyopadhyay and S. D. Sattarzadeh, “A Challeng- ing EJourney along the Silk Road: Lessons Learnes from egovernments in China and India,” Springer, 2010. [21] M. M. Brown and J. L. Brudney, “Achieving Advanced Electronic Government Services: Opposing Environmen- tal Constraints,” Public Performance & Management Re- view, Vol. 28, No. 1, 2004, pp. 96-113. [22] J. Fedorowicz, J. L. Gogan and M. J. Culnan, “Barriers to Interorganizational Information Sharing in e-Government: A Stakeholder Analysis,” Information Society, Vol. 26, No. 5, 2010, pp. 315-329. http://dx.doi.org/10.1080/01972243.2010.511556 [23] J. S. Hiller and F. Bélanger, “Privacy Strategies for Elec- tronic Government. E-Government 2001,” Proceedings of the The PricewaterhouseCoopers Endowment Series on The Business of Government, Rowman & Littlefield Pub- lishers, Lanham, 2001. [24] S. C. Y. Luk, “The Impact of Leadership and Stakehol- ders on the Success/Failure of e-Government Service: Using the Case Study of e-Stamping Service in Hong Kong,” Government Information Quarterly, Vol. 26, No. 4, 2009, pp. 594-604. http://dx.doi.org/10.1016/j.giq.2009.02.009 [25] M. J. Moon, “The Evolution of e-Government among Municipalities: Rhetoric or Reality?” Public Administra- tion Review, Vol. 62, No. 4, 2002, pp. 424-433. http://dx.doi.org/10.1111/0033-3352.00196 [26] J. Rowley, “e-Gove rnment Stakeholders—Who Are They and What Do They Want?” International Journal of In- formation Management, Vol. 31, No. 1, 2011, pp. 53-62. http://dx.doi.org/10.1016/j.ijinfomgt.2010.05.005 [27] Å. Grönlund and T. A. Horan, “Introducing e-Gov: His- tory, Definitions, and Issues,” Communications of the Association for Information Systems, Vol. 15, No. 39, 2005, pp. 713-729. [28] Perri, “e-Governance: Styles of Political Judgement in the Information Age Polity,” Palgrave Macmillan, New York, 2004. [29] D. H. Rosenbloom, “Public Administration. Understand- ing Management, Politics, and Law in the Public Sector,” McGraw-Hill, New York, 1998. [30] S. Dawes and M. R. Nelson, “Pool the Risks, Share the Benefits: Partnership in It Innovation,” Van Nostry Rein- hold, 1995. [31] P. D. Fletcher, “Portals and Policy: Implication of Elec- tronic Access to US Federal Government Information Services,” IDEA Group Publishing, 2004. [32] L. F. Luna-Reyes, J. R. Gil-García and C. B. Cruz, “Col- laborative Digital Government in Mexico: Some Lessons from Federal Web-Based Interorganizational Information Integration Initiatives,” Government Information Quar- terly, Vol. 24, No. 4, 2007, pp. 808-826. http://dx.doi.org/10.1016/j.giq.2007.04.003 [33] J. R. Gil-García and L. F. Luna, “Enacting Inter-Orga- nizational e-Government in the Mexican Federal Gov- ernment,” ACM, 2006. [34] L. Yang, Y. Lu and G. Fu, “Study on e-Government Con- struction,” ACM, 2005. [35] N. Helbig, J. R. Gil-García and E. Ferro, “Understanding the Complexity of Electronic Government: Implications from the Digital Divide Literature,” AMCIS, 2005. [36] R. S. Almazán, “Explorando la Brecha Digital en México: Diagnóstico del Proyecto E-México en el Estado de México,” Espacios Públicos, Vol. 9, No. 17, 2006, pp. 292-306. [37] H. Yousefi-Azari, “Implementing E-Government in Iran,” Academic Publishing Limited, Reading, 2009. [38] J. R. Filho and J. R. D. Santos, “Local E-Government in Brazil—Poor Interaction and Local Politics as Usual,” In- formation Science Reference, 2009. [39] P. Cruickshank and C. Smith, “Understanding the ‘E-Pe- titioner’,” Transforming Government: People, Process and Policy, Vol. 5, No. 4, 2011, pp. 319-329. [40] T. Obi, “The Innovative CIO and E-Participation in E-Go- vernment Initiatives,” IOS Press, Amsterdam, 2010. [41] C. G. Reddick, “Citizen Interaction and E-Government: Evidence for the Managerial, Consultative, and Participa- tory Models,” Transforming Government: People, Proc- ess and Policy, Vol. 5, No. 2, 2011, 167-184. [42] R. Sandoval-Almazán and J. R. Gil-García, “A Examen, los Portales. Gob Estatales,” 2006. [43] T. E. Hall and J. Owens, “The Digital Divide and E-Go- vernment Services,” ACM Digital Library, 2011. [44] J. C. Sipior, B. T. Ward and R. Connolly, “The Digital Divide and T-Government in the United States: Using the Technology Acceptance Model to Understand Usage,” European Journal of Information Systems, Vol. 20, No. 3, 2011, pp. 308-328. Copyright © 2013 SciRes. AJIBM  The Adoption of e-Government Services in Mexico: A Citizens’ Perception Analysis Copyright © 2013 SciRes. AJIBM 22 [45] M. Williams and Y. Dwivedi, “The Influence of Demo- graphic Variables on Citizens’ Adoption of E-Govern- ment,” Americas Conference on Information Systems (AMCIS), Keystone, August 9-12, 2007, p. 309. [46] S. Dutta and I. Mia, “Global Information Report 2009- 2010. ICT for Sustainability,” World Economic Forum and INSEAD, 2010. [47] UNPAN, “United Nations E-Government Survey 2012,” 2012. [48] R. Sandoval-Almazán and J. M. Colin, “Gobierno Electró- nico en México: Una Exploración Municipal 2010,” 17th Americas Conference on Information Systems, Detroit, 4-8 August 2011, p. 447. [49] L. F. Luna-Reyes, J. R. Gil-García and R. Sandoval-Al- mazán, “Ranking Estatal 2011 de Portales. Gob,” 2011. [50] L. J. Luna-Reyes, R. Gil-García and J. S. Rojas-Bandera, “An Exploratory Study of Electronic Government and State Portals in Mexico,” Idea Group Inc., 2007. [51] R. Sandoval-Almazán, J. R. Gil-García and L. F. Luna-Re- yes, “Ranking de Portales Estatales, la Medición 2007,” 2007. [52] S. H. Salas-Téllez and A. Arroyo-Sánchez, “Indicadores de Gobierno Electrónico en América Latina,” Proceed- ings of the International Congress of Information, La Ha- bana, , Vol. 3, pp. 88-107. [53] J. R. Gil-García, J. Mariscal-Avilés and F. Ramírez-Her- nández, “Gobierno Electrónico en México,” 2008. [54] J. R. Gil-García and N. Helbig, “Exploring E-Govern- ment Benefits and Success Factors,” Idea Group Inc., 2006. [55] L. F. Luna-Reyes, J. R. Gil-Garcia and C. Mansi, “Hacia un Modelo de Gobierno Electrónico a Nivel Municipal Para México: Reporte de Resultados de Talleres con Directores de Informática Municipales,” Universidad de las Américas Puebla-INFOTEC, Cholula, 2010. [56] G. Pires, J. Stanton and A. Eckfor, “Influences on the Perceived Risk of Purchasing Online,” Journal of Consu- mer Behaviour, Vol. 4, No. 12, 2006, pp. 118-131. [57] K. Kim and B. Prabhakar, “Initial Trust, Perceived Risk, and the Adoption of Internet Banking,” ICIS 2000 Pro- ceedings, 2000. [58] R. Agarwal and E. Karahanna, “Time Flies When You're Having Fun: Cognitive Absorption and Beliefs about In- formation Technology Usage,” MIS Quarterly, Vol. 24, No. 4, 2000, pp. 665-694. http://dx.doi.org/10.2307/3250951 [59] G. Wu, “Conceptualizing and Measuring the Perceived Interactivity of Websites,” Journal of Current Issues and Research in Advertising, Vol. 28, No. 1, 2006, pp. 87- 104. http://dx.doi.org/10.1080/10641734.2006.10505193 [60] F. D. Davis, “Perceived Usefulness, Perceived Ease of Use, and User Acceptance of Information Technology,” MIS Quarterly, Vol. 13, No. 3, 1989, pp. 319-340. [61] A. L. Lederer, D. J. Maupin, M. P. Sena and Y. L. Zhuang, “The Technology Acceptance Model and the World Wide Web,” Decision Support Systems, Vol. 29, No. 3, 2000, pp. 269-282. [62] C. Plana, N. Cerpa and P. B. Bro, “Bases Para la Creación de una Metodología de Adopción de Comercio Elec- trÓnico Para las Pymes Chilenas,” La Revista Facultad de Ingeniería—Universidad de Tarapacá, Vol. 14, No. 1, 2006, pp. 49-63. [63] M. Warkentin, D. Gefen, P. A. Pavlou and G. M. Rose, “Encouraging Ci tizen Adoption of E-Government by Buil- ding Trust,” Electronic Markets, Vol. 12, No. 3, 2002, pp. 157-162. http://dx.doi.org/10.1080/101967802320245929 [64] H. Al-Omari and A. Al-Omari, “Building an E-Govern- ment E-Trust Infrastructure,” American Journal of App- lied Sciences, Vol. 3, No. 11, 2006, pp. 2122-2130. http://dx.doi.org/10.3844/ajassp.2006.2122.2130 [65] W. Milheim, “Performance Support Systems: Guidelines for System Design and Integration,” Canadian Journal of Educational Communication, Vol. 21, No. 3, 1992, pp. 243-252. [66] M. Whiteside, L. Klonis, A. Frisbie, A. Whiteside and L. Snell, “Designing a Performance Support System to En- hance Instruction for Medical Students,” Journal of Me- dical Education Technologies, Vol. 8, 1992, pp. 20-24. [67] K. McGraw, “Selecting Appropriate Functionality and Technologies for EPSS,” Innovations in Education and Training International, Vol. 32, No. 1, 1995, pp. 13-22. [68] T. Acton, W. Golden and H. van der Heijden, “Effects of See-Through Interfaces on User Acceptance of Small-Sc- reen Information Systems,” 13th European Conference on Information Systems, Regensburg, 26-28 May 2005, pp. 1-11. [69] F. F. Reichheld and P. Schefter, “E-Loyalty: Your Secret Weapon on the Web,” Harvard Business Review, Vol. 78, No. 4, 2000, pp. 105-113. [70] F. F. Reichheld, R. G. Markey and C. Hopton, “E-Cus- tomer Loyalty—Applying the Traditional Rules of Busi- ness for Online Success,” European Business Journal, Vol. 12, No. 4, 2000, pp. 173-179. [71] J. Palmer, “Website Usability Design and Performance Metrics,” Information Systems Research, Vol. 13, No. 2 2002, pp. 151-167. http://dx.doi.org/10.1287/isre.13.2.151.88 [72] A. Tat-Kei Ho, “Reinventing Local Government and the E-Government Initiative,” Public Administration Review, Vol. 62, No. 4, 2002, pp. 434-444. http://dx.doi.org/10.1111/0033-3352.00197 [73] J. P. Guilford, “Psychometric Methods,” 2nd Edition, McGraw-Hill, New York, 1954. [74] B. S. Everitt, “Multivariate Analysis: The Need for Data, and Other Problems,” British Journal of Psychiatry, Vol. 126, 1975, pp. 237-240. [75] G. D. Garson, “Factor Analysis: Statnotes,” Public Ad- ministration Program, North Carolina State University, Raleigh, 2008. [76] A. L. Comrey and H. B. Lee, “A First Course in Factor Analysis,” Erlbaum, Hillsdale, 1992. [77] J. F. Hair, R. E. Anderson, R. L. Tatham and W. C. Black, “Multivariate Data Analysis,” 5th Edition, Prentice Hall, Upper Saddle River, 1998.
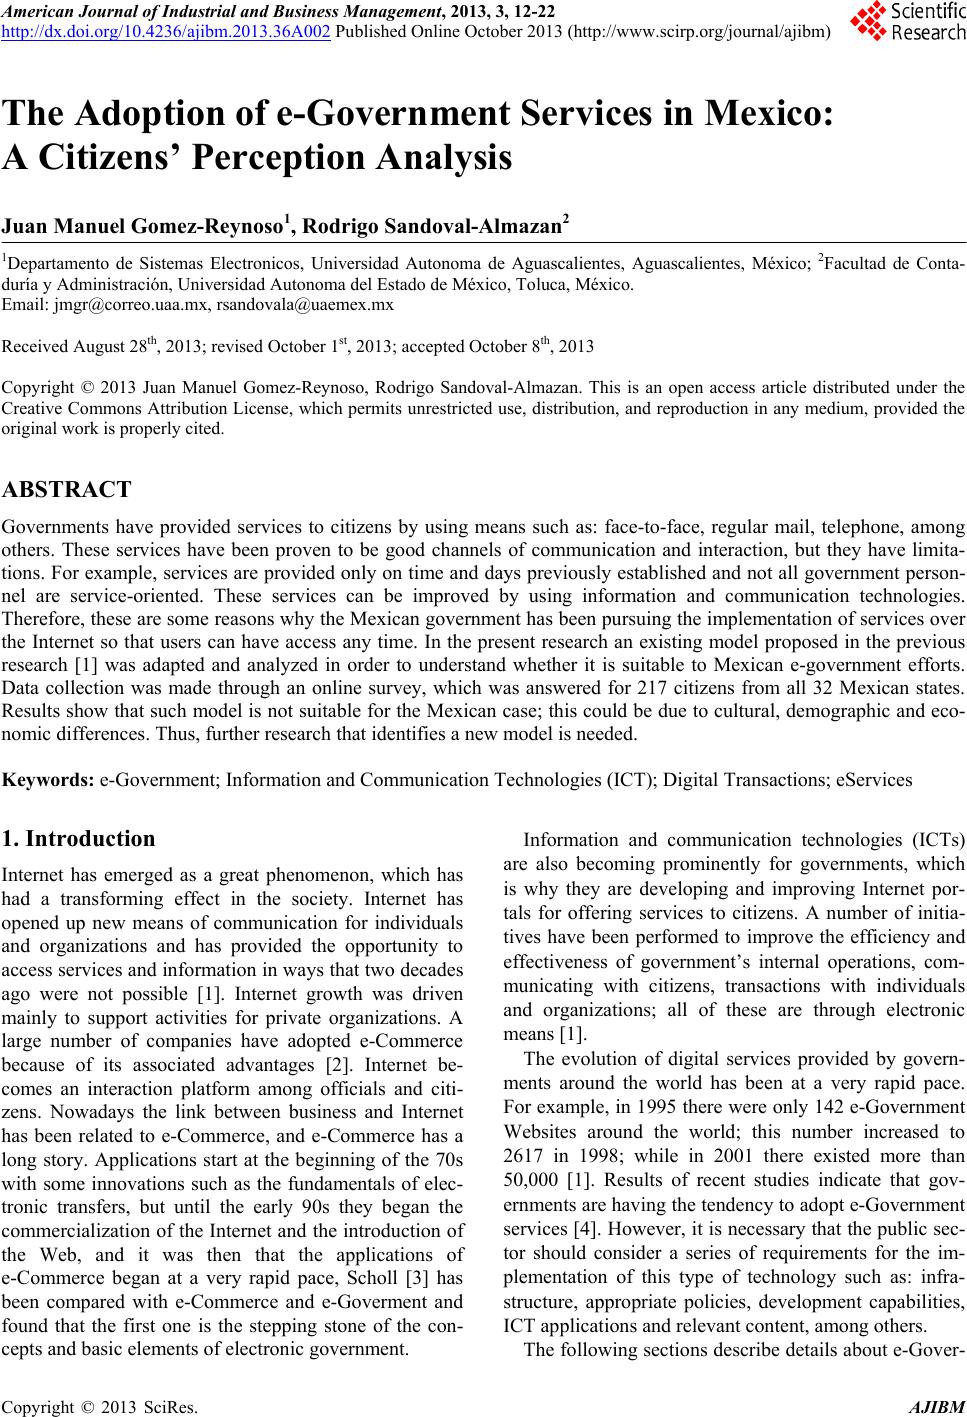
|