Thromboelastographic Profile of Patients with Hyperparathyroidism Secondary to
Chronic Kidney Failure Submitted to Total Parathyroidectomy—Case Series
364
by platelet function. The lysis index (Ly) is the determi-
nation of the lysis of the clot in time.
Thromboelastographic indices demonstrate that dif-
ferent coagulation aspects in the thromboelastographic
readout are altered in patients with chronic kidney failure,
including initial formation of fibrin (R), the fibrin-plate-
let interaction (K and α) and qualitative platelet function
(MA) [2]. There is also a reduction in fibrinolysis [2,5].
The mechanisms of the increase blood clotting in patients
with chronic kidney failure that lead to thrombotic com-
plications are less known and seem have a multi-factor
nature [3,4]. It has recently been demonstrated that pa-
tients with primary hyperparathyroidism and normal
kidney function have a hypercoagulable and hypofibri-
nolytic profile, which may contribute to an increased risk
of atherosclerotic and atherothrombotic complications
[8].
As patients with chronic kidney failure develop sec-
ondary hyperparathyroidism, the aim of the present study
was to describe a case series and correlate the periopera-
tive thromboelastographic profile of patients with chronic
kidney failure submitted to parathyroidectomy with their
secondary hyperparathyroidism.
2. Case Series
The case series involved 11 patients with chronic kidney
failure in dialysis treatment who were submitted to total
parathyroidectomy with a forearm implant of a fragment
of the parathyroid gland, with a mean surgical duration
of two hours. All patients had hyperparathyroidism sec-
ondary to kidney failure and signed a statement of in-
formed consent authorizing the collection of blood sam-
ples for perioperative laboratory exams and the publica-
tion of the findings. Regarding the etiology of chronic
kidney disease, four cases were due to glomerulonephri-
tis, two were due to polycystic kidneys, two were due to
diabetic hypertensive nephropathy, one was due to
nephrocalcinosis and two were due to hypertensive neph-
ropathy. Table 1 displays the demographic data and re-
sults of the preoperative laboratory exams.
All patients were submitted to balanced general anes-
thesia (sufentanil—0.5 μg/kg; propofol—2.5 mg/kg; atra-
curium—0.5 mg/kg; sevorane—1.5 CAM) and moni-
tored with continuous ECG, invasive blood pressure, pul-
se oximetry, gas analysis and capnography throughout
the surgery. Arterial blood samples were collected im-
mediately following anesthesia induction and at the end
of the surgery (prior to extubation) for gasometry, iono-
gram, erythrogram, coagulogram and thromboelastogra-
phy. The total intravenous volume administered during
surgery was 462.5 ± 50.42 mL.
Table 2 displays the results of the laboratory exams
and thromboelastogram of the patients in the intraopera-
tive period.
The MA and α angle of the thromboelastogram imme-
diately following anesthesia induction demonstrated a
pro-thrombotic profile (means above values considered
normal). In the comparison of laboratory exams after
anesthesia induction and prior to extubation, only the
number of platelets and ionic calcium underwent signifi-
cant reductions, but remained within the range of refer-
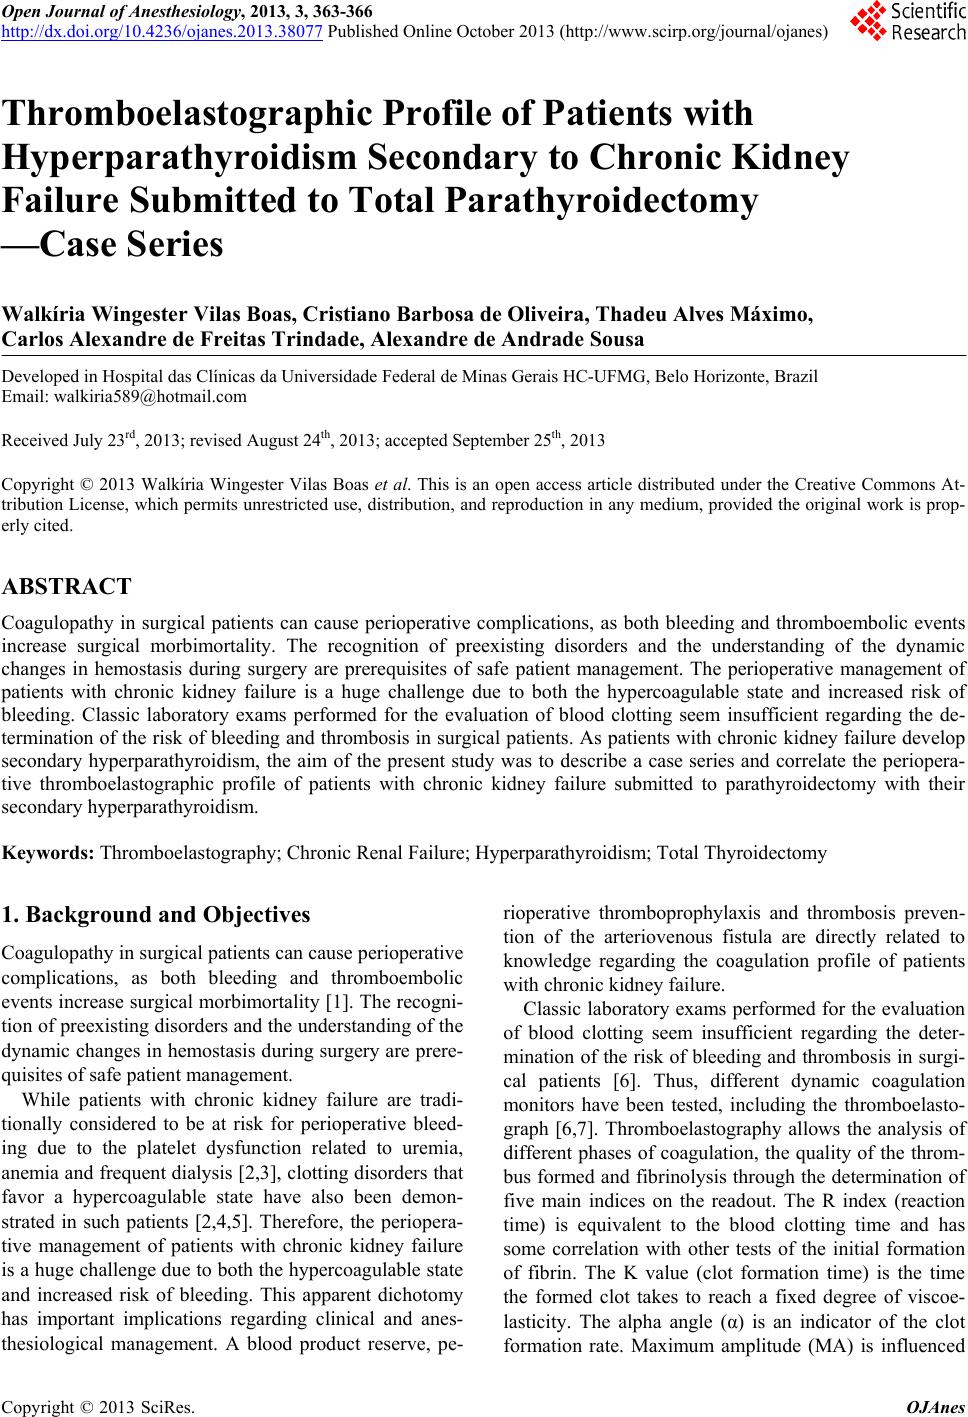
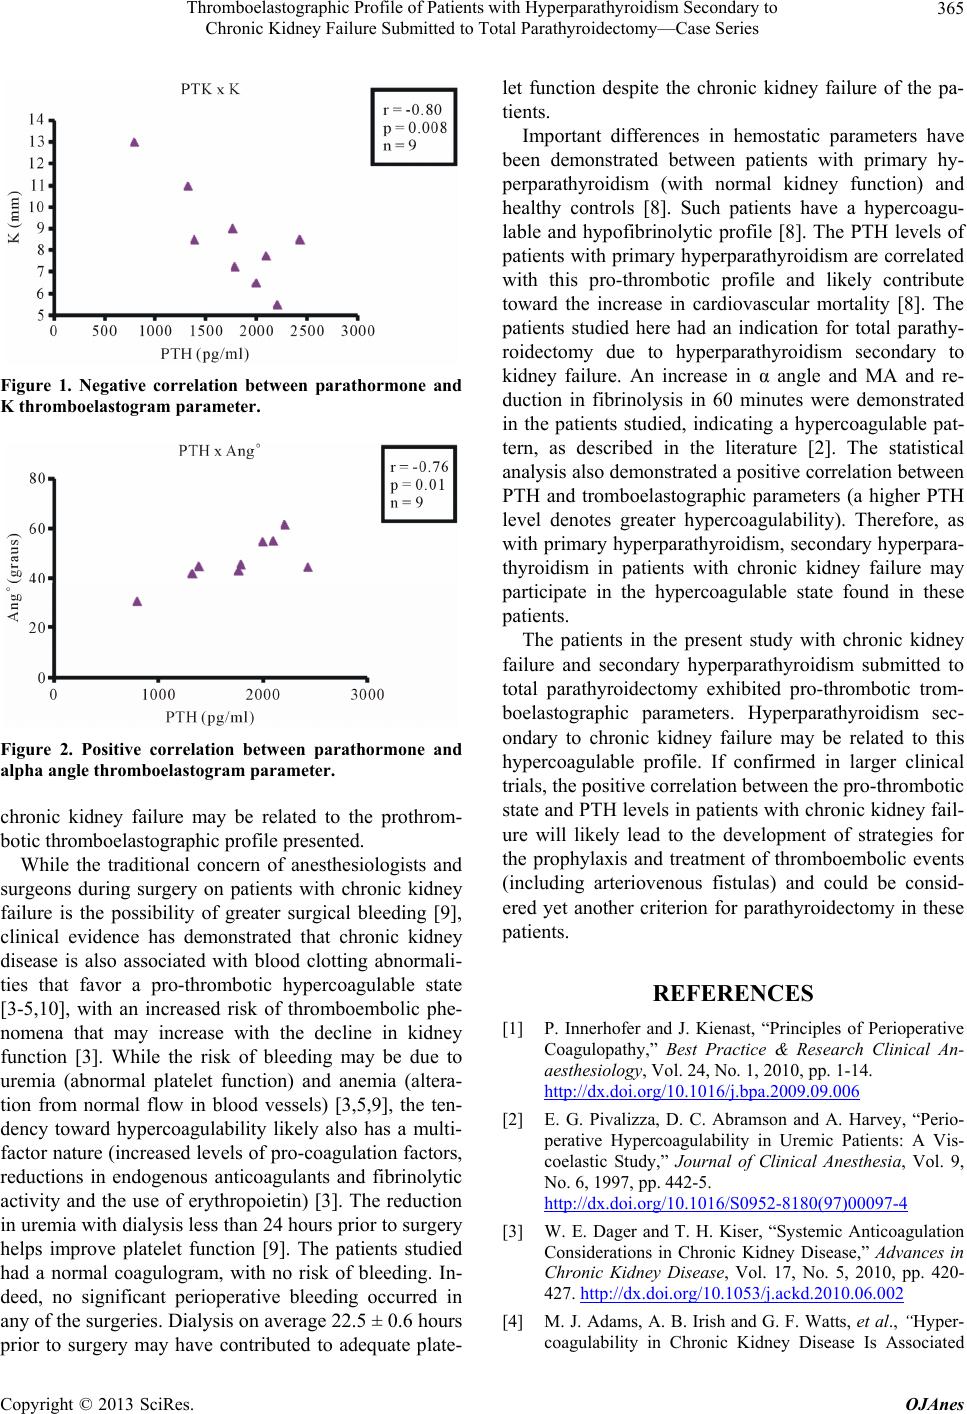
ence values. A negative correlation was found between
the parathyroid hormone (PTH) concentration and the K
parameter of the thromboelastogram (Figure 1) and a
positive correlation was found between PTH and the α
angle of the thromboelastogram (Figure 2).
3. Conclusions
The thromboelastographic profile of the patients with
chronic kidney failure and secondary hyperparathyroid-
ism submitted to total parathyroidectomy with the fore-
arm implant of parathyroid fragments demonstrated a
state of prothrombotic coagulation. As in primary hyper-
parathyroidism [8], hyperparathyroidism secondary to
Table 1. Preoperative data.
Age 44 ± 3.9 years
Gender 8/3 (M/F)
Urea 137.1 ± 15.7 mg/dl
Creatinine 8.7 ± 0.9 mg/dl
Last preoperative dialysis 22.5 ± 0.6 hours earlier
Parathyroid hormone (n = 9) 1753 ± 170
Table 2. Comparative data before and just after anestehetic
induction.
After anesthesia
induction
Before anethesia
induction
Hemoglobine (g/dL) 11.1 ± 0.58 10.67 ± 0.48
Platelets (/mm3) 207.875 ± 19.837 206.222 ± 21.627*
RNI 1.13 ± 0.02 1.12 ± 0.02
APTT (p/c) 1.04 ± 0.05 0.99 ± 0.05
Ionic Calcium (mmol/L)1.22 ± 0.02 1.13 ± 0.02*
R time 26.23 ± 1.62 27.64 ± 3.86
K time 8.77 ± 1.05 9.29 ± 1.29
Ang α
(ângulo α-VR = 29˚ - 43˚)47.07 ± 3.70 46.80 ± 4.92
MA 71.94 ± 3.27 61.28 ± 3.40
Ly60 0 0
*p < 0.05.
Copyright © 2013 SciRes. OJAnes