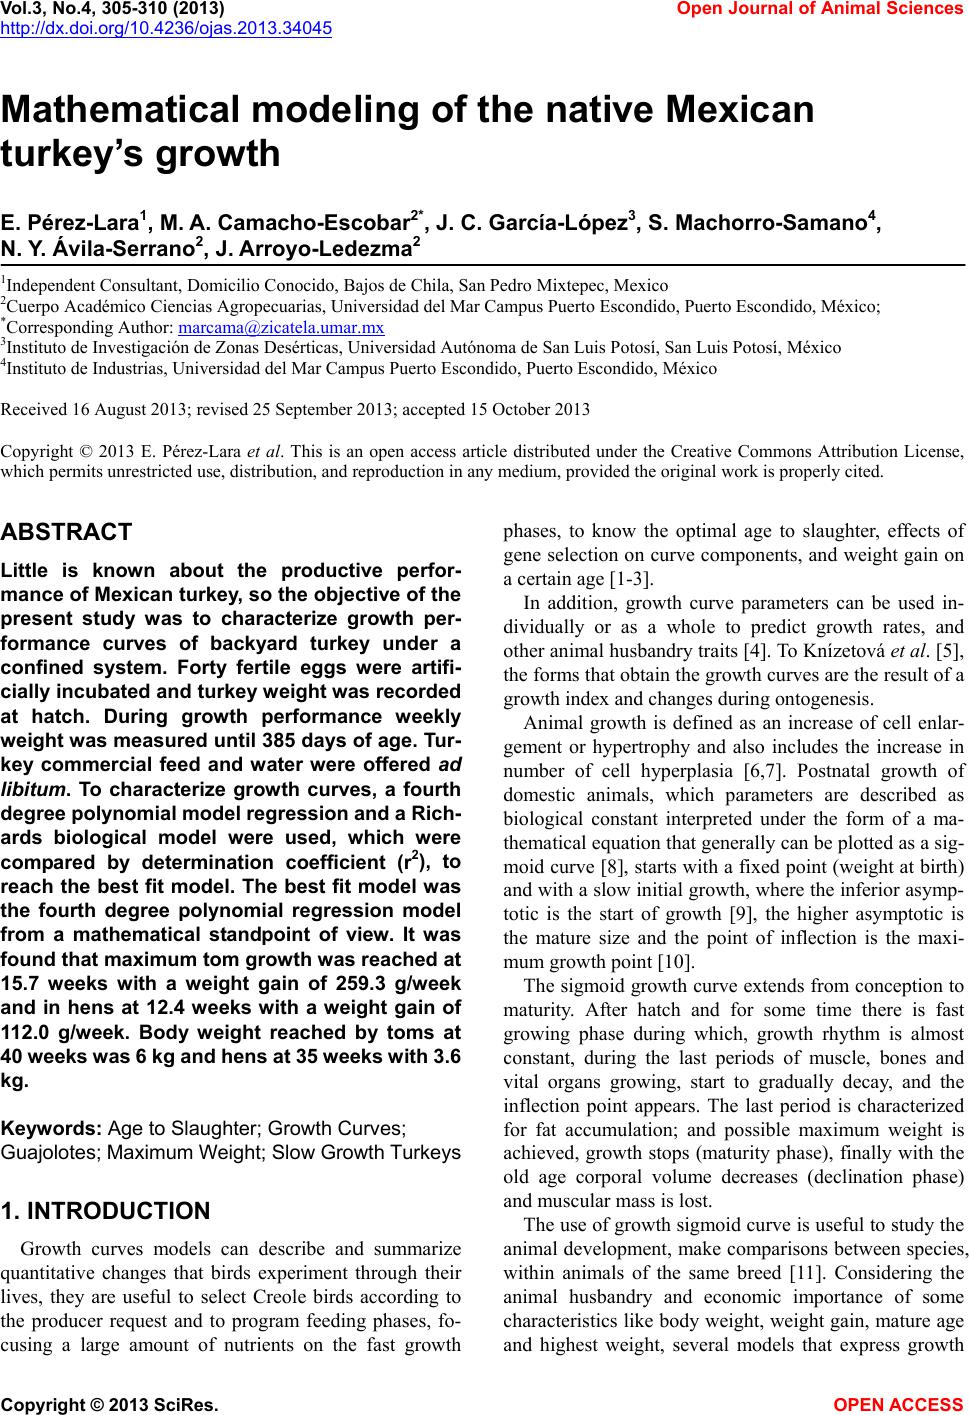
 Vol.3, No.4, 305-310 (2013) Open Journal of Animal Sciences http://dx.doi.org/10.4236/ojas.2013.34045 Mathematical modeling of the native Mexican turkey’s growth E. Pérez-Lara1, M. A. Camacho-Escobar2*, J. C. García-López3, S. Machorro-Samano4, N. Y. Ávila-Serrano2, J. Arroyo-Ledezma2 1Independent Consultant, Domicilio Conocido, Bajos de Chila, San Pedro Mixtepec, Mexico 2Cuerpo Académico Ciencias Agropecuarias, Universidad del Mar Campus Puerto Escondido, Puerto Escondido, México; *Corresponding Author: marcama@zicate la. umar.mx 3Instituto de Investigación de Zonas Desérticas, Universidad Autónoma de San Luis Potosí, San Luis Potosí, México 4Instituto de Industrias, Universidad del Mar Campus Puerto Escondido, Puerto Escondido, México Received 16 August 2013; revised 25 September 2013; accepted 15 October 2013 Copyright © 2013 E. Pérez-Lara et al. This is an open access article distributed under the Creative Commons Attribution License, which permits unrestricted use, distribution, and reproduction in any medium, provided the original work is properly cited. ABSTRACT Little is known about the productive perfor- mance of Mexican turkey, so the objective of the present study was to characterize growth per- formance curves of backyard turkey under a confined system. Forty fertile eggs were artifi- cially incubated and turkey weight was recorded at hatch. During growth performance weekly weight was measured until 385 days of age. Tur- key commercial feed and water were offered ad libitum. To characterize growth curves, a fourth degree polynomial model regression and a Rich - ards biological model were used, which were compared by determination coefficient (r2), to reach the best fit model. The best fit model was the fourth degree polynomial regression model from a mathematical standpoint of view. It was found that maximum tom grow th was reached at 15.7 weeks with a weight gain of 259.3 g/week and in hens at 12.4 weeks with a weight gain of 112.0 g/week. Body weight reached by toms at 40 weeks was 6 kg an d hens at 35 weeks with 3.6 kg. Keywords: Age to Slaughter; Growth Curves; Guajolotes; Maximum Weight; Slow G rowth Turkeys 1. INTRODUCTION Growth curves models can describe and summarize quantitative changes that birds experiment through their lives, they are useful to select Creole birds according to the producer request and to program feeding phases, fo- cusing a large amount of nutrients on the fast growth phases, to know the optimal age to slaughter, effects of gene selection on curve components, and weight gain on a certain age [1-3]. In addition, growth curve parameters can be used in- dividually or as a whole to predict growth rates, and other animal husbandry traits [4]. To Knízetová et al. [5], the forms that obtain the growth curves are the result of a growth index and changes during ontogenesis. Animal growth is defined as an increase of cell enlar- gement or hypertrophy and also includes the increase in number of cell hyperplasia [6,7]. Postnatal growth of domestic animals, which parameters are described as biological constant interpreted under the form of a ma- thematical equation that generally can be plotted as a sig- moid curve [8], starts with a fixed point (weight at birth) and with a slow initial growth, where the inferior asymp- totic is the start of growth [9], the higher asymptotic is the mature size and the point of inflection is the maxi- mum growt h p oi nt [10]. The sigmoid growth curve extends from conception to maturity. After hatch and for some time there is fast growing phase during which, growth rhythm is almost constant, during the last periods of muscle, bones and vital organs growing, start to gradually decay, and the inflection point appears. The last period is characterized for fat accumulation; and possible maximum weight is achieved, growth stops (maturity phase), finally with the old age corporal volume decreases (declination phase) and muscular mass is lost. The use of growth sigmoid curv e is useful to study the animal development, make comparisons between species, within animals of the same breed [11]. Considering the animal husbandry and economic importance of some characteristics like body weight, weight gain, mature age and highest weight, several models that express growth Copyright © 2013 SciRes. OPEN ACCESS 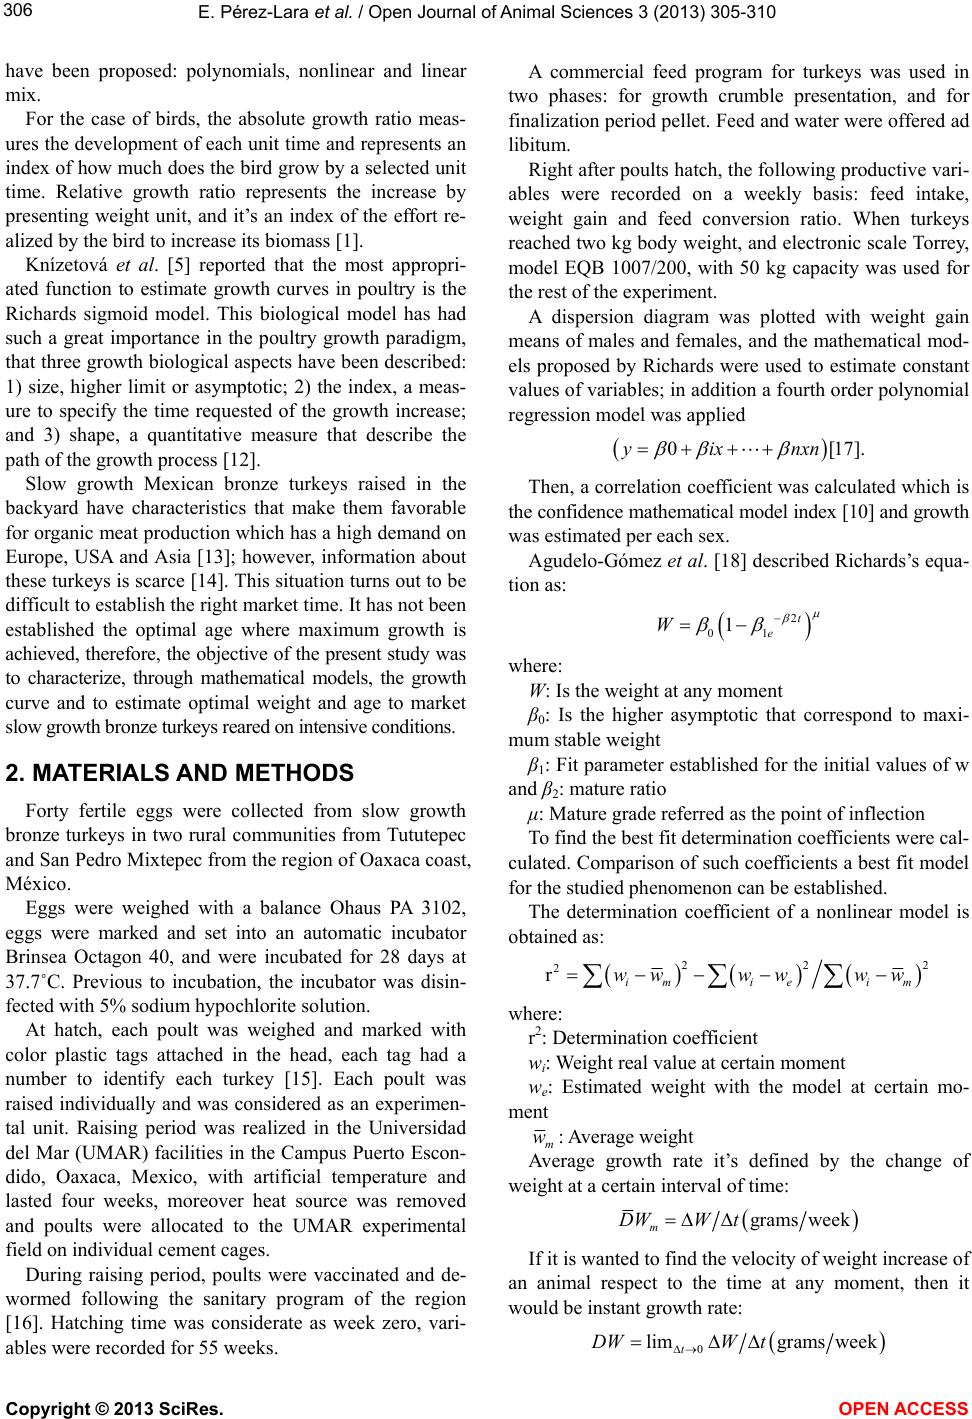 E. Pérez-Lara et al. / Open Journal of Animal Sciences 3 (2013) 305-310 306 have been proposed: polynomials, nonlinear and linear mix. For the case of birds, the absolute growth ratio meas- ures the development of each unit time and represents an index of how much does the bird grow by a selected unit time. Relative growth ratio represents the increase by presenting weight unit, and it’s an index of the effort re- alized by the bird to increase its biomass [1]. Knízetová et al. [5] reported that the most appropri- ated function to estimate growth curves in poultry is the Richards sigmoid model. This biological model has had such a great importance in the poultry growth paradigm, that three growth biological aspects have been described: 1) size, higher limit or asymptotic; 2) the index, a meas- ure to specify the time requested of the growth increase; and 3) shape, a quantitative measure that describe the path of the grow th process [12]. Slow growth Mexican bronze turkeys raised in the backyard have characteristics that make them favorable for organic meat production which has a high demand on Europe, USA and Asia [13]; however, information about these turkeys is scarce [14]. This situation turns out to be difficult to establish the right market time. It has not been established the optimal age where maximum growth is achieved, therefore, the objective of the present study was to characterize, through mathematical models, the growth curve and to estimate optimal weight and age to market slow growth bronze turkeys reared on intensive conditions. 2. MATERIALS AND METHODS Forty fertile eggs were collected from slow growth bronze turkeys in two rural communities from Tututepec and San Pedro Mixtepec from the region of Oaxaca coast, México. Eggs were weighed with a balance Ohaus PA 3102, eggs were marked and set into an automatic incubator Brinsea Octagon 40, and were incubated for 28 days at 37.7˚C. Previous to incubation, the incubator was disin- fected with 5% sodium hypochlorite solution. At hatch, each poult was weighed and marked with color plastic tags attached in the head, each tag had a number to identify each turkey [15]. Each poult was raised individually and was considered as an experimen- tal unit. Raising period was realized in the Universidad del Mar (UMAR) facilities in th e Campus Puerto Escon- dido, Oaxaca, Mexico, with artificial temperature and lasted four weeks, moreover heat source was removed and poults were allocated to the UMAR experimental field on individual cement cages. During raising period, poults were vaccinated and de- wormed following the sanitary program of the region [16]. Hatching time was considerate as week zero, vari- ables were recorded for 55 week s. A commercial feed program for turkeys was used in two phases: for growth crumble presentation, and for finalization period pellet. Feed and water were offered ad libitum. Right after poults hatch, th e following productiv e vari- ables were recorded on a weekly basis: feed intake, weight gain and feed conversion ratio. When turkeys reached two kg body weight, and electronic scale Torrey, model EQB 1007/200, with 50 kg capacity was used for the rest of the experiment. A dispersion diagram was plotted with weight gain means of males and females, and the mathematical mod- els proposed by Richards were used to estimate constant values of variables; in addition a fourth order polyno mial regression model was applied [17].0yixnxn Then, a correlation coefficient was calculated which is the confidence mathematical model index [10] and growth was estimated per each sex. Agudelo-Gómez et al. [18] described Richards’s equa- tion as: 2 01 1t e W where: W: Is the weight at any moment β0: Is the higher asymptotic that correspond to maxi- mum stable weight β1: Fit parameter established for the initial values of w and β2: mature ratio μ: Mature grade referred as the point of inflection To find the best fit determination coefficients were cal- culated. Comparison of such coefficients a best fit model for the studied phenomenon can be established. The determination coefficient of a nonlinear model is obtained as: 22 2 rimie im wwww ww 2 where: r2: Determination coefficient wi: Weight real value at certain moment we: Estimated weight with the model at certain mo- ment m w: A verage weight Average growth rate it’s defined by the change of weight at a certain interval of time: grams week m DWW t If it is wanted to find the velocity of weight increase of an animal respect to the time at any moment, then it would be instant growth rate: 0 limgrams week t DWW t Copyright © 2013 SciRes. OPEN ACCESS 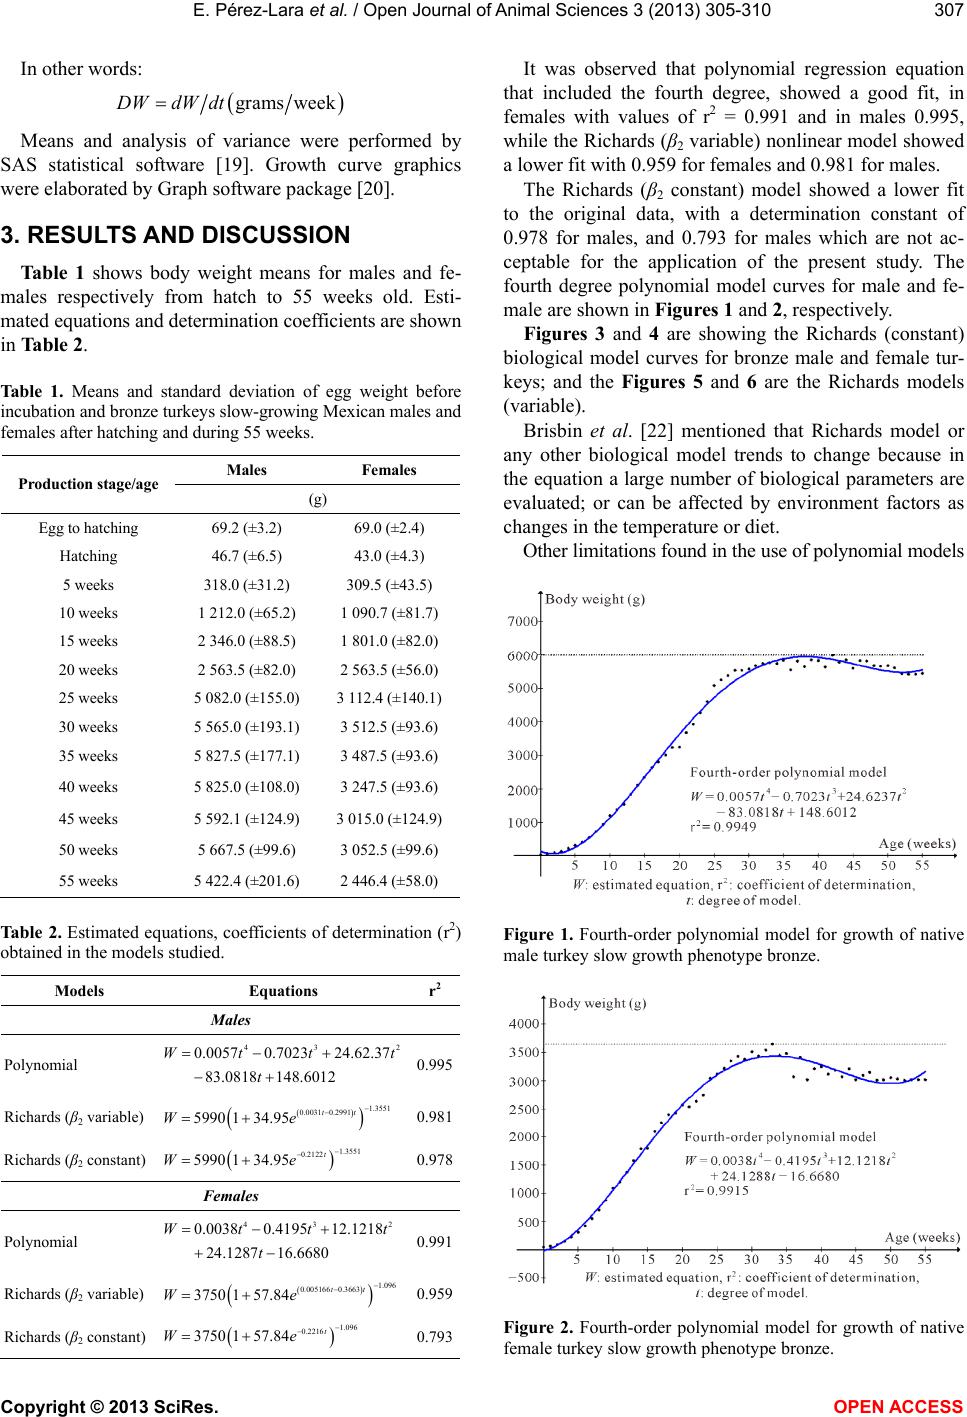 E. Pérez-Lara et al. / Open Journal of Animal Sciences 3 (2013) 305-310 307 In other words: grams weekDWdW dt Means and analysis of variance were performed by SAS statistical software [19]. Growth curve graphics were elaborated by Graph software package [20]. 3. RESULTS AND DISCUSSION Tab le 1 shows body weight means for males and fe- males respectively from hatch to 55 weeks old. Esti- mated equations and determination coefficients are shown in Table 2. Table 1. Means and standard deviation of egg weight before incubation and bronze turkeys slow-growing Mexican males and females after hatching and during 55 weeks. Males Female s Producti on st age/age (g) Egg to hatching 69.2 (±3.2) 69.0 (±2.4) Hatching 46.7 (±6.5) 43.0 (±4.3) 5 weeks 318.0 (±31.2) 309.5 (±43.5) 10 weeks 1 212.0 (±65.2) 1 090.7 (±81.7) 15 weeks 2 346.0 (±88.5) 1 801.0 (±82.0) 20 weeks 2 563.5 (±82.0) 2 563.5 (±56.0) 25 weeks 5 082.0 (±155.0) 3 1 12. 4 (±140.1) 30 weeks 5 565.0 (±193.1) 3 512.5 (±93.6) 35 weeks 5 827.5 (±177.1) 3 487.5 (±93.6) 40 weeks 5 825.0 (±108.0) 3 247.5 (±93.6) 45 weeks 5 592.1 (±124.9) 3 015.0 (±124.9) 50 weeks 5 667.5 (±99.6) 3 052.5 (±99.6) 55 weeks 5 422.4 (±201.6) 2 446.4 (±58.0) Ta ble 2. Estimated equations, coefficients of determination (r2) obtained in the models studied. Models Equations r2 Males Polynomial 43 0.0057 0.7023 24.62.37 83.0818 148.6012 Wt t t It was observed that polynomial regression equation that included the fourth degree, showed a good fit, in females with values of r2 = 0.991 and in males 0.995, while the Richards (β2 variable) nonlinear model showed a lower fit with 0.959 for femal es and 0. 981 for males. The Richards (β2 constant) model showed a lower fit to the original data, with a determination constant of 0.978 for males, and 0.793 for males which are not ac- ceptable for the application of the present study. The fourth degree polynomial model curves for male and fe- male are shown in Figur es 1 and 2, respectively. Figures 3 and 4 are showing the Richards (constant) biological model curves for bronze male and female tur- keys; and the Figures 5 and 6 are the Richards models (variable). Brisbin et al. [22] mentioned that Richards model or any other biological model trends to change because in the equation a large number of biological parameters are evaluated; or can be affected by environment factors as changes in the temperature or diet. Other limitations found in the use of polynomial models Figure 1. Fourth-order polynomial model for growth of native male turkey slow growth phenotype bronze. 2 t 0.995 Richards (β2 variable) 1.3551 0.0031 0.2991 5990 134.95tt We 0.981 Richards (β2 constant) 1.3551 0.2122 5990 134.95t We 0.978 Females Polynomial 43 0.00380.4195 12.1218 24.1287 16.6680 Wt t t 2 t 0.991 Richards (β2 variable) 1.096 0.005166 0.3663 3750 157.84tt We 0.959 Richards (β2 constant) 1.096 0.2216 3750 157.84t We Figure 2. Fourth-order polynomial model for growth of native female turkey slow growth phenotype bronze. 0.793 Copyright © 2013 SciRes. OPEN ACCESS 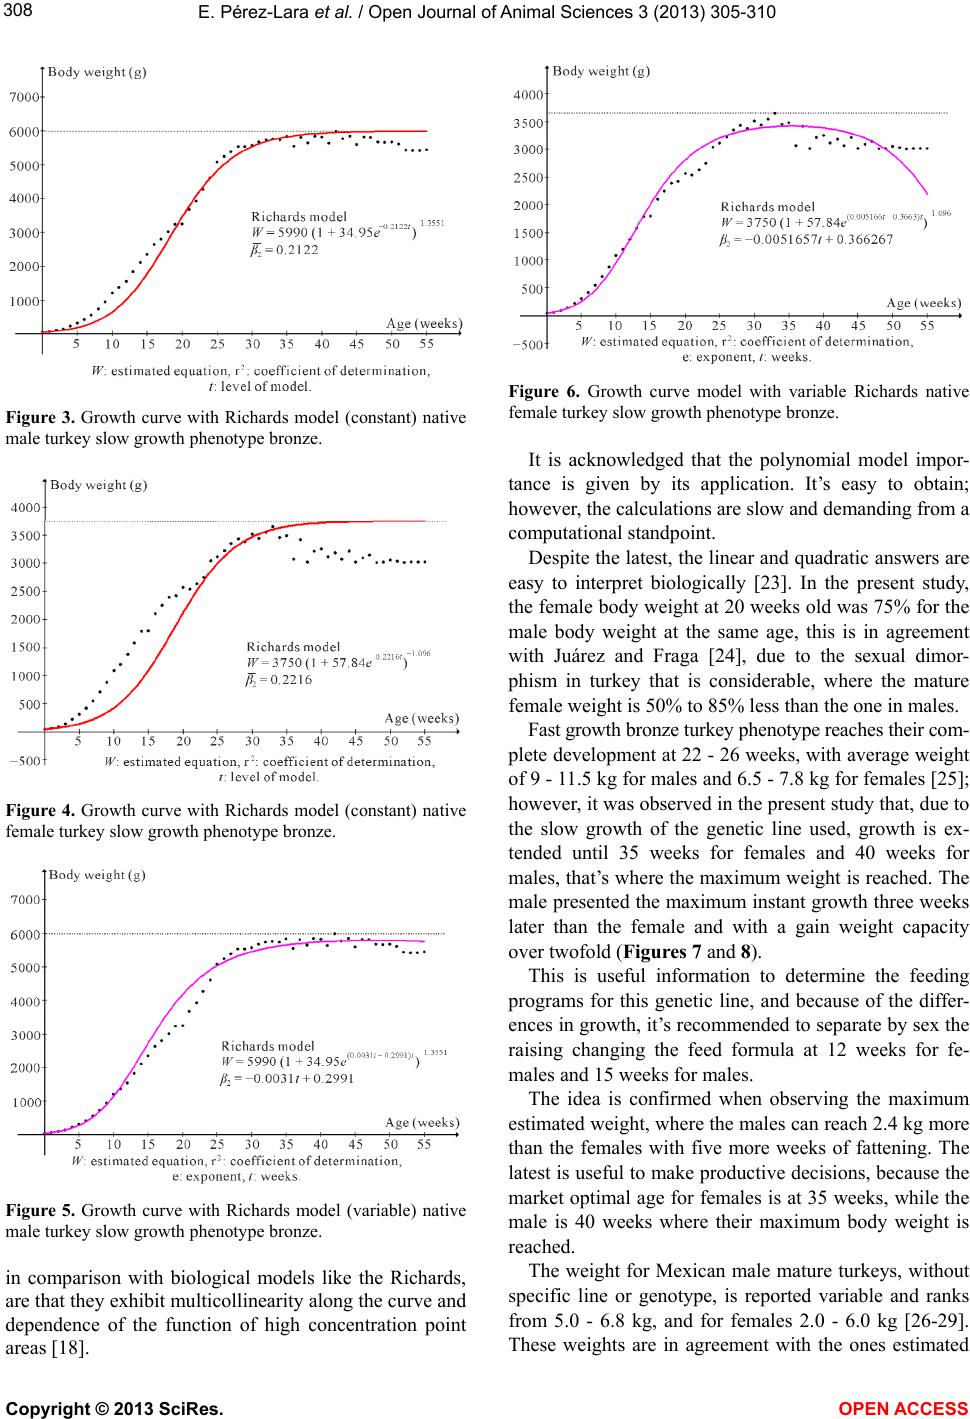 E. Pérez-Lara et al. / Open Journal of Animal Sciences 3 (2013) 305-310 308 Figure 3. Growth curve with Richards model (constant) native male turkey slow growth phenotype bronze. Figure 4. Growth curve with Richards model (constant) native female turkey slow growth phenotype bronze. Figure 5. Growth curve with Richards model (variable) native male turkey slow growth phenotype bronze. in comparison with biological models like the Richards, are that they exhibit multicollinearity along the curve and dependence of the function of high concentration point areas [18]. Figure 6. Growth curve model with variable Richards native female turkey slow growth phenotype bronze. It is acknowledged that the polynomial model impor- tance is given by its application. It’s easy to obtain; however, the calculations are slow and demanding from a computational standpoint. Despite the latest, the linear and quadratic answers are easy to interpret biologically [23]. In the present study, the female body weight at 20 weeks old was 75% for the male body weight at the same age, this is in agreement with Juárez and Fraga [24], due to the sexual dimor- phism in turkey that is considerable, where the mature female weight is 50% to 85% less than the one in males. Fast growth bronze turkey phenotype reaches their com- plete development at 22 - 26 weeks, with average weight of 9 - 11.5 kg for males and 6.5 - 7.8 kg for females [25]; however, it was observed in the present study that, due to the slow growth of the genetic line used, growth is ex- tended until 35 weeks for females and 40 weeks for males, that’s where the maximum weight is reached. The male presented the maximum instant growth three weeks later than the female and with a gain weight capacity over twofold (Fi gures 7 and 8). This is useful information to determine the feeding programs for this genetic line, and because of the differ- ences in growth, it’s recommended to separate by sex the raising changing the feed formula at 12 weeks for fe- males and 15 weeks for males. The idea is confirmed when observing the maximum estimated weight, where the males can reach 2.4 kg more than the females with five more weeks of fattening. The latest is useful to make productive decisions, because the market optimal age for females is at 35 weeks, while the male is 40 weeks where their maximum body weight is reached. The weight for Mexican male mature turkeys, without specific line or genotype, is reported variable and ranks from 5.0 - 6.8 kg, and for females 2.0 - 6.0 kg [26-29]. These weights are in agreement with the ones estimated Copyright © 2013 SciRes. OPEN ACCESS 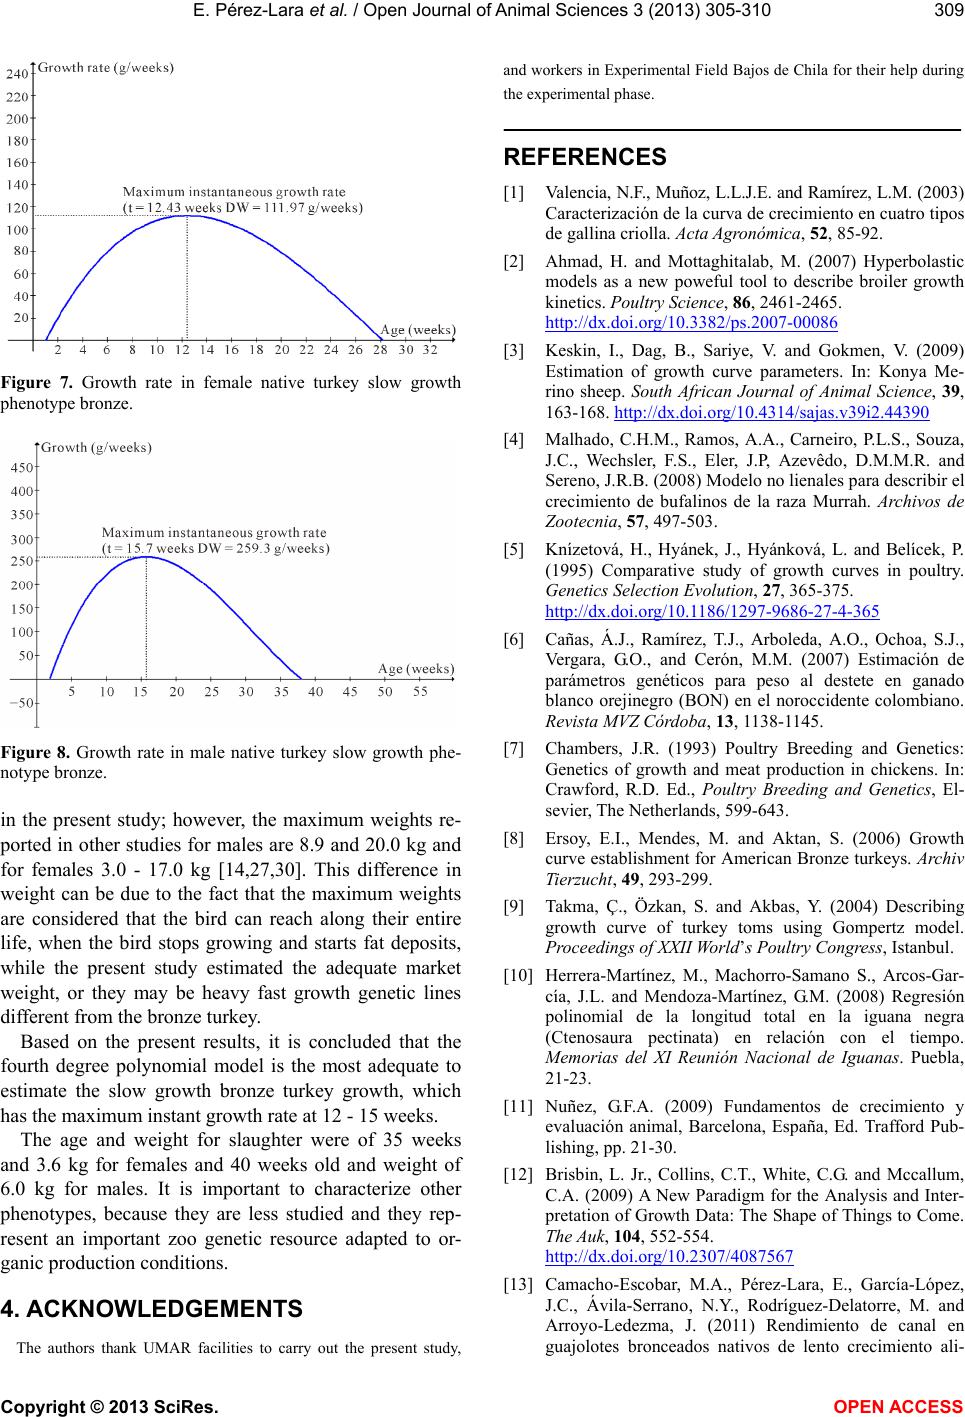 E. Pérez-Lara et al. / Open Journal of Animal Sciences 3 (2013) 305-310 309 Figure 7. Growth rate in female native turkey slow growth phenotype bronze. Figure 8. Growth rate in male native turkey slow growth phe- notype bronze. in the present study; however, the maximum weights re- ported in other studies for males ar e 8.9 and 20.0 kg and for females 3.0 - 17.0 kg [14,27,30]. This difference in weight can be due to the fact that the maximum weights are considered that the bird can reach along their entire life, when the bird stops growing and starts fat deposits, while the present study estimated the adequate market weight, or they may be heavy fast growth genetic lines different from the bronze turkey. Based on the present results, it is concluded that the fourth degree polynomial model is the most adequate to estimate the slow growth bronze turkey growth, which has the maximum instant growth rate at 12 - 15 weeks. The age and weight for slaughter were of 35 weeks and 3.6 kg for females and 40 weeks old and weight of 6.0 kg for males. It is important to characterize other phenotypes, because they are less studied and they rep- resent an important zoo genetic resource adapted to or- ganic production conditions. 4. ACKNOWLEDGEMENTS The authors thank UMAR facilities to carry out the present study, and workers in Experimental Field Bajos de Chila for their help during the experimental phase. REFERENCES [1] Valencia, N.F., Muñoz, L.L.J.E. and Ramírez, L.M. (2003) Caracterización de la curva de crecimiento en cuatro tipos de gallina criolla. Acta Agronómica, 52, 85-92. [2] Ahmad, H. and Mottaghitalab, M. (2007) Hyperbolastic models as a new poweful tool to describe broiler growth kinetics. Poultry Science, 86, 2461-2465. http://dx.doi.org/10.3382/ps.2007-00086 [3] Keskin, I., Dag, B., Sariye, V. and Gokmen, V. (2009) Estimation of growth curve parameters. In: Konya Me- rino sheep. South African Journal of Animal Science, 39, 163-168. http://dx.doi.org/10.4314/sajas.v39i2.44390 [4] Malhado, C.H.M., Ramos, A.A., Carneiro, P.L.S., Souza, J.C., Wechsler, F.S., Eler, J.P, Azevêdo, D.M.M.R. and Sereno, J.R.B. (2008) Modelo no lienales para describir el crecimiento de bufalinos de la raza Murrah. Archivos de Zootecnia, 57, 497-503. [5] Knízetová, H., Hyánek, J., Hyánková, L. and Belícek, P. (1995) Comparative study of growth curves in poultry. Genetics Selection Evolution, 27, 365-375. http://dx.doi.org/10.1186/1297-9686-27-4-365 [6] Cañas, Á.J., Ramírez, T.J., Arboleda, A.O., Ochoa, S.J., Vergara, G.O., and Cerón, M.M. (2007) Estimación de parámetros genéticos para peso al destete en ganado blanco orejinegro (BON) en el noroccidente colombiano. Revista MVZ Córdoba, 13, 1138-1145. [7] Chambers, J.R. (1993) Poultry Breeding and Genetics: Genetics of growth and meat production in chickens. In: Crawford, R.D. Ed., Poultry Breeding and Genetics, El- sevier, The Netherlands, 599-643. [8] Ersoy, E.I., Mendes, M. and Aktan, S. (2006) Growth curve establishment for American Bronze turkeys. Archiv Tierzucht, 49, 293-299. [9] Takma, Ç., Özkan, S. and Akbas, Y. (2004) Describing growth curve of turkey toms using Gompertz model. Proceedings of XXII World’s Poultry Congress, Istanbul. [10] Herrera-Martínez, M., Machorro-Samano S., Arcos-Gar- cía, J.L. and Mendoza-Martínez, G.M. (2008) Regresión polinomial de la longitud total en la iguana negra (Ctenosaura pectinata) en relación con el tiempo. Memorias del XI Reunión Nacional de Iguanas. Puebla, 21-23. [11] Nuñez, G.F.A. (2009) Fundamentos de crecimiento y evaluación animal, Barcelona, España, Ed. Trafford Pub- lishing, pp. 21-30. [12] Brisbin, L. Jr., Collins, C.T., White, C.G. and Mccallum, C.A. (2009) A New Paradigm for the Analysis and Inter- pretation of Growth Data: The Shape of Things to Come. The Auk, 104, 552-554. http://dx.doi.org/10.2307/4087567 [13] Camacho-Escobar, M.A., Pérez-Lara, E., García-López, J.C., Ávila-Serrano, N.Y., Rodríguez-Delatorre, M. and Arroyo-Ledezma, J. (2011) Rendimiento de canal en guajolotes bronceados nativos de lento crecimiento ali- Copyright © 2013 SciRes. OPEN ACCESS 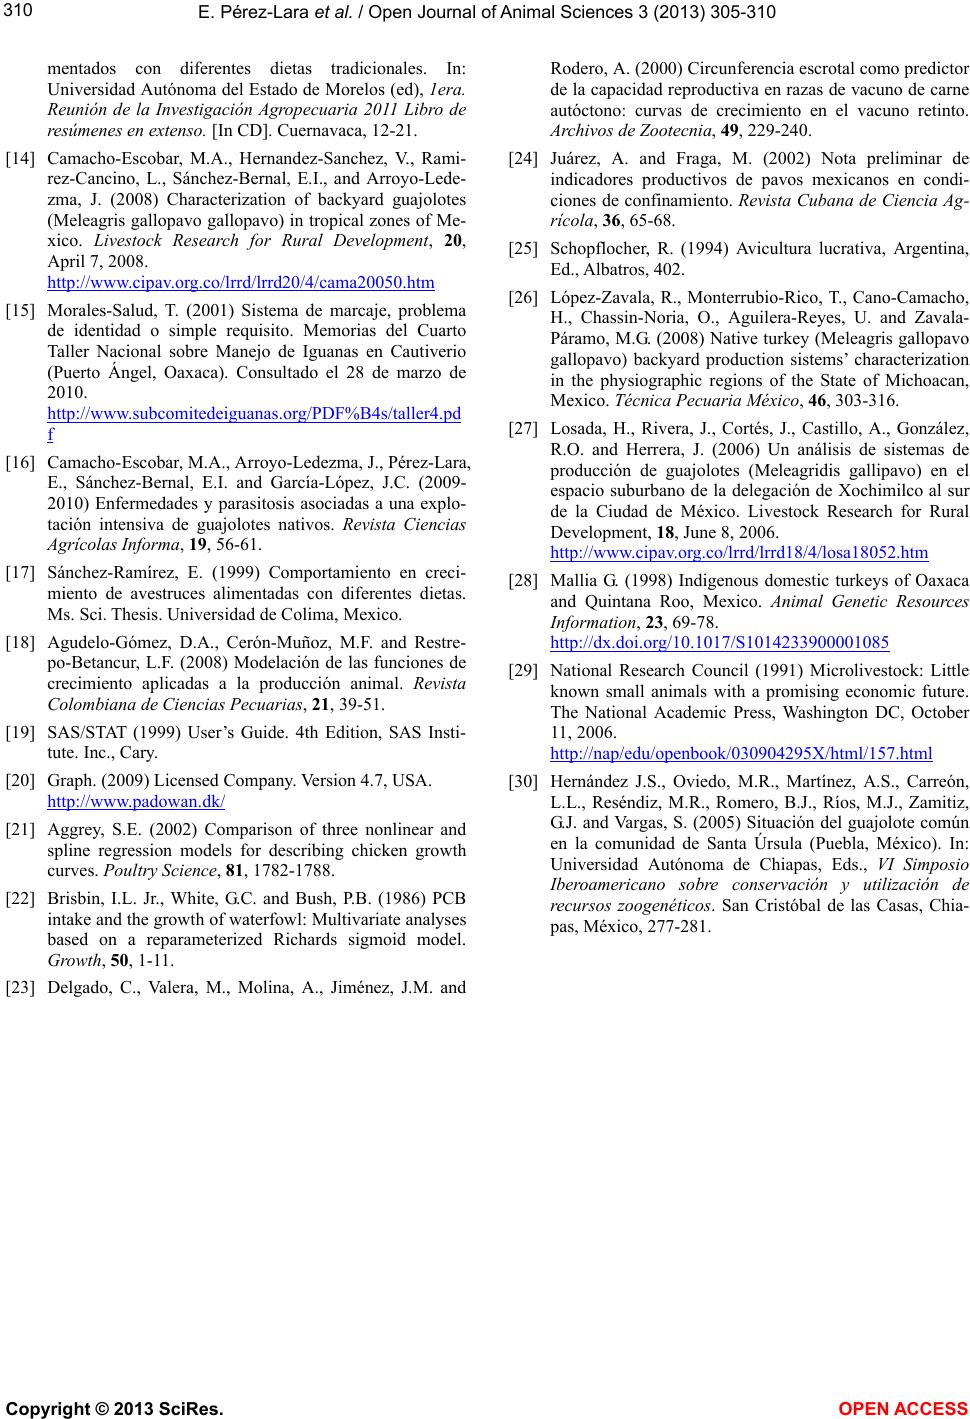 E. Pérez-Lara et al. / Open Journal of Animal Sciences 3 (2013) 305-310 Copyright © 2013 SciRes. OPEN ACCESS 310 mentados con diferentes dietas tradicionales. In: Universidad Autónoma del Estado de Morelos (ed), 1era. Reunión de la Investigación Agropecuaria 2011 Libro de resúmenes en extenso. [In CD]. Cuernavaca, 12-21. [14] Camacho-Escobar, M.A., Hernandez-Sanchez, V., Rami- rez-Cancino, L., Sánchez-Bernal, E.I., and Arroyo-Lede- zma, J. (2008) Characterization of backyard guajolotes (Meleagris gallopavo gallopavo) in tropical zones of Me- xico. Livestock Research for Rural Development, 20, April 7, 2008. http://www.cipav.org.co/lrrd/lrrd20/4/cama20050.htm [15] Morales-Salud, T. (2001) Sistema de marcaje, problema de identidad o simple requisito. Memorias del Cuarto Taller Nacional sobre Manejo de Iguanas en Cautiverio (Puerto Ángel, Oaxaca). Consultado el 28 de marzo de 2010. http://www.subcomitedeiguanas.org/PDF%B4s/taller4.pd f [16] Camacho-Escobar, M.A., Arroyo-Ledezma, J., Pérez-Lara, E., Sánchez-Bernal, E.I. and García-López, J.C. (2009- 2010) Enfermedades y parasitosis asociadas a una explo- tación intensiva de guajolotes nativos. Revista Ciencias Agrícolas Informa, 19, 56-61. [17] Sánchez-Ramírez, E. (1999) Comportamiento en creci- miento de avestruces alimentadas con diferentes dietas. Ms. Sci. Thesis. Universidad de Colima, Mexico. [18] Agudelo-Gómez, D.A., Cerón-Muñoz, M.F. and Restre- po-Betancur, L.F. (2008) Modelación de las funciones de crecimiento aplicadas a la producción animal. Revista Colombiana de Ciencias Pecuarias, 21, 39-51. [19] SAS/STAT (1999) User’s Guide. 4th Edition, SAS Insti- tute. Inc., Cary. [20] Graph. (2009) Licensed Company. Version 4.7, USA. http://www.padowan.dk/ [21] Aggrey, S.E. (2002) Comparison of three nonlinear and spline regression models for describing chicken growth curves. Poultry Science, 81, 1782-1788. [22] Brisbin, I.L. Jr., White, G.C. and Bush, P.B. (1986) PCB intake and the growth of waterfowl: Multivariate analyses based on a reparameterized Richards sigmoid model. Growth, 50, 1-11. [23] Delgado, C., Valera, M., Molina, A., Jiménez, J.M. and Rodero, A. (2000) Circunferencia escrotal como predictor de la capacidad reproductiva en razas de vacuno de carne autóctono: curvas de crecimiento en el vacuno retinto. Archivos de Zootecnia, 49, 229-240. [24] Juárez, A. and Fraga, M. (2002) Nota preliminar de indicadores productivos de pavos mexicanos en condi- ciones de confinamiento. Revista Cubana de Ciencia Ag- rícola, 36, 65-68. [25] Schopflocher, R. (1994) Avicultura lucrativa, Argentina, Ed., Albatros, 402. [26] López-Zavala, R., Monterrubio-Rico, T., Cano-Camacho, H., Chassin-Noria, O., Aguilera-Reyes, U. and Zavala- Páramo, M.G. (2008) Native turkey (Meleagris gallopavo gallopavo) backyard production sistems’ characterization in the physiographic regions of the State of Michoacan, Mexico. Técnica Pecuaria México, 46, 303-316. [27] Losada, H., Rivera, J., Cortés, J., Castillo, A., González, R.O. and Herrera, J. (2006) Un análisis de sistemas de producción de guajolotes (Meleagridis gallipavo) en el espacio suburbano de la delegación de Xochimilco al sur de la Ciudad de México. Livestock Research for Rural Development, 18, June 8, 2006. http://www.cipav.org.co/lrrd/lrrd18/4/losa18052.htm [28] Mallia G. (1998) Indigenous domestic turkeys of Oaxaca and Quintana Roo, Mexico. Animal Genetic Resources Information, 23, 69-78. http://dx.doi.org/10.1017/S1014233900001085 [29] National Research Council (1991) Microlivestock: Little known small animals with a promising economic future. The National Academic Press, Washington DC, October 11, 2006. http://nap/edu/openbook/030904295X/html/157.html [30] Hernández J.S., Oviedo, M.R., Martínez, A.S., Carreón, L.L., Reséndiz, M.R., Romero, B.J., Ríos, M.J., Zamitiz, G.J. and Vargas, S. (2005) Situación del guajolote común en la comunidad de Santa Úrsula (Puebla, México). In: Universidad Autónoma de Chiapas, Eds., VI Simposio Iberoamericano sobre conservación y utilización de recursos zoogenéticos. San Cristóbal de las Casas, Chia- pas, México, 277-281.
|