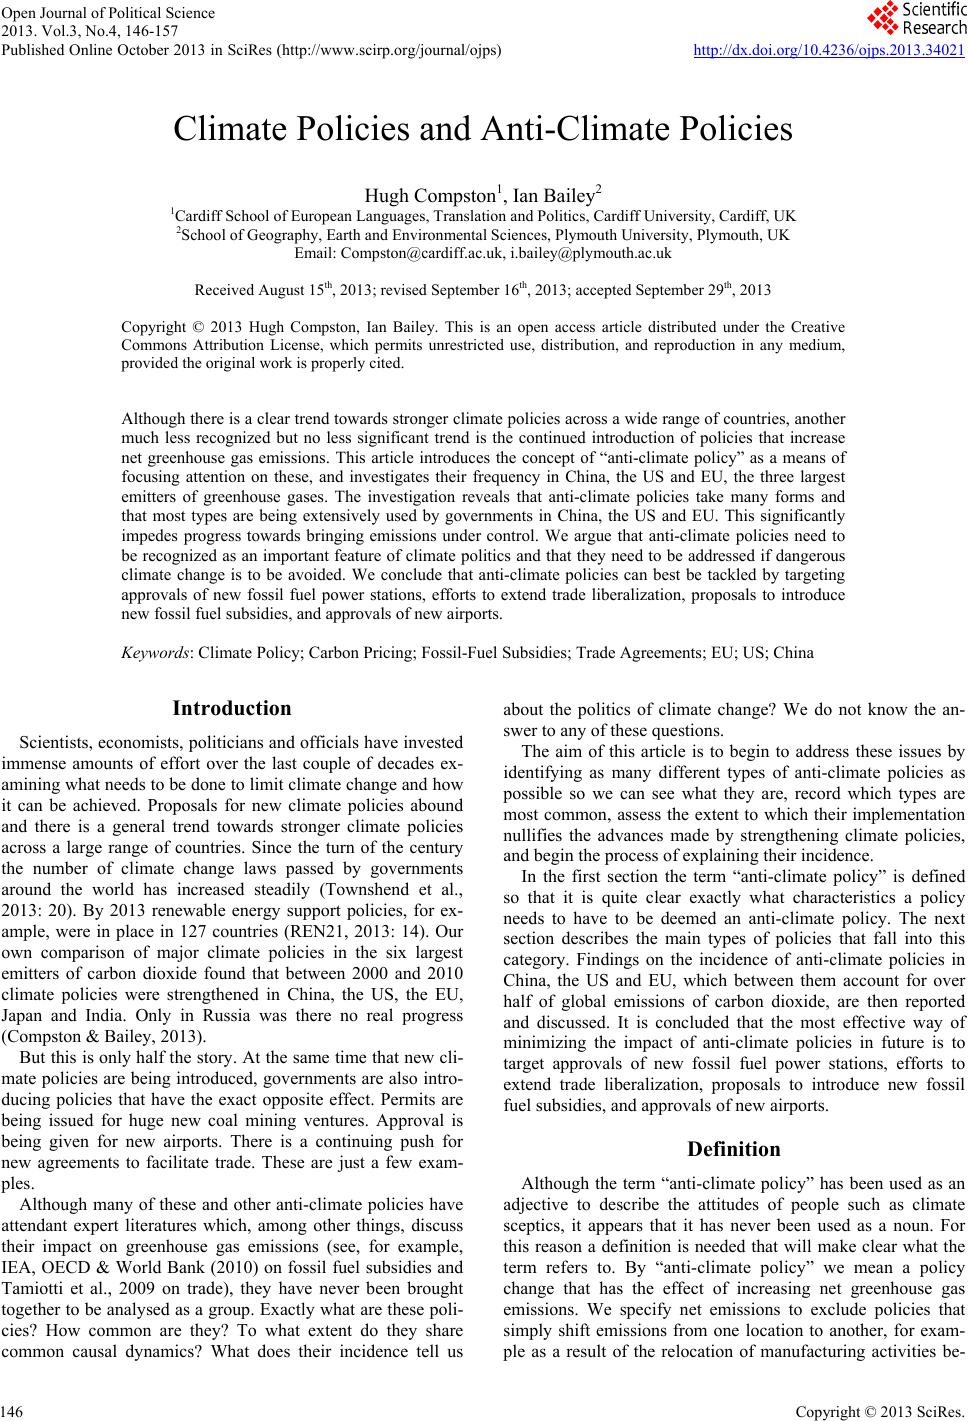
 Open Journal of Political Science 2013. Vol.3, No.4, 146-157 Published Online October 2013 in SciRes (http://www.scirp.org/journal/ojps) http://dx.doi.org/10.4236/ojps.2013.34021 Copyright © 2013 SciRes. 146 Climate Policies and Anti-Climate Policies Hugh Compston1, Ian Bailey2 1Cardiff School of European Languages, Translation and Politics, Cardiff University, Cardiff, UK 2School of Geography, Earth and Environmental Sciences, Plymouth University, Plymouth, UK Email: Compston@cardiff.ac.uk, i.bailey@plymouth.ac.uk Received August 15th, 2013; revised September 16th, 2013; accepted September 29th, 2013 Copyright © 2013 Hugh Compston, Ian Bailey. This is an open access article distributed under the Creative Commons Attribution License, which permits unrestricted use, distribution, and reproduction in any medium, provided the original work is properly cited. Although there is a clear trend towards stronger climate policies across a wide range of countries, another much less recognized but no less significant trend is the continued introduction of policies that increase net greenhouse gas emissions. This article introduces the concept of “anti-climate policy” as a means of focusing attention on these, and investigates their frequency in China, the US and EU, the three largest emitters of greenhouse gases. The investigation reveals that anti-climate policies take many forms and that most types are being extensively used by governments in China, the US and EU. This significantly impedes progress towards bringing emissions under control. We argue that anti-climate policies need to be recognized as an important feature of climate politics and that they need to be addressed if dangerous climate change is to be avoided. We conclude that anti-climate policies can best be tackled by targeting approvals of new fossil fuel power stations, efforts to extend trade liberalization, proposals to introduce new fossil fuel subsidies, and approvals of new airports. Keywords: Climate Policy; Carbon Pricing; Fossil-Fuel Subsidies; Trade Agreements; EU; US; China Introduction Scientists, economists, politicians and officials have invested immense amounts of effort over the last couple of decades ex- amining what needs to be done to limit climate change and how it can be achieved. Proposals for new climate policies abound and there is a general trend towards stronger climate policies across a large range of countries. Since the turn of the century the number of climate change laws passed by governments around the world has increased steadily (Townshend et al., 2013: 20). By 2013 renewable energy support policies, for ex- ample, were in place in 127 countries (REN21, 2013: 14). Our own comparison of major climate policies in the six largest emitters of carbon dioxide found that between 2000 and 2010 climate policies were strengthened in China, the US, the EU, Japan and India. Only in Russia was there no real progress (Compston & Bailey, 2013). But this is only half the story. At the same time that new cli- mate policies are being introduced, governments are also intro- ducing policies that have the exact opposite effect. Permits are being issued for huge new coal mining ventures. Approval is being given for new airports. There is a continuing push for new agreements to facilitate trade. These are just a few exam- ples. Although many of these and other anti-climate policies have attendant expert literatures which, among other things, discuss their impact on greenhouse gas emissions (see, for example, IEA, OECD & World Bank (2010) on fossil fuel subsidies and Tamiotti et al., 2009 on trade), they have never been brought together to be analysed as a group. Exactly what are these poli- cies? How common are they? To what extent do they share common causal dynamics? What does their incidence tell us about the politics of climate change? We do not know the an- swer to any of these questions. The aim of this article is to begin to address these issues by identifying as many different types of anti-climate policies as possible so we can see what they are, record which types are most common, assess the extent to which their implementation nullifies the advances made by strengthening climate policies, and begin the process of explaining their incidence. In the first section the term “anti-climate policy” is defined so that it is quite clear exactly what characteristics a policy needs to have to be deemed an anti-climate policy. The next section describes the main types of policies that fall into this category. Findings on the incidence of anti-climate policies in China, the US and EU, which between them account for over half of global emissions of carbon dioxide, are then reported and discussed. It is concluded that the most effective way of minimizing the impact of anti-climate policies in future is to target approvals of new fossil fuel power stations, efforts to extend trade liberalization, proposals to introduce new fossil fuel subsidies, and approvals of new airports. Definition Although the term “anti-climate policy” has been used as an adjective to describe the attitudes of people such as climate sceptics, it appears that it has never been used as a noun. For this reason a definition is needed that will make clear what the term refers to. By “anti-climate policy” we mean a policy change that has the effect of increasing net greenhouse gas emissions. We specify net emissions to exclude policies that simply shift emissions from one location to another, for exam- ple as a result of the relocation of manufacturing activities be- 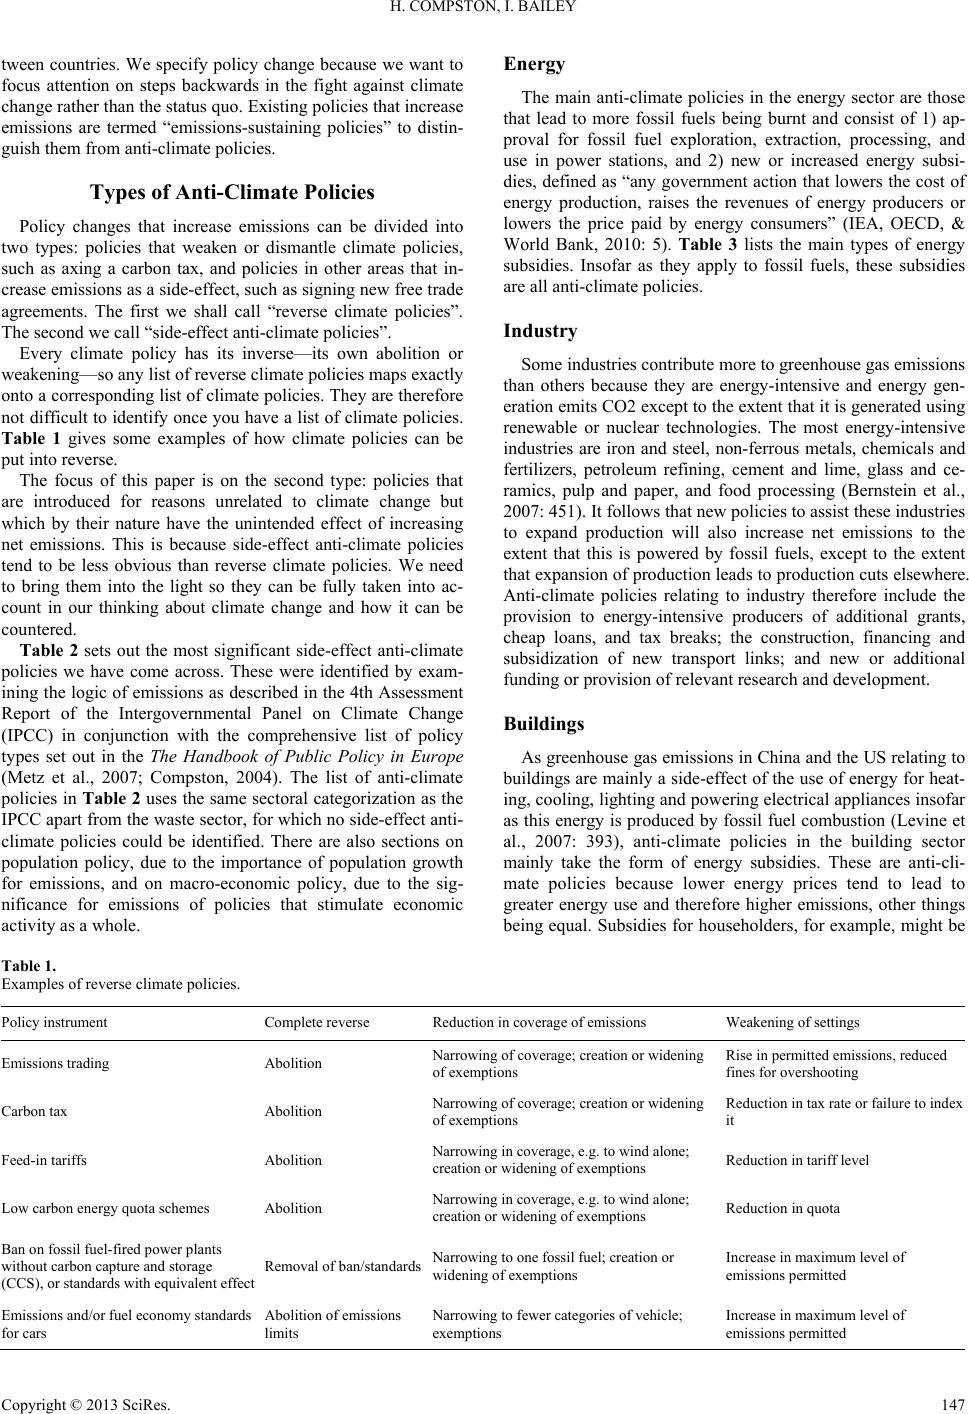 H. COMPSTON, I. BAILEY tween countries. We specify policy change because we want to focus attention on steps backwards in the fight against climate change rather than the status quo. Existing policies that increase emissions are termed “emissions-sustaining policies” to distin- guish them from anti-climate policies. Types of Anti-Climate Policies Policy changes that increase emissions can be divided into two types: policies that weaken or dismantle climate policies, such as axing a carbon tax, and policies in other areas that in- crease emissions as a side-effect, such as signing new free trade agreements. The first we shall call “reverse climate policies”. The second we call “side-effect anti-climate policies”. Every climate policy has its inverse—its own abolition or weakening—so any list of reverse climate policies maps exactly onto a corresponding list of climate policies. They are therefore not difficult to identify once you have a list of climate policies. Table 1 gives some examples of how climate policies can be put into reverse. The focus of this paper is on the second type: policies that are introduced for reasons unrelated to climate change but which by their nature have the unintended effect of increasing net emissions. This is because side-effect anti-climate policies tend to be less obvious than reverse climate policies. We need to bring them into the light so they can be fully taken into ac- count in our thinking about climate change and how it can be countered. Table 2 sets out the most significant side-effect anti-climate policies we have come across. These were identified by exam- ining the logic of emissions as described in the 4th Assessment Report of the Intergovernmental Panel on Climate Change (IPCC) in conjunction with the comprehensive list of policy types set out in the The Handbook of Public Policy in Europe (Metz et al., 2007; Compston, 2004). The list of anti-climate policies in Table 2 uses the same sectoral categorization as the IPCC apart from the waste sector, for which no side-effect anti- climate policies could be identified. There are also sections on population policy, due to the importance of population growth for emissions, and on macro-economic policy, due to the sig- nificance for emissions of policies that stimulate economic activity as a whole. Energy The main anti-climate policies in the energy sector are those that lead to more fossil fuels being burnt and consist of 1) ap- proval for fossil fuel exploration, extraction, processing, and use in power stations, and 2) new or increased energy subsi- dies, defined as “any government action that lowers the cost of energy production, raises the revenues of energy producers or lowers the price paid by energy consumers” (IEA, OECD, & World Bank, 2010: 5). Table 3 lists the main types of energy subsidies. Insofar as they apply to fossil fuels, these subsidies are all anti-climate policies. Industry Some industries contribute more to greenhouse gas emissions than others because they are energy-intensive and energy gen- eration emits CO2 except to the extent that it is generated using renewable or nuclear technologies. The most energy-intensive industries are iron and steel, non-ferrous metals, chemicals and fertilizers, petroleum refining, cement and lime, glass and ce- ramics, pulp and paper, and food processing (Bernstein et al., 2007: 451). It follows that new policies to assist these industries to expand production will also increase net emissions to the extent that this is powered by fossil fuels, except to the extent that expansion of production leads to production cuts elsewhere. Anti-climate policies relating to industry therefore include the provision to energy-intensive producers of additional grants, cheap loans, and tax breaks; the construction, financing and subsidization of new transport links; and new or additional funding or provision of relevant research and development. Buildings As greenhouse gas emissions in China and the US relating to buildings are mainly a side-effect of the use of energy for heat- ing, cooling, lighting and powering electrical appliances insofar as this energy is produced by fossil fuel combustion (Levine et al., 2007: 393), anti-climate policies in the building sector mainly take the form of energy subsidies. These are anti-cli- mate policies because lower energy prices tend to lead to greater energy use and therefore higher emissions, other things being equal. Subsidies for householders, for example, might be Table 1. Examples of reverse climate policies. Policy instrument Complete reverse Reduction in coverage of emissions Weakening of settings Emissions trading Abolition Narrowing of coverage; creation or widening of exemptions Rise in permitted emissions, reduced fines for overshooting Carbon tax Abolition Narrowing of coverage; creation or widening of exemptions Reduction in tax rate or failure to index it Feed-in tariffs Abolition Narrowing in coverage, e.g. to wind alone; creation or widening of exemptions Reduction in tariff level Low carbon energy quota schemes Abolition Narrowing in coverage, e.g. to wind alone; creation or widening of exemptions Reduction in quota Ban on fossil fuel-fired power plants without carbon capture and storage (CCS), or standards with equivalent effect Removal of ban/standardsNarrowing to one fossil fuel; creation or widening of exemptions Increase in maximum level of emissions permitted Emissions and/or fuel economy standards for cars Abolition of emissions limits Narrowing to fewer categories of vehicle; exemptions Increase in maximum level of emissions permitted Copyright © 2013 SciRes. 147 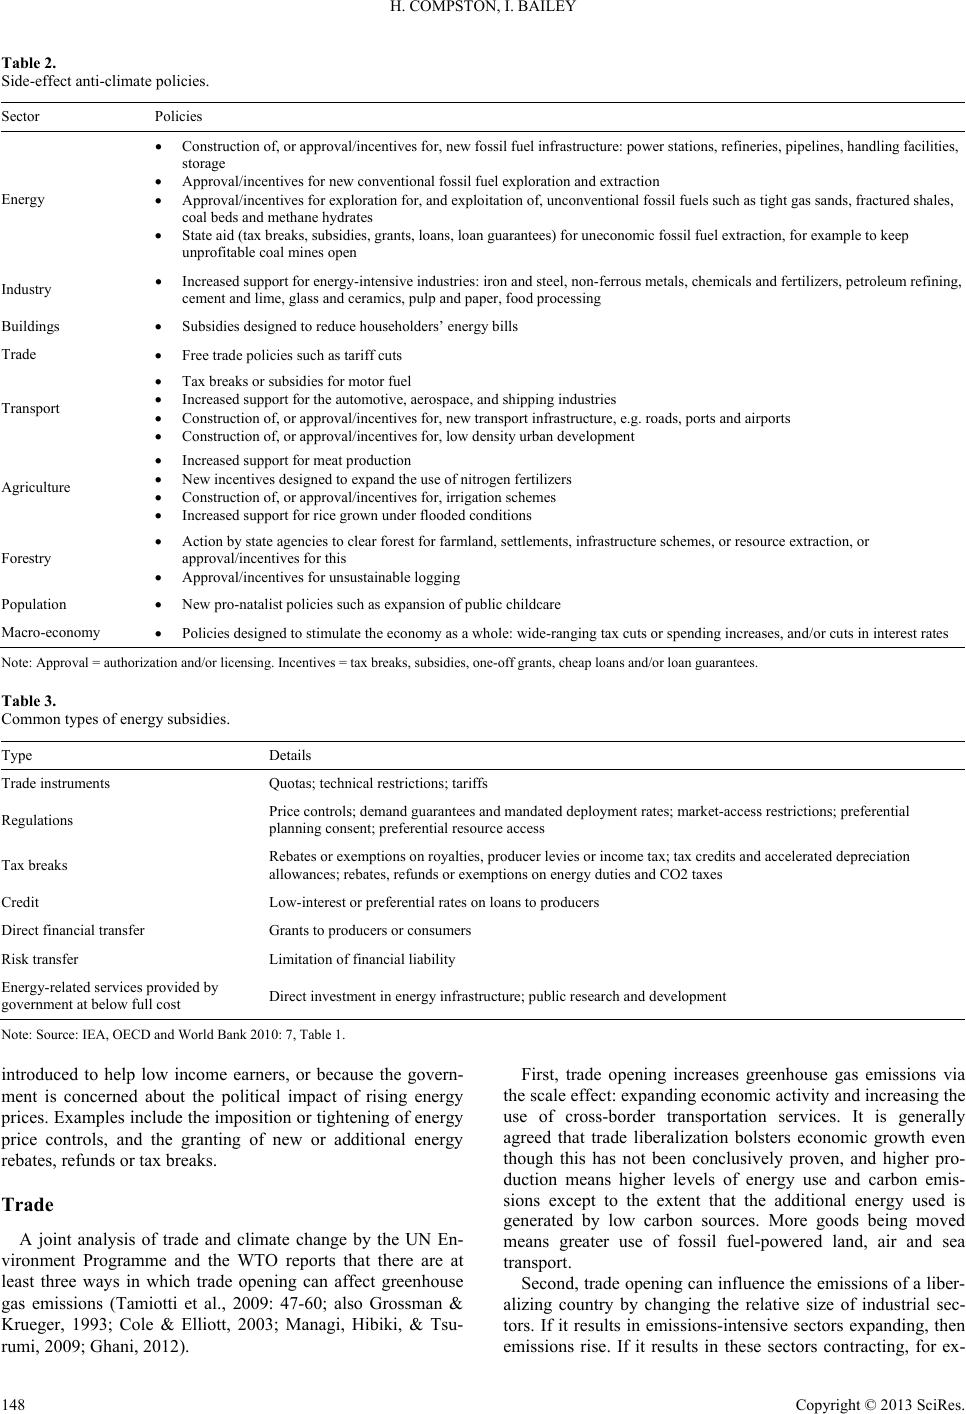 H. COMPSTON, I. BAILEY Table 2. Side-effect anti-climate policies. Sector Policies Energy Construction of, or approval/incentives for, new fossil fuel infrastructure: power stations, refineries, pipelines, handling facilities, storage Approval/incentives for new conventional fossil fuel exploration and extraction Approval/incentives for exploration for, and exploitation of, unconventional fossil fuels such as tight gas sands, fractured shales, coal beds and methane hydrates State aid (tax breaks, subsidies, grants, loans, loan guarantees) for uneconomic fossil fuel extraction, for example to keep unprofitable coal mines open Industry Increased support for energy-intensive industries: iron and steel, non-ferrous metals, chemicals and fertilizers, petroleum refining, cement and lime, glass and ceramics, pulp and paper, food processing Buildings Subsidies designed to reduce householders’ energy bills Trade Free trade policies such as tariff cuts Transport Tax breaks or subsidies for motor fuel Increased support for the automotive, aerospace, and shipping industries Construction of, or approval/incentives for, new transport infrastructure, e.g. roads, ports and airports Construction of, or approval/incentives for, low density urban development Agriculture Increased support for meat production New incentives designed to expand the use of nitrogen fertilizers Construction of, or approval/incentives for, irrigation schemes Increased support for rice grown under flooded conditions Forestry Action by state agencies to clear forest for farmland, settlements, infrastructure schemes, or resource extraction, or approval/incentives for this Approval/incentives for unsustainable logging Population New pro-natalist policies such as expansion of public childcare Macro-economy Policies designed to stimulate the economy as a whole: wide-ranging tax cuts or spending increases, and/or cuts in interest rates Note: Approval = authorization and/or licensing. Incentives = tax breaks, subsidies, one-off grants, cheap loans and/or loan guarantees. Table 3. Common types of energy subsidies. Type Details Trade instruments Quotas; technical restrictions; tariffs Regulations Price controls; demand guarantees and mandated deployment rates; market-access restrictions; preferential planning consent; preferential resource access Tax breaks Rebates or exemptions on royalties, producer levies or income tax; tax credits and accelerated depreciation allowances; rebates, refunds or exemptions on energy duties and CO2 taxes Credit Low-interest or preferential rates on loans to producers Direct financial transfer Grants to producers or consumers Risk transfer Limitation of financial liability Energy-related services provided by government at below full cost Direct investment in energy infrastructure; public research and development Note: Source: IEA, OECD and World Bank 2010: 7, Table 1. introduced to help low income earners, or because the govern- ment is concerned about the political impact of rising energy prices. Examples include the imposition or tightening of energy price controls, and the granting of new or additional energy rebates, refunds or tax breaks. Trade A joint analysis of trade and climate change by the UN En- vironment Programme and the WTO reports that there are at least three ways in which trade opening can affect greenhouse gas emissions (Tamiotti et al., 2009: 47-60; also Grossman & Krueger, 1993; Cole & Elliott, 2003; Managi, Hibiki, & Tsu- rumi, 2009; Ghani, 2012). First, trade opening increases greenhouse gas emissions via the scale effect: expanding economic activity and increasing the use of cross-border transportation services. It is generally agreed that trade liberalization bolsters economic growth even though this has not been conclusively proven, and higher pro- duction means higher levels of energy use and carbon emis- sions except to the extent that the additional energy used is generated by low carbon sources. More goods being moved means greater use of fossil fuel-powered land, air and sea transport. Second, trade opening can influence the emissions of a liber- alizing country by changing the relative size of industrial sec- tors. If it results in emissions-intensive sectors expanding, then emissions rise. If it results in these sectors contracting, for ex- Copyright © 2013 SciRes. 148 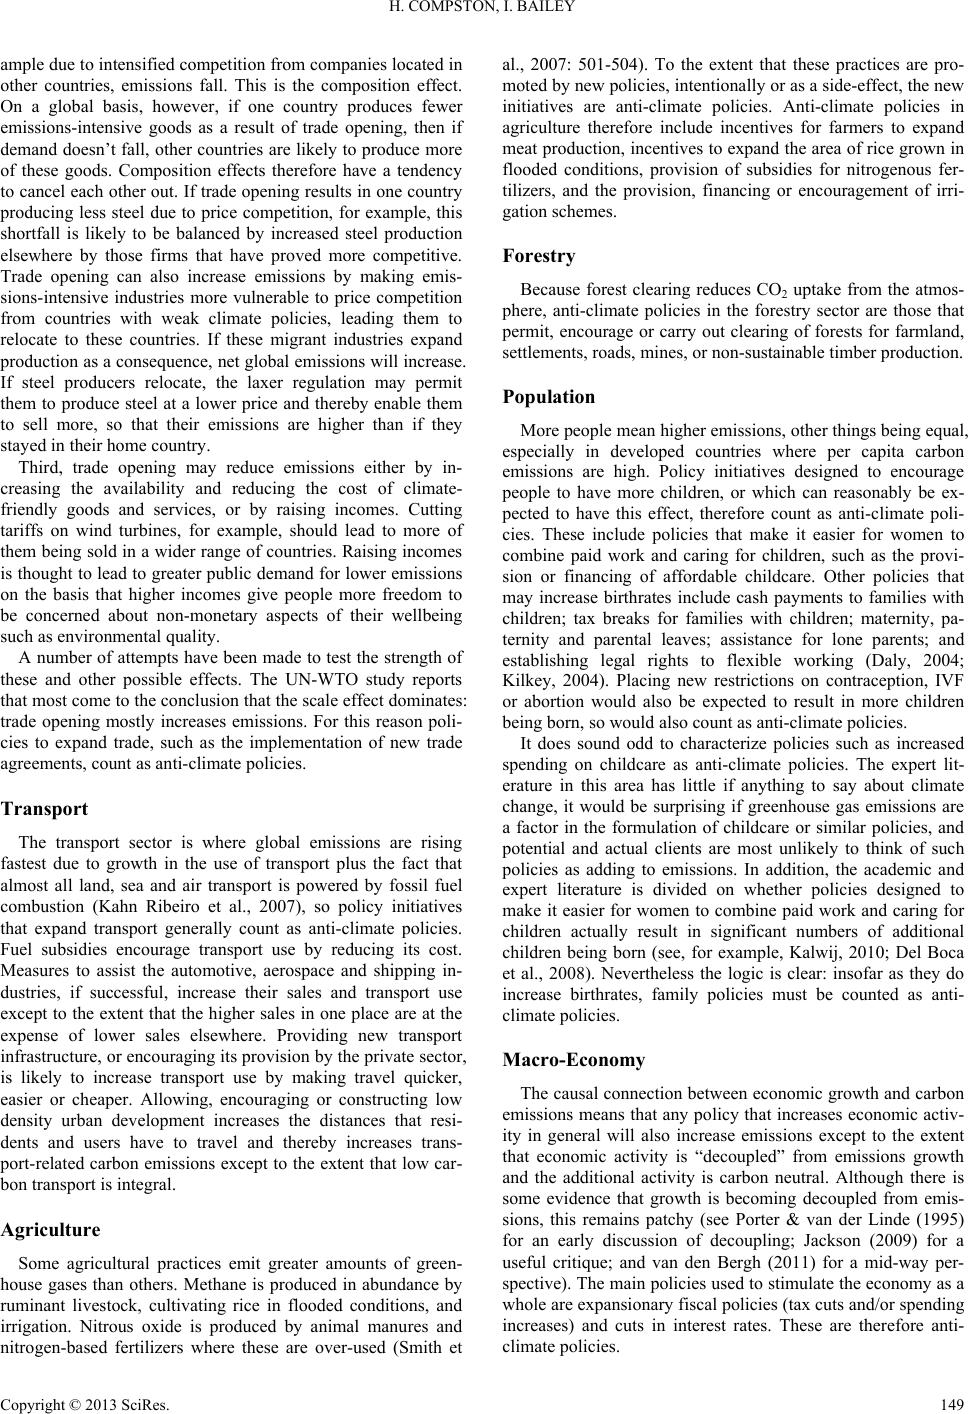 H. COMPSTON, I. BAILEY ample due to intensified competition from companies located in other countries, emissions fall. This is the composition effect. On a global basis, however, if one country produces fewer emissions-intensive goods as a result of trade opening, then if demand doesn’t fall, other countries are likely to produce more of these goods. Composition effects therefore have a tendency to cancel each other out. If trade opening results in one country producing less steel due to price competition, for example, this shortfall is likely to be balanced by increased steel production elsewhere by those firms that have proved more competitive. Trade opening can also increase emissions by making emis- sions-intensive industries more vulnerable to price competition from countries with weak climate policies, leading them to relocate to these countries. If these migrant industries expand production as a consequence, net global emissions will increase. If steel producers relocate, the laxer regulation may permit them to produce steel at a lower price and thereby enable them to sell more, so that their emissions are higher than if they stayed in their home country. Third, trade opening may reduce emissions either by in- creasing the availability and reducing the cost of climate- friendly goods and services, or by raising incomes. Cutting tariffs on wind turbines, for example, should lead to more of them being sold in a wider range of countries. Raising incomes is thought to lead to greater public demand for lower emissions on the basis that higher incomes give people more freedom to be concerned about non-monetary aspects of their wellbeing such as environmental quality. A number of attempts have been made to test the strength of these and other possible effects. The UN-WTO study reports that most come to the conclusion that the scale effect dominates: trade opening mostly increases emissions. For this reason poli- cies to expand trade, such as the implementation of new trade agreements, count as anti-climate policies. Transport The transport sector is where global emissions are rising fastest due to growth in the use of transport plus the fact that almost all land, sea and air transport is powered by fossil fuel combustion (Kahn Ribeiro et al., 2007), so policy initiatives that expand transport generally count as anti-climate policies. Fuel subsidies encourage transport use by reducing its cost. Measures to assist the automotive, aerospace and shipping in- dustries, if successful, increase their sales and transport use except to the extent that the higher sales in one place are at the expense of lower sales elsewhere. Providing new transport infrastructure, or encouraging its provision by the private sector, is likely to increase transport use by making travel quicker, easier or cheaper. Allowing, encouraging or constructing low density urban development increases the distances that resi- dents and users have to travel and thereby increases trans- port-related carbon emissions except to the extent that low car- bon transport is integral. Agriculture Some agricultural practices emit greater amounts of green- house gases than others. Methane is produced in abundance by ruminant livestock, cultivating rice in flooded conditions, and irrigation. Nitrous oxide is produced by animal manures and nitrogen-based fertilizers where these are over-used (Smith et al., 2007: 501-504). To the extent that these practices are pro- moted by new policies, intentionally or as a side-effect, the new initiatives are anti-climate policies. Anti-climate policies in agriculture therefore include incentives for farmers to expand meat production, incentives to expand the area of rice grown in flooded conditions, provision of subsidies for nitrogenous fer- tilizers, and the provision, financing or encouragement of irri- gation schemes. Forestry Because forest clearing reduces CO2 uptake from the atmos- phere, anti-climate policies in the forestry sector are those that permit, encourage or carry out clearing of forests for farmland, settlements, roads, mines, or non-sustainable timber production. Population More people mean higher emissions, other things being equal, especially in developed countries where per capita carbon emissions are high. Policy initiatives designed to encourage people to have more children, or which can reasonably be ex- pected to have this effect, therefore count as anti-climate poli- cies. These include policies that make it easier for women to combine paid work and caring for children, such as the provi- sion or financing of affordable childcare. Other policies that may increase birthrates include cash payments to families with children; tax breaks for families with children; maternity, pa- ternity and parental leaves; assistance for lone parents; and establishing legal rights to flexible working (Daly, 2004; Kilkey, 2004). Placing new restrictions on contraception, IVF or abortion would also be expected to result in more children being born, so would also count as anti-climate policies. It does sound odd to characterize policies such as increased spending on childcare as anti-climate policies. The expert lit- erature in this area has little if anything to say about climate change, it would be surprising if greenhouse gas emissions are a factor in the formulation of childcare or similar policies, and potential and actual clients are most unlikely to think of such policies as adding to emissions. In addition, the academic and expert literature is divided on whether policies designed to make it easier for women to combine paid work and caring for children actually result in significant numbers of additional children being born (see, for example, Kalwij, 2010; Del Boca et al., 2008). Nevertheless the logic is clear: insofar as they do increase birthrates, family policies must be counted as anti- climate policies. Macro-Economy The causal connection between economic growth and carbon emissions means that any policy that increases economic activ- ity in general will also increase emissions except to the extent that economic activity is “decoupled” from emissions growth and the additional activity is carbon neutral. Although there is some evidence that growth is becoming decoupled from emis- sions, this remains patchy (see Porter & van der Linde (1995) for an early discussion of decoupling; Jackson (2009) for a useful critique; and van den Bergh (2011) for a mid-way per- spective). The main policies used to stimulate the economy as a whole are expansionary fiscal policies (tax cuts and/or spending increases) and cuts in interest rates. These are therefore anti- climate policies. Copyright © 2013 SciRes. 149 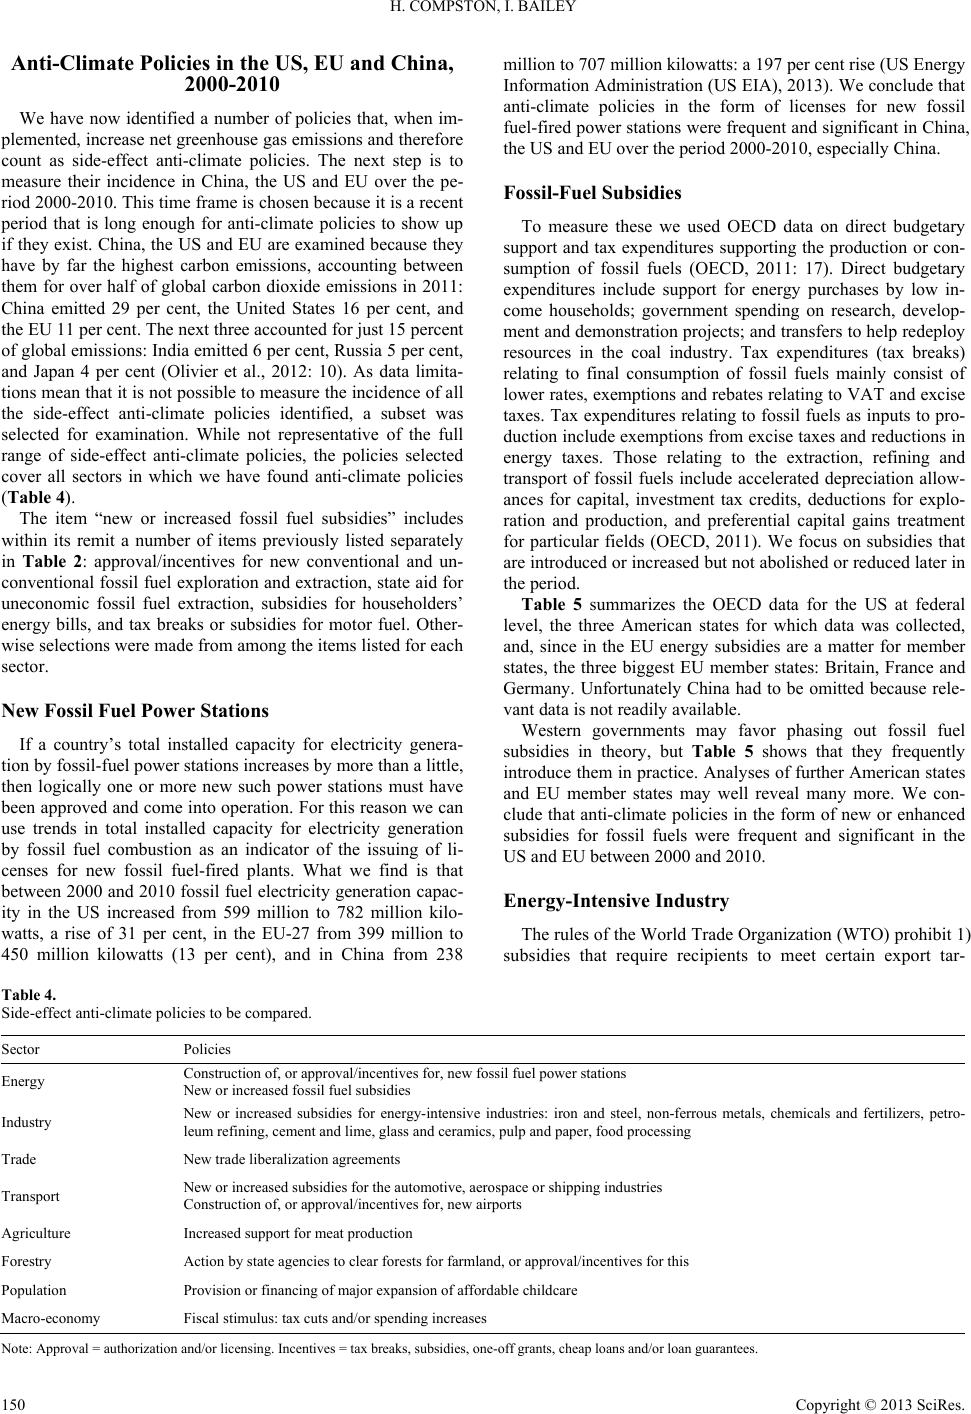 H. COMPSTON, I. BAILEY Copyright © 2013 SciRes. 150 Anti-Climate Policies in the US, EU and China, 2000-2010 We have now identified a number of policies that, when im- plemented, increase net greenhouse gas emissions and therefore count as side-effect anti-climate policies. The next step is to measure their incidence in China, the US and EU over the pe- riod 2000-2010. This time frame is chosen because it is a recent period that is long enough for anti-climate policies to show up if they exist. China, the US and EU are examined because they have by far the highest carbon emissions, accounting between them for over half of global carbon dioxide emissions in 2011: China emitted 29 per cent, the United States 16 per cent, and the EU 11 per cent. The next three accounted for just 15 percent of global emissions: India emitted 6 per cent, Russia 5 per cent, and Japan 4 per cent (Olivier et al., 2012: 10). As data limita- tions mean that it is not possible to measure the incidence of all the side-effect anti-climate policies identified, a subset was selected for examination. While not representative of the full range of side-effect anti-climate policies, the policies selected cover all sectors in which we have found anti-climate policies (Table 4). The item “new or increased fossil fuel subsidies” includes within its remit a number of items previously listed separately in Table 2: approval/incentives for new conventional and un- conventional fossil fuel exploration and extraction, state aid for uneconomic fossil fuel extraction, subsidies for householders’ energy bills, and tax breaks or subsidies for motor fuel. Other- wise selections were made from among the items listed for each sector. New Fossil Fuel Power Stations If a country’s total installed capacity for electricity genera- tion by fossil-fuel power stations increases by more than a little, then logically one or more new such power stations must have been approved and come into operation. For this reason we can use trends in total installed capacity for electricity generation by fossil fuel combustion as an indicator of the issuing of li- censes for new fossil fuel-fired plants. What we find is that between 2000 and 2010 fossil fuel electricity generation capac- ity in the US increased from 599 million to 782 million kilo- watts, a rise of 31 per cent, in the EU-27 from 399 million to 450 million kilowatts (13 per cent), and in China from 238 million to 707 million kilowatts: a 197 per cent rise (US Energy Information Administration (US EIA), 2013). We conclude that anti-climate policies in the form of licenses for new fossil fuel-fired power stations were frequent and significant in China, the US and EU over the period 2000-2010, especially China. Fossil-Fuel Subsidies To measure these we used OECD data on direct budgetary support and tax expenditures supporting the production or con- sumption of fossil fuels (OECD, 2011: 17). Direct budgetary expenditures include support for energy purchases by low in- come households; government spending on research, develop- ment and demonstration projects; and transfers to help redeploy resources in the coal industry. Tax expenditures (tax breaks) relating to final consumption of fossil fuels mainly consist of lower rates, exemptions and rebates relating to VAT and excise taxes. Tax expenditures relating to fossil fuels as inputs to pro- duction include exemptions from excise taxes and reductions in energy taxes. Those relating to the extraction, refining and transport of fossil fuels include accelerated depreciation allow- ances for capital, investment tax credits, deductions for explo- ration and production, and preferential capital gains treatment for particular fields (OECD, 2011). We focus on subsidies that are introduced or increased but not abolished or reduced later in the period. Table 5 summarizes the OECD data for the US at federal level, the three American states for which data was collected, and, since in the EU energy subsidies are a matter for member states, the three biggest EU member states: Britain, France and Germany. Unfortunately China had to be omitted because rele- vant data is not readily available. Western governments may favor phasing out fossil fuel subsidies in theory, but Table 5 shows that they frequently introduce them in practice. Analyses of further American states and EU member states may well reveal many more. We con- clude that anti-climate policies in the form of new or enhanced subsidies for fossil fuels were frequent and significant in the US and EU between 2000 and 2010. Energy-Intensive Industry The rules of the World Trade Organization (WTO) prohibit 1) subsidies that require recipients to meet certain export tar- Table 4. Side-effect anti-climate policies to be compared. Sector Policies Energy Construction of, or approval/incentives for, new fossil fuel power stations New or increased fossil fuel subsidies Industry New or increased subsidies for energy-intensive industries: iron and steel, non-ferrous metals, chemicals and fertilizers, petro- leum refining, cement and lime, glass and ceramics, pulp and paper, food processing Trade New trade liberalization agreements Transport New or increased subsidies for the automotive, aerospace or shipping industries Construction of, or approval/incentives for, new airports Agriculture Increased support for meat production Forestry Action by state agencies to clear forests for farmland, or approval/incentives for this Population Provision or financing of major expansion of affordable childcare Macro-economy Fiscal stimulus: tax cuts and/or spending increases Note: Approval = authorization and/or licensing. Incentives = tax breaks, subsidies, one-off grants, cheap loans and/or loan guarantees. 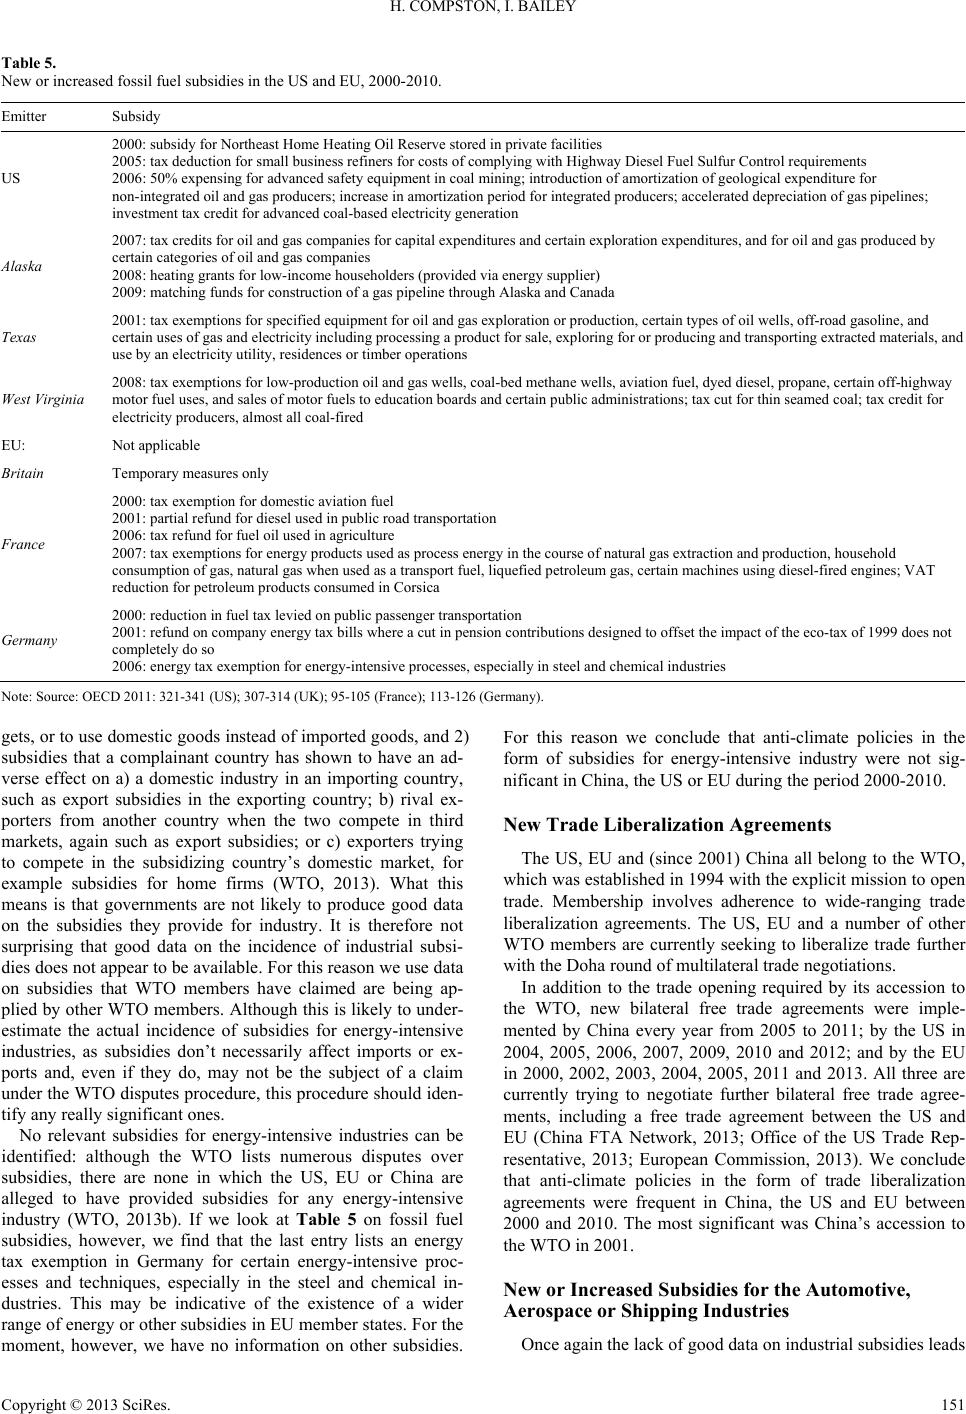 H. COMPSTON, I. BAILEY Table 5. New or increased fossil fuel subsidies in the US and EU, 2000-2010. Emitter Subsidy US 2000: subsidy for Northeast Home Heating Oil Reserve stored in private facilities 2005: tax deduction for small business refiners for costs of complying with Highway Diesel Fuel Sulfur Control requirements 2006: 50% expensing for advanced safety equipment in coal mining; introduction of amortization of geological expenditure for non-integrated oil and gas producers; increase in amortization period for integrated producers; accelerated depreciation of gas pipelines; investment tax credit for advanced coal-based electricity generation Alaska 2007: tax credits for oil and gas companies for capital expenditures and certain exploration expenditures, and for oil and gas produced by certain categories of oil and gas companies 2008: heating grants for low-income householders (provided via energy supplier) 2009: matching funds for construction of a gas pipeline through Alaska and Canada Texas 2001: tax exemptions for specified equipment for oil and gas exploration or production, certain types of oil wells, off-road gasoline, and certain uses of gas and electricity including processing a product for sale, exploring for or producing and transporting extracted materials, and use by an electricity utility, residences or timber operations West Virginia 2008: tax exemptions for low-production oil and gas wells, coal-bed methane wells, aviation fuel, dyed diesel, propane, certain off-highway motor fuel uses, and sales of motor fuels to education boards and certain public administrations; tax cut for thin seamed coal; tax credit for electricity producers, almost all coal-fired EU: Not applicable Britain Temporary measures only France 2000: tax exemption for domestic aviation fuel 2001: partial refund for diesel used in public road transportation 2006: tax refund for fuel oil used in agriculture 2007: tax exemptions for energy products used as process energy in the course of natural gas extraction and production, household consumption of gas, natural gas when used as a transport fuel, liquefied petroleum gas, certain machines using diesel-fired engines; VAT reduction for petroleum products consumed in Corsica Germany 2000: reduction in fuel tax levied on public passenger transportation 2001: refund on company energy tax bills where a cut in pension contributions designed to offset the impact of the eco-tax of 1999 does not completely do so 2006: energy tax exemption for energy-intensive processes, especially in steel and chemical industries Note: Source: OECD 2011: 321-341 (US); 307-314 (UK); 95-105 (France); 113-126 (Germany). gets, or to use domestic goods instead of imported goods, and 2) subsidies that a complainant country has shown to have an ad- verse effect on a) a domestic industry in an importing country, such as export subsidies in the exporting country; b) rival ex- porters from another country when the two compete in third markets, again such as export subsidies; or c) exporters trying to compete in the subsidizing country’s domestic market, for example subsidies for home firms (WTO, 2013). What this means is that governments are not likely to produce good data on the subsidies they provide for industry. It is therefore not surprising that good data on the incidence of industrial subsi- dies does not appear to be available. For this reason we use data on subsidies that WTO members have claimed are being ap- plied by other WTO members. Although this is likely to under- estimate the actual incidence of subsidies for energy-intensive industries, as subsidies don’t necessarily affect imports or ex- ports and, even if they do, may not be the subject of a claim under the WTO disputes procedure, this procedure should iden- tify any really significant ones. No relevant subsidies for energy-intensive industries can be identified: although the WTO lists numerous disputes over subsidies, there are none in which the US, EU or China are alleged to have provided subsidies for any energy-intensive industry (WTO, 2013b). If we look at Table 5 on fossil fuel subsidies, however, we find that the last entry lists an energy tax exemption in Germany for certain energy-intensive proc- esses and techniques, especially in the steel and chemical in- dustries. This may be indicative of the existence of a wider range of energy or other subsidies in EU member states. For the moment, however, we have no information on other subsidies. For this reason we conclude that anti-climate policies in the form of subsidies for energy-intensive industry were not sig- nificant in China, the US or EU during the period 2000-2010. New Trade Liberalization Agreements The US, EU and (since 2001) China all belong to the WTO, which was established in 1994 with the explicit mission to open trade. Membership involves adherence to wide-ranging trade liberalization agreements. The US, EU and a number of other WTO members are currently seeking to liberalize trade further with the Doha round of multilateral trade negotiations. In addition to the trade opening required by its accession to the WTO, new bilateral free trade agreements were imple- mented by China every year from 2005 to 2011; by the US in 2004, 2005, 2006, 2007, 2009, 2010 and 2012; and by the EU in 2000, 2002, 2003, 2004, 2005, 2011 and 2013. All three are currently trying to negotiate further bilateral free trade agree- ments, including a free trade agreement between the US and EU (China FTA Network, 2013; Office of the US Trade Rep- resentative, 2013; European Commission, 2013). We conclude that anti-climate policies in the form of trade liberalization agreements were frequent in China, the US and EU between 2000 and 2010. The most significant was China’s accession to the WTO in 2001. New or In creased Sub sidies for the Automotive, Aerospace or Shipping Industries Once again the lack of good data on industrial subsidies leads Copyright © 2013 SciRes. 151 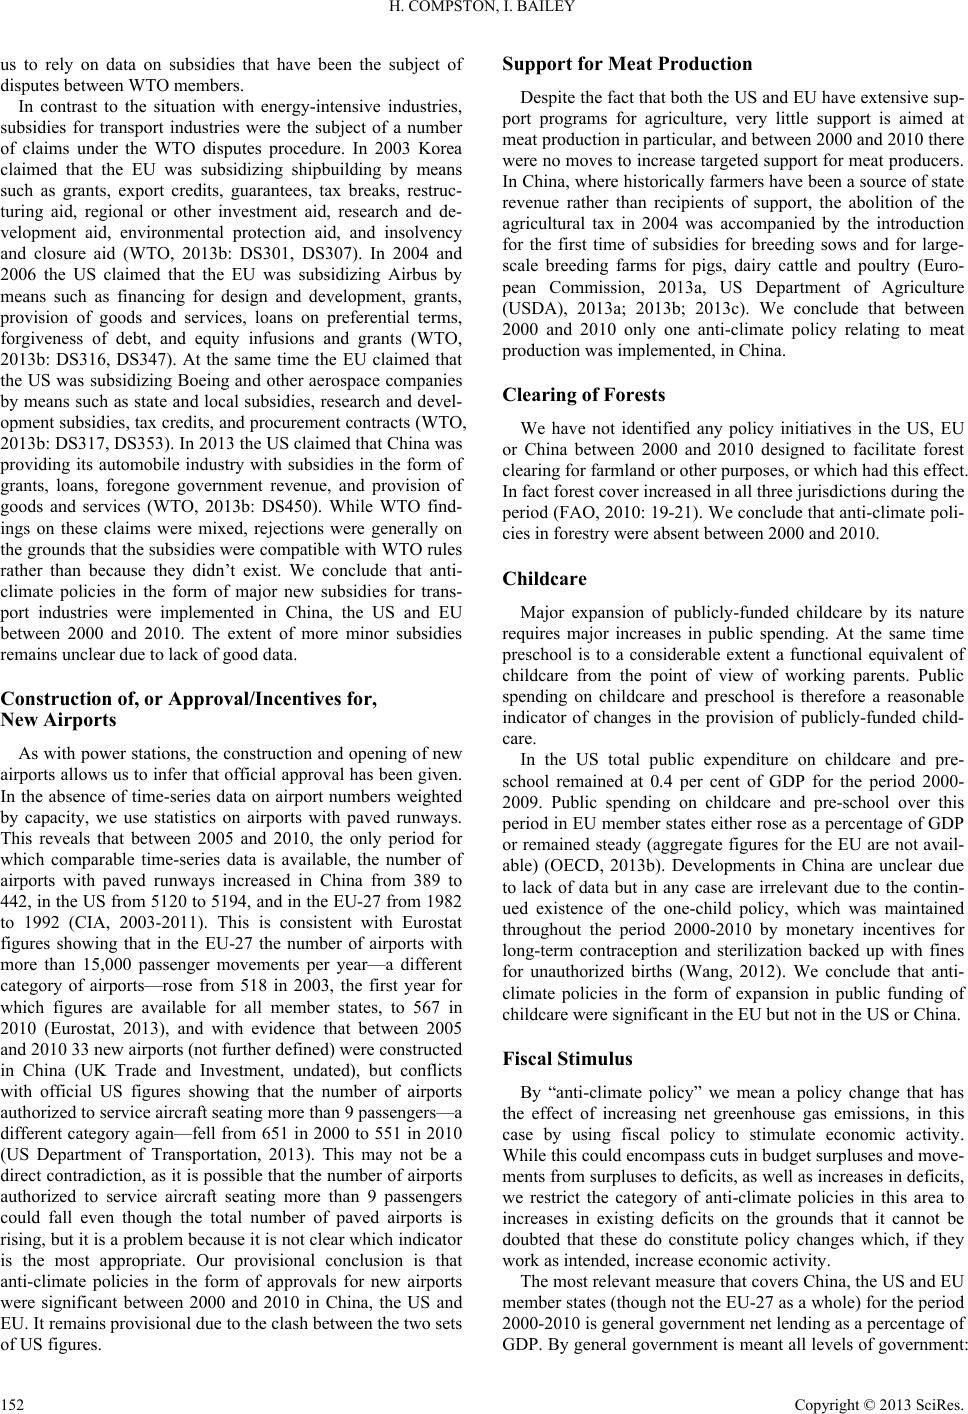 H. COMPSTON, I. BAILEY us to rely on data on subsidies that have been the subject of disputes between WTO members. In contrast to the situation with energy-intensive industries, subsidies for transport industries were the subject of a number of claims under the WTO disputes procedure. In 2003 Korea claimed that the EU was subsidizing shipbuilding by means such as grants, export credits, guarantees, tax breaks, restruc- turing aid, regional or other investment aid, research and de- velopment aid, environmental protection aid, and insolvency and closure aid (WTO, 2013b: DS301, DS307). In 2004 and 2006 the US claimed that the EU was subsidizing Airbus by means such as financing for design and development, grants, provision of goods and services, loans on preferential terms, forgiveness of debt, and equity infusions and grants (WTO, 2013b: DS316, DS347). At the same time the EU claimed that the US was subsidizing Boeing and other aerospace companies by means such as state and local subsidies, research and devel- opment subsidies, tax credits, and procurement contracts (WTO, 2013b: DS317, DS353). In 2013 the US claimed that China was providing its automobile industry with subsidies in the form of grants, loans, foregone government revenue, and provision of goods and services (WTO, 2013b: DS450). While WTO find- ings on these claims were mixed, rejections were generally on the grounds that the subsidies were compatible with WTO rules rather than because they didn’t exist. We conclude that anti- climate policies in the form of major new subsidies for trans- port industries were implemented in China, the US and EU between 2000 and 2010. The extent of more minor subsidies remains unclear due to lack of good data. Construction of, or Appr oval/Incentives for, New Airports As with power stations, the construction and opening of new airports allows us to infer that official approval has been given. In the absence of time-series data on airport numbers weighted by capacity, we use statistics on airports with paved runways. This reveals that between 2005 and 2010, the only period for which comparable time-series data is available, the number of airports with paved runways increased in China from 389 to 442, in the US from 5120 to 5194, and in the EU-27 from 1982 to 1992 (CIA, 2003-2011). This is consistent with Eurostat figures showing that in the EU-27 the number of airports with more than 15,000 passenger movements per year—a different category of airports—rose from 518 in 2003, the first year for which figures are available for all member states, to 567 in 2010 (Eurostat, 2013), and with evidence that between 2005 and 2010 33 new airports (not further defined) were constructed in China (UK Trade and Investment, undated), but conflicts with official US figures showing that the number of airports authorized to service aircraft seating more than 9 passengers—a different category again—fell from 651 in 2000 to 551 in 2010 (US Department of Transportation, 2013). This may not be a direct contradiction, as it is possible that the number of airports authorized to service aircraft seating more than 9 passengers could fall even though the total number of paved airports is rising, but it is a problem because it is not clear which indicator is the most appropriate. Our provisional conclusion is that anti-climate policies in the form of approvals for new airports were significant between 2000 and 2010 in China, the US and EU. It remains provisional due to the clash between the two sets of US figures. Support for Meat Production Despite the fact that both the US and EU have extensive sup- port programs for agriculture, very little support is aimed at meat production in particular, and between 2000 and 2010 there were no moves to increase targeted support for meat producers. In China, where historically farmers have been a source of state revenue rather than recipients of support, the abolition of the agricultural tax in 2004 was accompanied by the introduction for the first time of subsidies for breeding sows and for large- scale breeding farms for pigs, dairy cattle and poultry (Euro- pean Commission, 2013a, US Department of Agriculture (USDA), 2013a; 2013b; 2013c). We conclude that between 2000 and 2010 only one anti-climate policy relating to meat production was implemented, in China. Clearing of Forests We have not identified any policy initiatives in the US, EU or China between 2000 and 2010 designed to facilitate forest clearing for farmland or other purposes, or which had this effect. In fact forest cover increased in all three jurisdictions during the period (FAO, 2010: 19-21). We conclude that anti-climate poli- cies in forestry were absent between 2000 and 2010. Childcare Major expansion of publicly-funded childcare by its nature requires major increases in public spending. At the same time preschool is to a considerable extent a functional equivalent of childcare from the point of view of working parents. Public spending on childcare and preschool is therefore a reasonable indicator of changes in the provision of publicly-funded child- care. In the US total public expenditure on childcare and pre- school remained at 0.4 per cent of GDP for the period 2000- 2009. Public spending on childcare and pre-school over this period in EU member states either rose as a percentage of GDP or remained steady (aggregate figures for the EU are not avail- able) (OECD, 2013b). Developments in China are unclear due to lack of data but in any case are irrelevant due to the contin- ued existence of the one-child policy, which was maintained throughout the period 2000-2010 by monetary incentives for long-term contraception and sterilization backed up with fines for unauthorized births (Wang, 2012). We conclude that anti- climate policies in the form of expansion in public funding of childcare were significant in the EU but not in the US or China. Fiscal Stimulus By “anti-climate policy” we mean a policy change that has the effect of increasing net greenhouse gas emissions, in this case by using fiscal policy to stimulate economic activity. While this could encompass cuts in budget surpluses and move- ments from surpluses to deficits, as well as increases in deficits, we restrict the category of anti-climate policies in this area to increases in existing deficits on the grounds that it cannot be doubted that these do constitute policy changes which, if they work as intended, increase economic activity. The most relevant measure that covers China, the US and EU member states (though not the EU-27 as a whole) for the period 2000-2010 is general government net lending as a percentage of GDP. By general government is meant all levels of government: Copyright © 2013 SciRes. 152 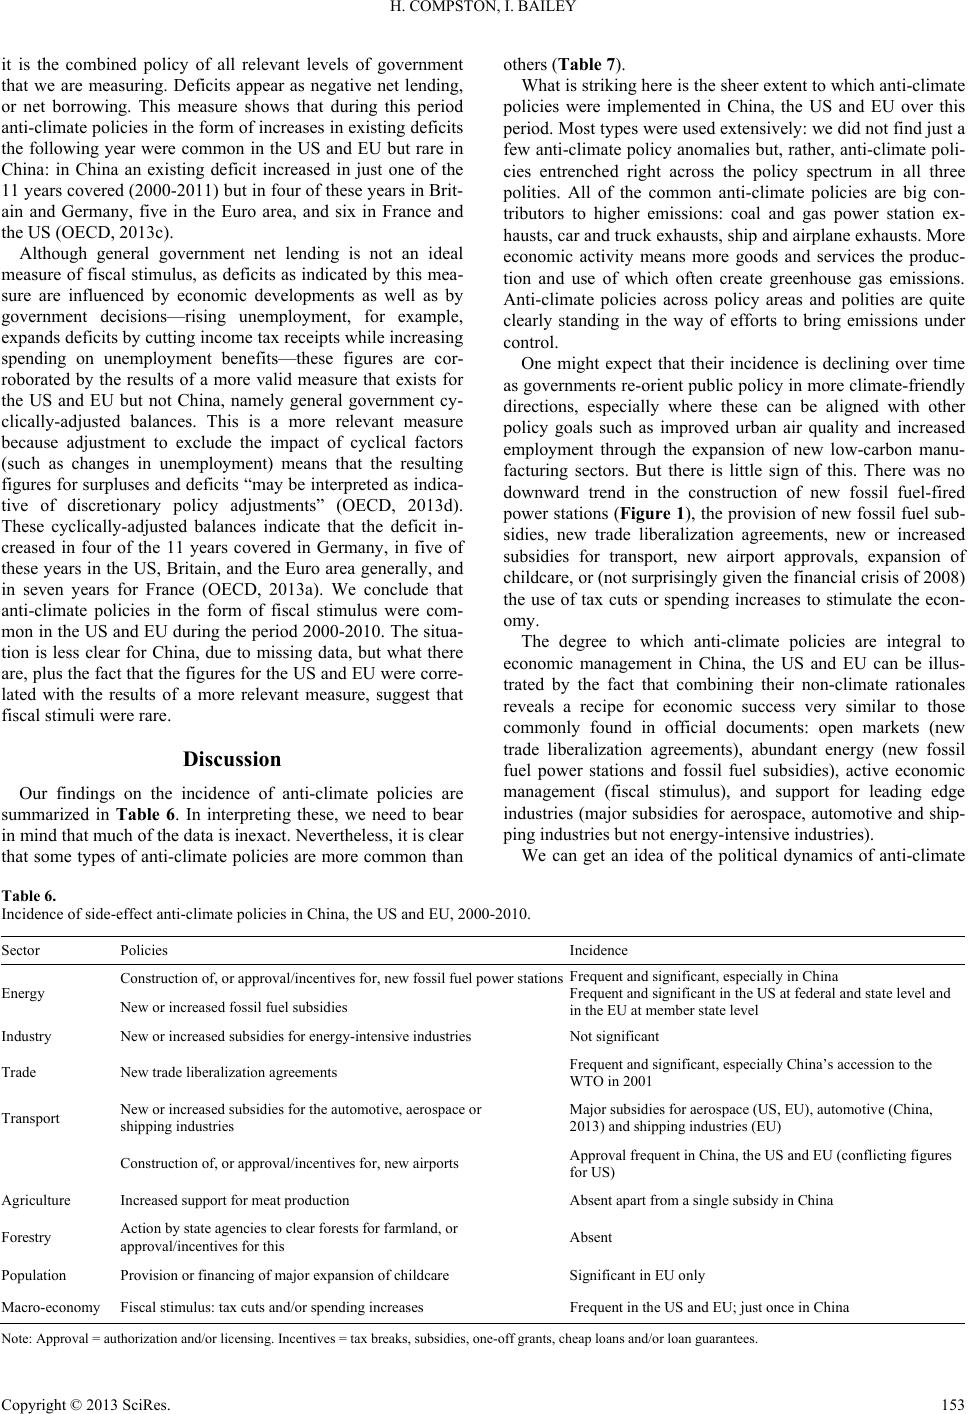 H. COMPSTON, I. BAILEY Copyright © 2013 SciRes. 153 it is the combined policy of all relevant levels of government that we are measuring. Deficits appear as negative net lending, or net borrowing. This measure shows that during this period anti-climate policies in the form of increases in existing deficits the following year were common in the US and EU but rare in China: in China an existing deficit increased in just one of the 11 years covered (2000-2011) but in four of these years in Brit- ain and Germany, five in the Euro area, and six in France and the US (OECD, 2013c). Although general government net lending is not an ideal measure of fiscal stimulus, as deficits as indicated by this mea- sure are influenced by economic developments as well as by government decisions—rising unemployment, for example, expands deficits by cutting income tax receipts while increasing spending on unemployment benefits—these figures are cor- roborated by the results of a more valid measure that exists for the US and EU but not China, namely general government cy- clically-adjusted balances. This is a more relevant measure because adjustment to exclude the impact of cyclical factors (such as changes in unemployment) means that the resulting figures for surpluses and deficits “may be interpreted as indica- tive of discretionary policy adjustments” (OECD, 2013d). These cyclically-adjusted balances indicate that the deficit in- creased in four of the 11 years covered in Germany, in five of these years in the US, Britain, and the Euro area generally, and in seven years for France (OECD, 2013a). We conclude that anti-climate policies in the form of fiscal stimulus were com- mon in the US and EU during the period 2000-2010. The situa- tion is less clear for China, due to missing data, but what there are, plus the fact that the figures for the US and EU were corre- lated with the results of a more relevant measure, suggest that fiscal stimuli were rare. Discussion Our findings on the incidence of anti-climate policies are summarized in Table 6. In interpreting these, we need to bear in mind that much of the data is inexact. Nevertheless, it is clear that some types of anti-climate policies are more common than others (Table 7). What is striking here is the sheer extent to which anti-climate policies were implemented in China, the US and EU over this period. Most types were used extensively: we did not find just a few anti-climate policy anomalies but, rather, anti-climate poli- cies entrenched right across the policy spectrum in all three polities. All of the common anti-climate policies are big con- tributors to higher emissions: coal and gas power station ex- hausts, car and truck exhausts, ship and airplane exhausts. More economic activity means more goods and services the produc- tion and use of which often create greenhouse gas emissions. Anti-climate policies across policy areas and polities are quite clearly standing in the way of efforts to bring emissions under control. One might expect that their incidence is declining over time as governments re-orient public policy in more climate-friendly directions, especially where these can be aligned with other policy goals such as improved urban air quality and increased employment through the expansion of new low-carbon manu- facturing sectors. But there is little sign of this. There was no downward trend in the construction of new fossil fuel-fired power stations (Figure 1), the provision of new fossil fuel sub- sidies, new trade liberalization agreements, new or increased subsidies for transport, new airport approvals, expansion of childcare, or (not surprisingly given the financial crisis of 2008) the use of tax cuts or spending increases to stimulate the econ- omy. The degree to which anti-climate policies are integral to economic management in China, the US and EU can be illus- trated by the fact that combining their non-climate rationales reveals a recipe for economic success very similar to those commonly found in official documents: open markets (new trade liberalization agreements), abundant energy (new fossil fuel power stations and fossil fuel subsidies), active economic management (fiscal stimulus), and support for leading edge industries (major subsidies for aerospace, automotive and ship- ping industries but not energy-intensive industries). We can get an idea of the political dynamics of anti-climate Table 6. Incidence of side-effect anti-climate policies in China, the US and EU, 2000-2010. Sector Policies Incidence Energy Construction of, or approval/incentives for, new fossil fuel power stations New or increased fossil fuel subsidies Frequent and significant, especially in China Frequent and significant in the US at federal and state level and in the EU at member state level Industry New or increased subsidies for energy-intensive industries Not significant Trade New trade liberalization agreements Frequent and significant, especially China’s accession to the WTO in 2001 Transport New or increased subsidies for the automotive, aerospace or shipping industries Major subsidies for aerospace (US, EU), automotive (China, 2013) and shipping industries (EU) Construction of, or approval/incentives for, new airports Approval frequent in China, the US and EU (conflicting figures for US) Agriculture Increased support for meat production Absent apart from a single subsidy in China Forestry Action by state agencies to clear forests for farmland, or approval/incentives for this Absent Population Provision or financing of major expansion of childcare Significant in EU only Macro-economy Fiscal stimulus: tax cuts and/or spending increases Frequent in the US and EU; just once in China Note: Approval = authorization and/or licensing. Incentives = tax breaks, subsidies, one-off grants, cheap loans and/or loan guarantees. 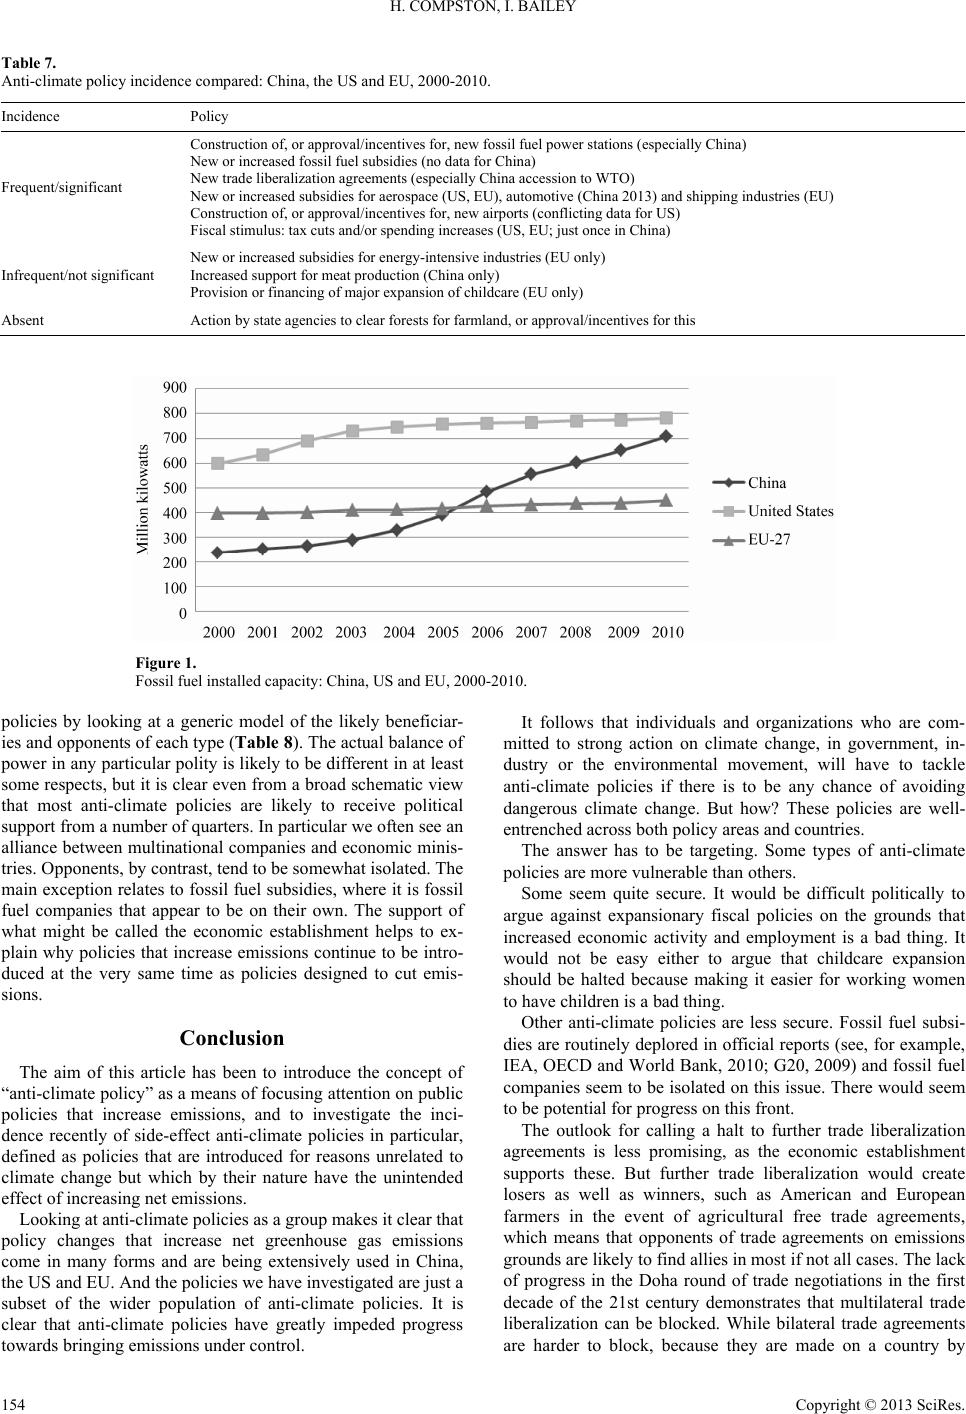 H. COMPSTON, I. BAILEY Table 7. Anti-climate policy incidence compared: China, the US and EU, 2000-2010. Incidence Policy Frequent/significant Construction of, or approval/incentives for, new fossil fuel power stations (especially China) New or increased fossil fuel subsidies (no data for China) New trade liberalization agreements (especially China accession to WTO) New or increased subsidies for aerospace (US, EU), automotive (China 2013) and shipping industries (EU) Construction of, or approval/incentives for, new airports (conflicting data for US) Fiscal stimulus: tax cuts and/or spending increases (US, EU; just once in China) Infrequent/not significant New or increased subsidies for energy-intensive industries (EU only) Increased support for meat production (China only) Provision or financing of major expansion of childcare (EU only) Absent Action by state agencies to clear forests for farmland, or approval/incentives for this Figure 1. Fossil fuel installed capacity: China, US and EU, 2000-2010. policies by looking at a generic model of the likely beneficiar- ies and opponents of each type (Table 8). The actual balance of power in any particular polity is likely to be different in at least some respects, but it is clear even from a broad schematic view that most anti-climate policies are likely to receive political support from a number of quarters. In particular we often see an alliance between multinational companies and economic minis- tries. Opponents, by contrast, tend to be somewhat isolated. The main exception relates to fossil fuel subsidies, where it is fossil fuel companies that appear to be on their own. The support of what might be called the economic establishment helps to ex- plain why policies that increase emissions continue to be intro- duced at the very same time as policies designed to cut emis- sions. Conclusion The aim of this article has been to introduce the concept of “anti-climate policy” as a means of focusing attention on public policies that increase emissions, and to investigate the inci- dence recently of side-effect anti-climate policies in particular, defined as policies that are introduced for reasons unrelated to climate change but which by their nature have the unintended effect of increasing net emissions. Looking at anti-climate policies as a group makes it clear that policy changes that increase net greenhouse gas emissions come in many forms and are being extensively used in China, the US and EU. And the policies we have investigated are just a subset of the wider population of anti-climate policies. It is clear that anti-climate policies have greatly impeded progress towards bringing emissions under control. It follows that individuals and organizations who are com- mitted to strong action on climate change, in government, in- dustry or the environmental movement, will have to tackle anti-climate policies if there is to be any chance of avoiding dangerous climate change. But how? These policies are well- entrenched across both policy areas and countries. The answer has to be targeting. Some types of anti-climate policies are more vulnerable than others. Some seem quite secure. It would be difficult politically to argue against expansionary fiscal policies on the grounds that increased economic activity and employment is a bad thing. It would not be easy either to argue that childcare expansion should be halted because making it easier for working women to have children is a bad thing. Other anti-climate policies are less secure. Fossil fuel subsi- dies are routinely deplored in official reports (see, for example, IEA, OECD and World Bank, 2010; G20, 2009) and fossil fuel companies seem to be isolated on this issue. There would seem to be potential for progress on this front. The outlook for calling a halt to further trade liberalization agreements is less promising, as the economic establishment supports these. But further trade liberalization would create losers as well as winners, such as American and European farmers in the event of agricultural free trade agreements, which means that opponents of trade agreements on emissions grounds are likely to find allies in most if not all cases. The lack of progress in the Doha round of trade negotiations in the first decade of the 21st century demonstrates that multilateral trade liberalization can be blocked. While bilateral trade agreements are harder to block, because they are made on a country by Copyright © 2013 SciRes. 154 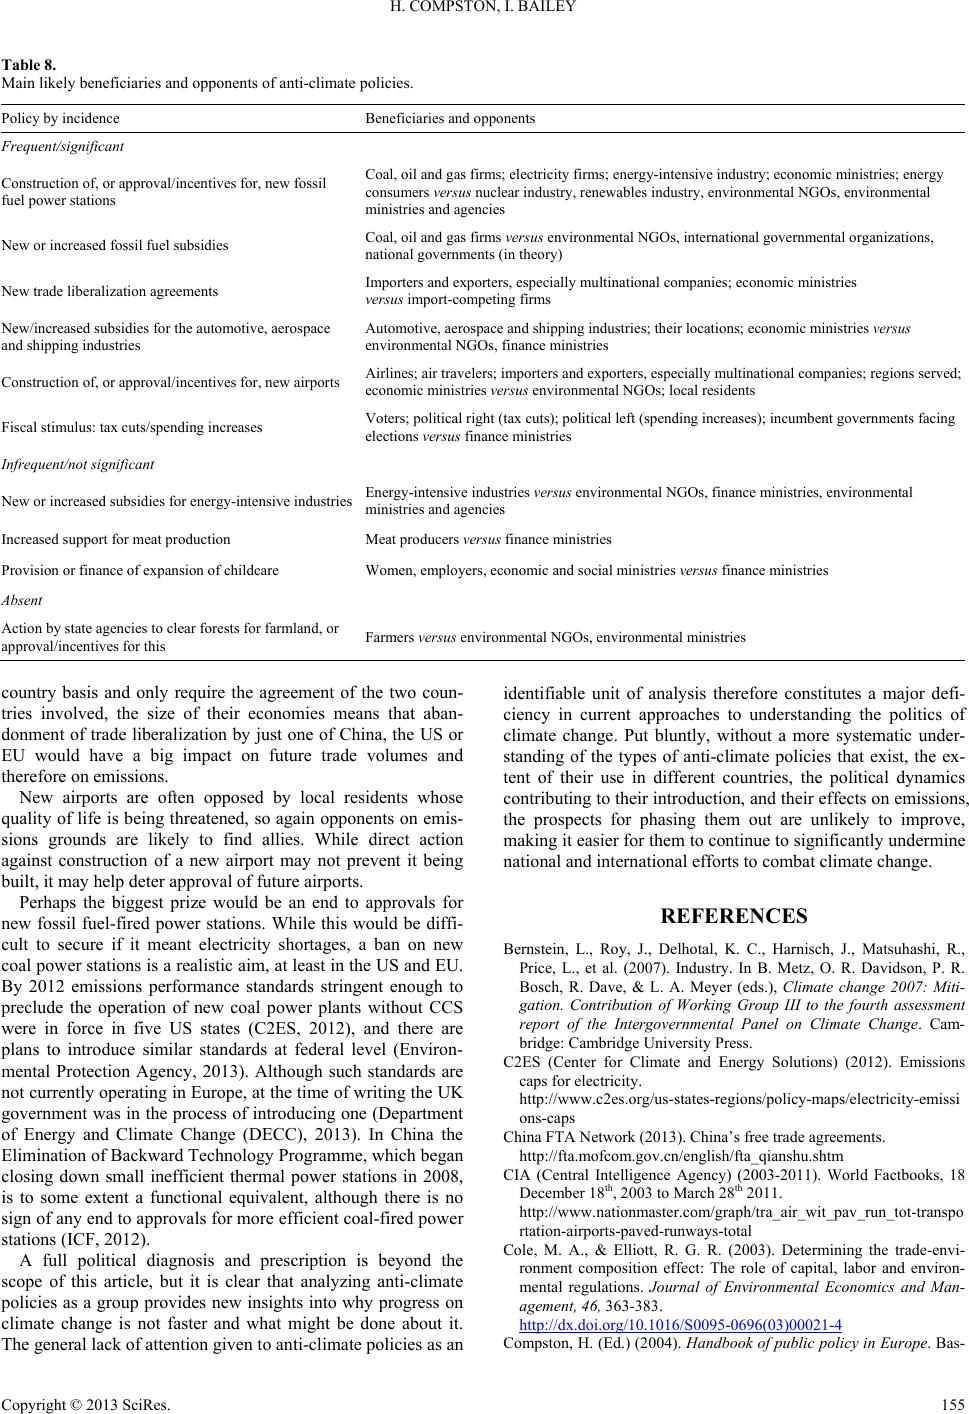 H. COMPSTON, I. BAILEY Table 8. Main likely beneficiaries and opponents of anti-climate policies. Policy by incidence Beneficiaries and opponents Frequent/significant Construction of, or approval/incentives for, new fossil fuel power stations Coal, oil and gas firms; electricity firms; energy-intensive industry; economic ministries; energy consumers versus nuclear industry, renewables industry, environmental NGOs, environmental ministries and agencies New or increased fossil fuel subsidies Coal, oil and gas firms versus environmental NGOs, international governmental organizations, national governments (in theory) New trade liberalization agreements Importers and exporters, especially multinational companies; economic ministries versus import-competing firms New/increased subsidies for the automotive, aerospace and shipping industries Automotive, aerospace and shipping industries; their locations; economic ministries versus environmental NGOs, finance ministries Construction of, or approval/incentives for, new airports Airlines; air travelers; importers and exporters, especially multinational companies; regions served; economic ministries versus environmental NGOs; local residents Fiscal stimulus: tax cuts/spending increases Voters; political right (tax cuts); political left (spending increases); incumbent governments facing elections versus finance ministries Infrequent/not significant New or increased subsidies for energy-intensive industries Energy-intensive industries versus environmental NGOs, finance ministries, environmental ministries and agencies Increased support for meat production Meat producers versus finance ministries Provision or finance of expansion of childcare Women, employers, economic and social ministries versus finance ministries Absent Action by state agencies to clear forests for farmland, or approval/incentives for this Farmers versus environmental NGOs, environmental ministries country basis and only require the agreement of the two coun- tries involved, the size of their economies means that aban- donment of trade liberalization by just one of China, the US or EU would have a big impact on future trade volumes and therefore on emissions. New airports are often opposed by local residents whose quality of life is being threatened, so again opponents on emis- sions grounds are likely to find allies. While direct action against construction of a new airport may not prevent it being built, it may help deter approval of future airports. Perhaps the biggest prize would be an end to approvals for new fossil fuel-fired power stations. While this would be diffi- cult to secure if it meant electricity shortages, a ban on new coal power stations is a realistic aim, at least in the US and EU. By 2012 emissions performance standards stringent enough to preclude the operation of new coal power plants without CCS were in force in five US states (C2ES, 2012), and there are plans to introduce similar standards at federal level (Environ- mental Protection Agency, 2013). Although such standards are not currently operating in Europe, at the time of writing the UK government was in the process of introducing one (Department of Energy and Climate Change (DECC), 2013). In China the Elimination of Backward Technology Programme, which began closing down small inefficient thermal power stations in 2008, is to some extent a functional equivalent, although there is no sign of any end to approvals for more efficient coal-fired power stations (ICF, 2012). A full political diagnosis and prescription is beyond the scope of this article, but it is clear that analyzing anti-climate policies as a group provides new insights into why progress on climate change is not faster and what might be done about it. The general lack of attention given to anti-climate policies as an identifiable unit of analysis therefore constitutes a major defi- ciency in current approaches to understanding the politics of climate change. Put bluntly, without a more systematic under- standing of the types of anti-climate policies that exist, the ex- tent of their use in different countries, the political dynamics contributing to their introduction, and their effects on emissions, the prospects for phasing them out are unlikely to improve, making it easier for them to continue to significantly undermine national and international efforts to combat climate change. REFERENCES Bernstein, L., Roy, J., Delhotal, K. C., Harnisch, J., Matsuhashi, R., Price, L., et al. (2007). Industry. In B. Metz, O. R. Davidson, P. R. Bosch, R. Dave, & L. A. Meyer (eds.), Climate change 2007: Miti- gation. Contribution of Working Group III to the fourth assessment report of the Intergovernmental Panel on Climate Change. Cam- bridge: Cambridge University Press. C2ES (Center for Climate and Energy Solutions) (2012). Emissions caps for electricity. http://www.c2es.org/us-states-regions/policy-maps/electricity-emissi ons-caps China FTA Network (2013). China’s free trade agreements. http://fta.mofcom.gov.cn/english/fta_qianshu.shtm CIA (Central Intelligence Agency) (2003-2011). World Factbooks, 18 December 18th, 2003 to March 28th 2011. http://www.nationmaster.com/graph/tra_air_wit_pav_run_tot-transpo rtation-airports-paved-runways-total Cole, M. A., & Elliott, R. G. R. (2003). Determining the trade-envi- ronment composition effect: The role of capital, labor and environ- mental regulations. Journal of Environmental Economics and Man- agement, 46, 363-383. http://dx.doi.org/10.1016/S0095-0696(03)00021-4 Compston, H. (Ed.) (2004). Handbook of public policy in Europe. Bas- Copyright © 2013 SciRes. 155 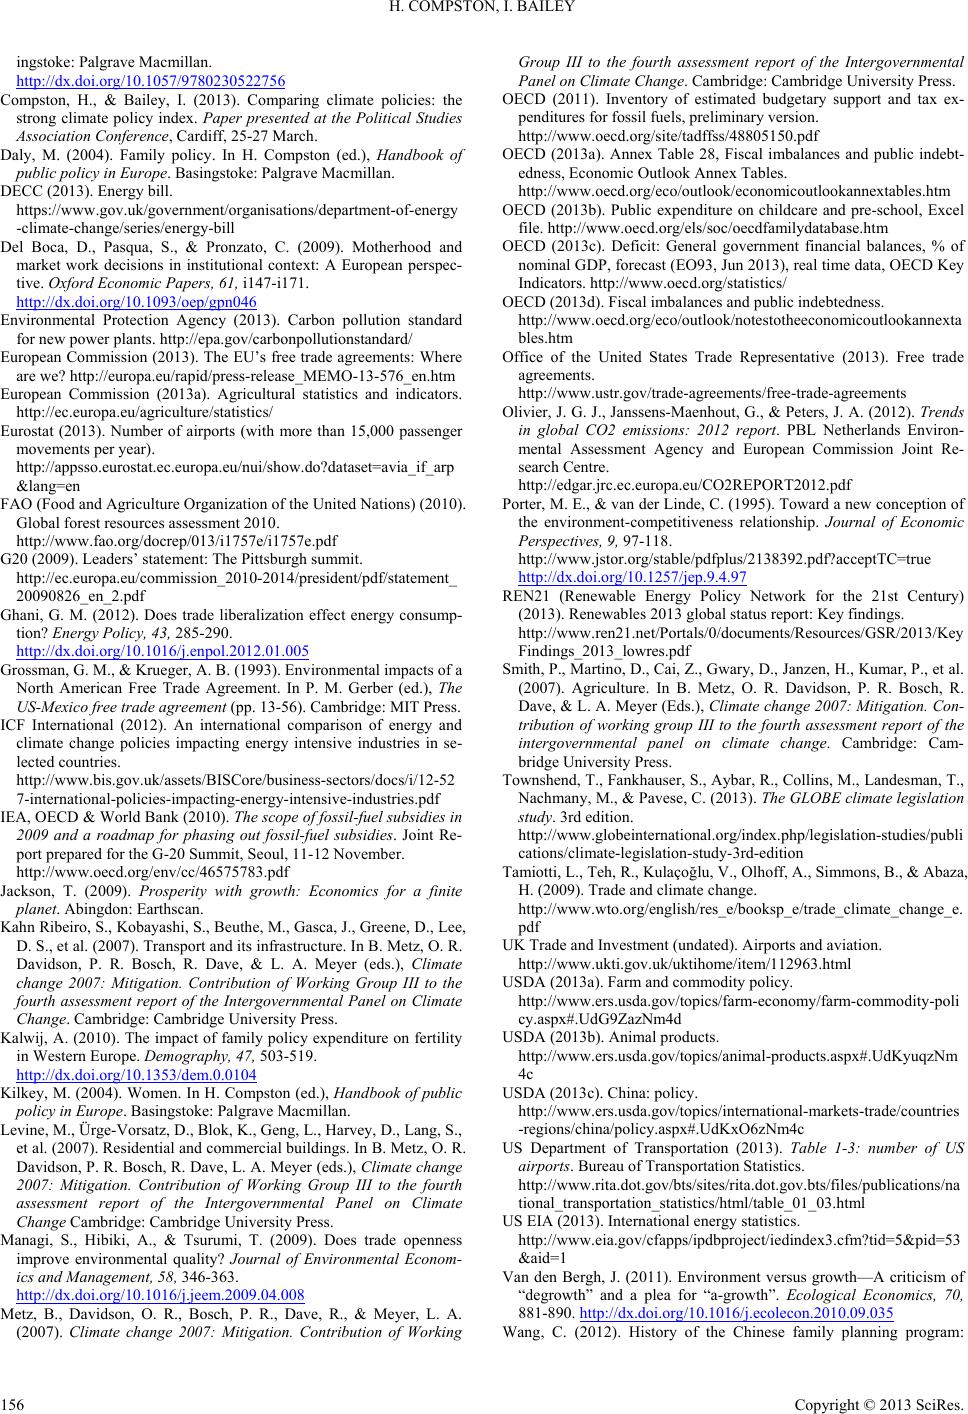 H. COMPSTON, I. BAILEY ingstoke: Palgrave Macmillan. http://dx.doi.org/10.1057/9780230522756 Compston, H., & Bailey, I. (2013). Comparing climate policies: the strong climate policy index. Paper presented at the Political Studies Association Conference, Cardiff, 25-27 March. Daly, M. (2004). Family policy. In H. Compston (ed.), Handbook of public policy in Europe . Basingstoke: Palgrave Macmillan. DECC (2013). Energy bill. https://www.gov.uk/government/organisations/department-of-energy -climate-change/series/energy-bill Del Boca, D., Pasqua, S., & Pronzato, C. (2009). Motherhood and market work decisions in institutional context: A European perspec- tive. Oxford Economic Papers, 61, i147-i171. http://dx.doi.org/10.1093/oep/gpn046 Environmental Protection Agency (2013). Carbon pollution standard for new power plants. http://epa.gov/carbonpollutionstandard/ European Commission (2013). The EU’s free trade agreements: Where are we? http://europa.eu/rapid/press-release_MEMO-13-576_en.htm European Commission (2013a). Agricultural statistics and indicators. http://ec.europa.eu/agriculture/statistics/ Eurostat (2013). Number of airports (with more than 15,000 passenger movements per year). http://appsso.eurostat.ec.europa.eu/nui/show.do?dataset=avia_if_arp &lang=en FAO (Food and Agriculture Organization of the United Nations) (2010). Global forest resources assessment 2010. http://www.fao.org/docrep/013/i1757e/i1757e.pdf G20 (2009). Leaders’ statement: The Pittsburgh summit. http://ec.europa.eu/commission_2010-2014/president/pdf/statement_ 20090826_en_2.pdf Ghani, G. M. (2012). Does trade liberalization effect energy consump- tion? Energy Policy, 43, 285-290. http://dx.doi.org/10.1016/j.enpol.2012.01.005 Grossman, G. M., & Krueger, A. B. (1993). Environmental impacts of a North American Free Trade Agreement. In P. M. Gerber (ed.), The US-Mexico free trade agreement (pp. 13-56). Cambridge: MIT Press. ICF International (2012). An international comparison of energy and climate change policies impacting energy intensive industries in se- lected countries. http://www.bis.gov.uk/assets/BISCore/business-sectors/docs/i/12-52 7-international-policies-impacting-energy-intensive-industries.pdf IEA, OECD & World Bank (2010). The scope of fossil-fuel subsidies in 2009 and a roadmap for phasing out fossil-fuel subsidies. Joint Re- port prepared for the G-20 Summit, Seoul, 11-12 November. http://www.oecd.org/env/cc/46575783.pdf Jackson, T. (2009). Prosperity with growth: Economics for a finite planet. Abingdon: Earthscan. Kahn Ribeiro, S., Kobayashi, S., Beuthe, M., Gasca, J., Greene, D., Lee, D. S., et al. (2007). Transport and its infrastructure. In B. Metz, O. R. Davidson, P. R. Bosch, R. Dave, & L. A. Meyer (eds.), Climate change 2007: Mitigation. Contribution of Working Group III to the fourth assessment report of the Intergovernmental Panel on Climate Change. Cambridge: Cambridge University Press. Kalwij, A. (2010). The impact of family policy expenditure on fertility in Western Europe. Demography, 47, 503-519. http://dx.doi.org/10.1353/dem.0.0104 Kilkey, M. (2004). Women. In H. Compston (ed.), Handbook of public policy in Europe. Basingstoke: Palgrave Macmillan. Levine, M., Ürge-Vorsatz, D., Blok, K., Geng, L., Harvey, D., Lang, S., et al. (2007). Residential and commercial buildings. In B. Metz, O. R. Davidson, P. R. Bosch, R. Dave, L. A. Meyer (eds.), Climate change 2007: Mitigation. Contribution of Working Group III to the fourth assessment report of the Intergovernmental Panel on Climate Change Cambridge: Cambridge University Press. Managi, S., Hibiki, A., & Tsurumi, T. (2009). Does trade openness improve environmental quality? Journal of Environmental Econom- ics and Management, 58, 346-363. http://dx.doi.org/10.1016/j.jeem.2009.04.008 Metz, B., Davidson, O. R., Bosch, P. R., Dave, R., & Meyer, L. A. (2007). Climate change 2007: Mitigation. Contribution of Working Group III to the fourth assessment report of the Intergovernmental Panel on Climate Change. Cambridge: Cambridge University Press. OECD (2011). Inventory of estimated budgetary support and tax ex- penditures for fossil fuels, preliminary version. http://www.oecd.org/site/tadffss/48805150.pdf OECD (2013a). Annex Table 28, Fiscal imbalances and public indebt- edness, Economic Outlook Annex Tables. http://www.oecd.org/eco/outlook/economicoutlookannextables.htm OECD (2013b). Public expenditure on childcare and pre-school, Excel file. http://www.oecd.org/els/soc/oecdfamilydatabase.htm OECD (2013c). Deficit: General government financial balances, % of nominal GDP, forecast (EO93, Jun 2013), real time data, OECD Key Indicators. http://www.oecd.org/statistics/ OECD (2013d). Fiscal imbalances and public indebtedness. http://www.oecd.org/eco/outlook/notestotheeconomicoutlookannexta bles.htm Office of the United States Trade Representative (2013). Free trade agreements. http://www.ustr.gov/trade-agreements/free-trade-agreements Olivier, J. G. J., Janssens-Maenhout, G., & Peters, J. A. (2012). Trends in global CO2 emissions: 2012 report. PBL Netherlands Environ- mental Assessment Agency and European Commission Joint Re- search Centre. http://edgar.jrc.ec.europa.eu/CO2REPORT2012.pdf Porter, M. E., & van der Linde, C. (1995). Toward a new conception of the environment-competitiveness relationship. Journal of Economic Perspectives, 9, 97-118. http://www.jstor.org/stable/pdfplus/2138392.pdf?acceptTC=true http://dx.doi.org/10.1257/jep.9.4.97 REN21 (Renewable Energy Policy Network for the 21st Century) (2013). Renewables 2013 global status report: Key findings. http://www.ren21.net/Portals/0/documents/Resources/GSR/2013/Key Findings_2013_lowres.pdf Smith, P., Martino, D., Cai, Z., Gwary, D., Janzen, H., Kumar, P., et al. (2007). Agriculture. In B. Metz, O. R. Davidson, P. R. Bosch, R. Dave, & L. A. Meyer (Eds.), Climate change 2007: Mitigation. Con- tribution of working group III to the fourth assessment report of the intergovernmental panel on climate change. Cambridge: Cam- bridge University Press. Townshend, T., Fankhauser, S., Aybar, R., Collins, M., Landesman, T., Nachmany, M., & Pavese, C. (2013). The GLOBE clima te legislation study. 3rd edition. http://www.globeinternational.org/index.php/legislation-studies/publi cations/climate-legislation-study-3rd-edition Tamiotti, L., Teh, R., Kulaçoğlu, V., Olhoff, A., Simmons, B., & Abaza, H. (2009). Trade and climate change. http://www.wto.org/english/res_e/booksp_e/trade_climate_change_e. pdf UK Trade and Investment (undated). Airports and aviation. http://www.ukti.gov.uk/uktihome/item/112963.html USDA (2013a). Farm and commodity policy. http://www.ers.usda.gov/topics/farm-economy/farm-commodity-poli cy.aspx#.UdG9ZazNm4d USDA (2013b). Animal products. http://www.ers.usda.gov/topics/animal-products.aspx#.UdKyuqzNm 4c USDA (2013c). China: policy. http://www.ers.usda.gov/topics/international-markets-trade/countries -regions/china/policy.aspx#.UdKxO6zNm4c US Department of Transportation (2013). Table 1-3: number of US airports. Bureau of Transportation Statistics. http://www.rita.dot.gov/bts/sites/rita.dot.gov.bts/files/publications/na tional_transportation_statistics/html/table_01_03.html US EIA (2013). International energy statistics. http://www.eia.gov/cfapps/ipdbproject/iedindex3.cfm?tid=5&pid=53 &aid=1 Van den Bergh, J. (2011). Environment versus growth—A criticism of “degrowth” and a plea for “a-growth”. Ecological Economics, 70, 881-890. http://dx.doi.org/10.1016/j.ecolecon.2010.09.035 Wang, C. (2012). History of the Chinese family planning program: Copyright © 2013 SciRes. 156  H. COMPSTON, I. BAILEY Copyright © 2013 SciRes. 157 1970-2010. Contraception, 85, 563-569. http://dx.doi.org/10.1016/j.contraception.2011.10.013 WTO (2013a). Anti-dumping, subsidies, safeguards: Contingencies, etc. Understanding the WTO: The agreements. https://www.wto.org/english/thewto_e/whatis_e/tif_e/agrm8_e.htm WTO (2013b). Disputes by agreement: Subsidies and countervailing measures. https://www.wto.org/english/tratop_e/dispu_e/dispu_agreements_ind ex_e.htm?id=A20#selected_agreement
|