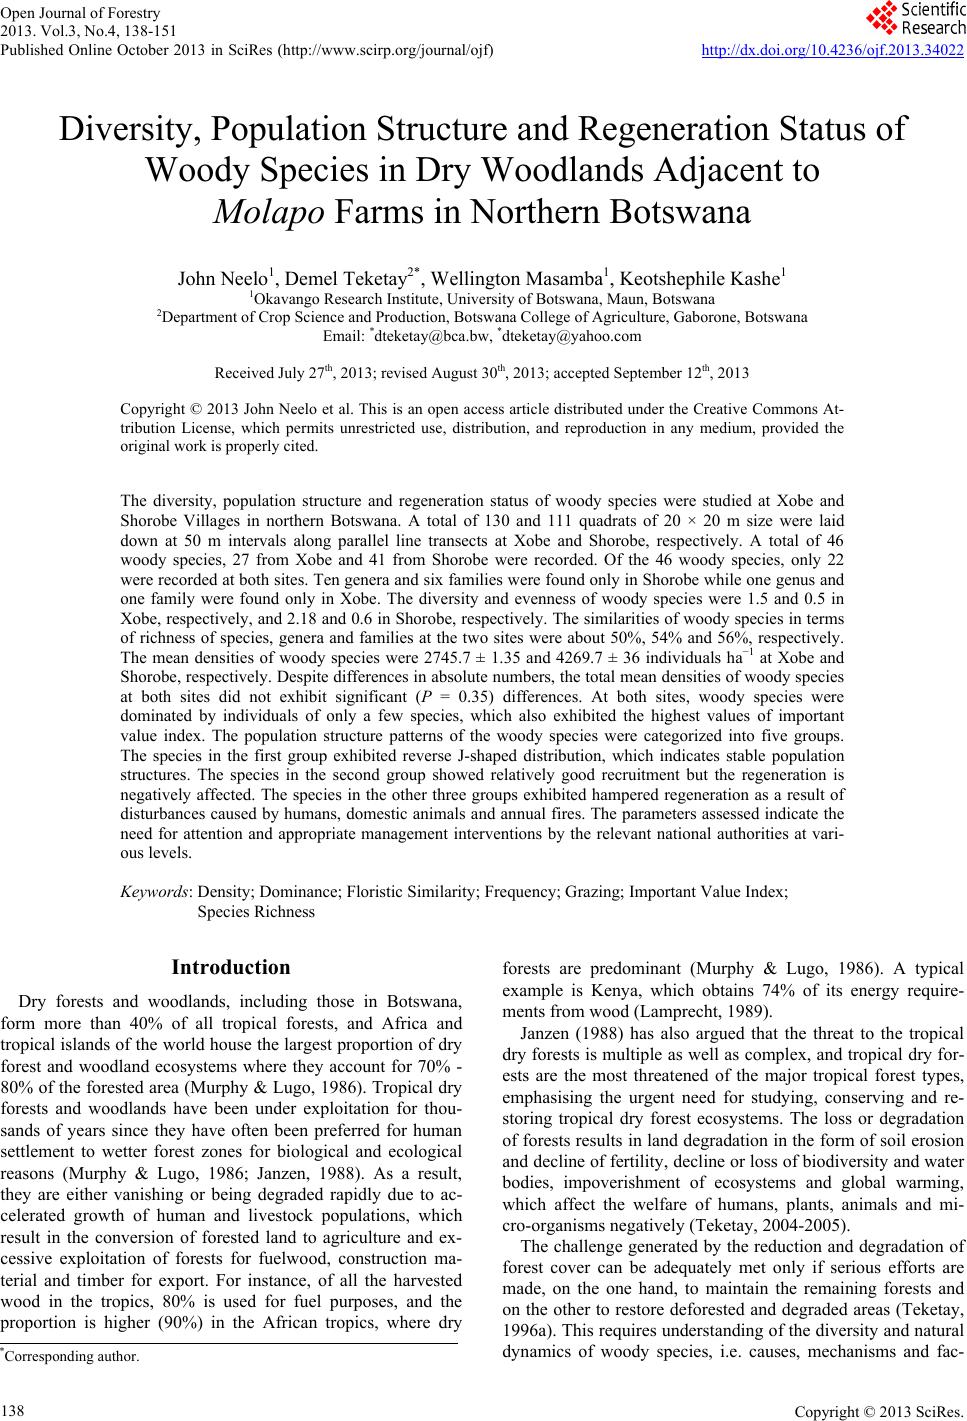
 Open Journal of Forestry 2013. Vol.3, No.4, 138-151 Published Online October 2013 in SciRes (http://www.scirp.org/journal/ojf) http://dx.doi.org/10.4236/ojf.2013.34022 Copyright © 2013 SciRes. 138 Diversity, Population Structure and Regeneration Status of Woody Species in Dry Woodlands Adjacent to Molapo Farms in Northern Botswana John Neelo1, Demel Teketay2*, Wellington Masamba1, Keotshephile Kashe1 1Okavango Research Institute, University of Botswana, Maun, Botswana 2Department of Crop Science and Production, Botswana College of Agriculture, Gaborone, Botswana Email: *dteketay@bca.bw, *dteketay@yahoo.com Received July 27th, 2013; revised August 30th, 2013; accepted September 12th, 2013 Copyright © 2013 John Neelo et al. This is an open access article distributed under the Creative Commons At- tribution License, which permits unrestricted use, distribution, and reproduction in any medium, provided the original work is properly cited. The diversity, population structure and regeneration status of woody species were studied at Xobe and Shorobe Villages in northern Botswana. A total of 130 and 111 quadrats of 20 × 20 m size were laid down at 50 m intervals along parallel line transects at Xobe and Shorobe, respectively. A total of 46 woody species, 27 from Xobe and 41 from Shorobe were recorded. Of the 46 woody species, only 22 were recorded at both sites. Ten genera and six families were found only in Shorobe while one genus and one family were found only in Xobe. The diversity and evenness of woody species were 1.5 and 0.5 in Xobe, respectively, and 2.18 and 0.6 in Shorobe, respectively. The similarities of woody species in terms of richness of species, genera and families at the two sites were about 50%, 54% and 56%, respectively. The mean densities of woody species were 2745.7 ± 1.35 and 4269.7 ± 36 individuals ha−1 at Xobe and Shorobe, respectively. Despite differences in absolute numbers, the total mean densities of woody species at both sites did not exhibit significant (P = 0.35) differences. At both sites, woody species were dominated by individuals of only a few species, which also exhibited the highest values of important value index. The population structure patterns of the woody species were categorized into five groups. The species in the first group exhibited reverse J-shaped distribution, which indicates stable population structures. The species in the second group showed relatively good recruitment but the regeneration is negatively affected. The species in the other three groups exhibited hampered regeneration as a result of disturbances caused by humans, domestic animals and annual fires. The parameters assessed indicate the need for attention and appropriate management interventions by the relevant national authorities at vari- ous levels. Keywords: Density; Dominance; Floristic Similarity; Frequency; Grazing; Important Value Index; Species Richness Introduction Dry forests and woodlands, including those in Botswana, form more than 40% of all tropical forests, and Africa and tropical islands of the world house the largest proportion of dry forest and woodland ecosystems where they account for 70% - 80% of the forested area (Murphy & Lugo, 1986). Tropical dry forests and woodlands have been under exploitation for thou- sands of years since they have often been preferred for human settlement to wetter forest zones for biological and ecological reasons (Murphy & Lugo, 1986; Janzen, 1988). As a result, they are either vanishing or being degraded rapidly due to ac- celerated growth of human and livestock populations, which result in the conversion of forested land to agriculture and ex- cessive exploitation of forests for fuelwood, construction ma- terial and timber for export. For instance, of all the harvested wood in the tropics, 80% is used for fuel purposes, and the proportion is higher (90%) in the African tropics, where dry forests are predominant (Murphy & Lugo, 1986). A typical example is Kenya, which obtains 74% of its energy require- ments from wood (Lamprecht, 1989). Janzen (1988) has also argued that the threat to the tropical dry forests is multiple as well as complex, and tropical dry for- ests are the most threatened of the major tropical forest types, emphasising the urgent need for studying, conserving and re- storing tropical dry forest ecosystems. The loss or degradation of forests results in land degradation in the form of soil erosion and decline of fertility, decline or loss of biodiversity and water bodies, impoverishment of ecosystems and global warming, which affect the welfare of humans, plants, animals and mi- cro-organisms negatively (Teketay, 2004-2005). The challenge generated by the reduction and degradation of forest cover can be adequately met only if serious efforts are made, on the one hand, to maintain the remaining forests and on the other to restore deforested and degraded areas (Teketay, 1996a). This requires understanding of the diversity and natural dynamics of woody species, i.e. causes, mechanisms and fac- *Corresponding author. 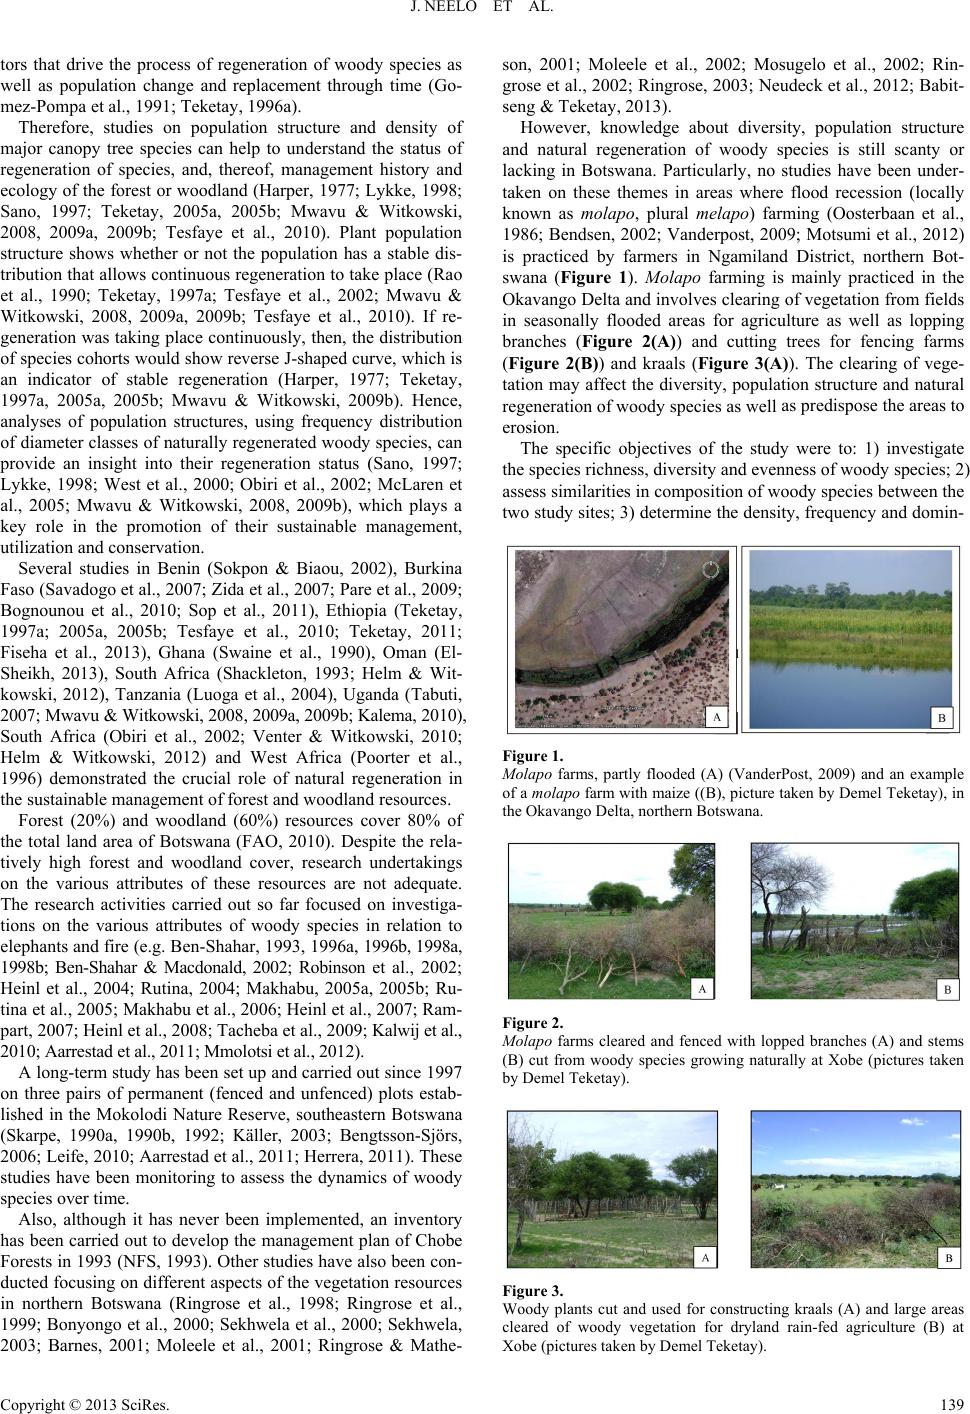 J. NEELO ET AL. tors that drive the process of regeneration of woody species as well as population change and replacement through time (Go- mez-Pompa et al., 1991; Teketay, 1996a). Therefore, studies on population structure and density of major canopy tree species can help to understand the status of regeneration of species, and, thereof, management history and ecology of the forest or woodland (Harper, 1977; Lykke, 1998; Sano, 1997; Teketay, 2005a, 2005b; Mwavu & Witkowski, 2008, 2009a, 2009b; Tesfaye et al., 2010). Plant population structure shows whether or not the population has a stable dis- tribution that allows continuous regeneration to take place (Rao et al., 1990; Teketay, 1997a; Tesfaye et al., 2002; Mwavu & Witkowski, 2008, 2009a, 2009b; Tesfaye et al., 2010). If re- generation was taking place continuously, then, the distribution of species cohorts would show reverse J-shaped curve, which is an indicator of stable regeneration (Harper, 1977; Teketay, 1997a, 2005a, 2005b; Mwavu & Witkowski, 2009b). Hence, analyses of population structures, using frequency distribution of diameter classes of naturally regenerated woody species, can provide an insight into their regeneration status (Sano, 1997; Lykke, 1998; West et al., 2000; Obiri et al., 2002; McLaren et al., 2005; Mwavu & Witkowski, 2008, 2009b), which plays a key role in the promotion of their sustainable management, utilization and conservation. Several studies in Benin (Sokpon & Biaou, 2002), Burkina Faso (Savadogo et al., 2007; Zida et al., 2007; Pare et al., 2009; Bognounou et al., 2010; Sop et al., 2011), Ethiopia (Teketay, 1997a; 2005a, 2005b; Tesfaye et al., 2010; Teketay, 2011; Fiseha et al., 2013), Ghana (Swaine et al., 1990), Oman (El- Sheikh, 2013), South Africa (Shackleton, 1993; Helm & Wit- kowski, 2012), Tanzania (Luoga et al., 2004), Uganda (Tabuti, 2007; Mwavu & Witkowski, 2008, 2009a, 2009b; Kalema, 2010), South Africa (Obiri et al., 2002; Venter & Witkowski, 2010; Helm & Witkowski, 2012) and West Africa (Poorter et al., 1996) demonstrated the crucial role of natural regeneration in the sustainable management of forest and woodland resources. Forest (20%) and woodland (60%) resources cover 80% of the total land area of Botswana (FAO, 2010). Despite the rela- tively high forest and woodland cover, research undertakings on the various attributes of these resources are not adequate. The research activities carried out so far focused on investiga- tions on the various attributes of woody species in relation to elephants and fire (e.g. Ben-Shahar, 1993, 1996a, 1996b, 1998a, 1998b; Ben-Shahar & Macdonald, 2002; Robinson et al., 2002; Heinl et al., 2004; Rutina, 2004; Makhabu, 2005a, 2005b; Ru- tina et al., 2005; Makhabu et al., 2006; Heinl et al., 2007; Ram- part, 2007; Heinl et al., 2008; Tacheba et al., 2009; Kalwij et al., 2010; Aarrestad et al., 2011; Mmolotsi et al., 2012). A long-term study has been set up and carried out since 1997 on three pairs of permanent (fenced and unfenced) plots estab- lished in the Mokolodi Nature Reserve, southeastern Botswana (Skarpe, 1990a, 1990b, 1992; Käller, 2003; Bengtsson-Sjörs, 2006; Leife, 2010; Aarrestad et al., 2011; Herrera, 2011). These studies have been monitoring to assess the dynamics of woody species over time. Also, although it has never been implemented, an inventory has been carried out to develop the management plan of Chobe Forests in 1993 (NFS, 1993). Other studies have also been con- ducted focusing on different aspects of the vegetation resources in northern Botswana (Ringrose et al., 1998; Ringrose et al., 1999; Bonyongo et al., 2000; Sekhwela et al., 2000; Sekhwela, 2003; Barnes, 2001; Moleele et al., 2001; Ringrose & Mathe- son, 2001; Moleele et al., 2002; Mosugelo et al., 2002; Rin- grose et al., 2002; Ringrose, 2003; Neudeck et al., 2012; Babit- seng & Teketay, 2013). However, knowledge about diversity, population structure and natural regeneration of woody species is still scanty or lacking in Botswana. Particularly, no studies have been under- taken on these themes in areas where flood recession (locally known as molapo, plural melapo) farming (Oosterbaan et al., 1986; Bendsen, 2002; Vanderpost, 2009; Motsumi et al., 2012) is practiced by farmers in Ngamiland District, northern Bot- swana (Figure 1). Molapo farming is mainly practiced in the Okavango Delta and involves clearing of vegetation from fields in seasonally flooded areas for agriculture as well as lopping branches (Figure 2(A)) and cutting trees for fencing farms (Figure 2(B)) and kraals (Figure 3(A)). The clearing of vege- tation may affect the diversity, population structure and natural regeneration of woody species as well as predispose the areas to erosion. The specific objectives of the study were to: 1) investigate the species richness, diversity and evenness of woody species; 2) assess similarities in composition of woody species between the two study sites; 3) determine the density, frequency and domin- Figure 1. Molapo farms, partly flooded (A) (VanderPost, 2009) and an example of a molapo farm with maize ((B), picture taken by Demel Teketay), in the Okavango Delta, northern Botswana. Figure 2. Molapo farms cleared and fenced with lopped branches (A) and stems (B) cut from woody species growing naturally at Xobe (pictures taken by Demel Teketay). Figure 3. Woody plants cut and used for constructing kraals (A) and large areas cleared of woody vegetation for dryland rain-fed agriculture (B) at Xobe (pictures taken by Demel Teketay). Copyright © 2013 SciRes. 139 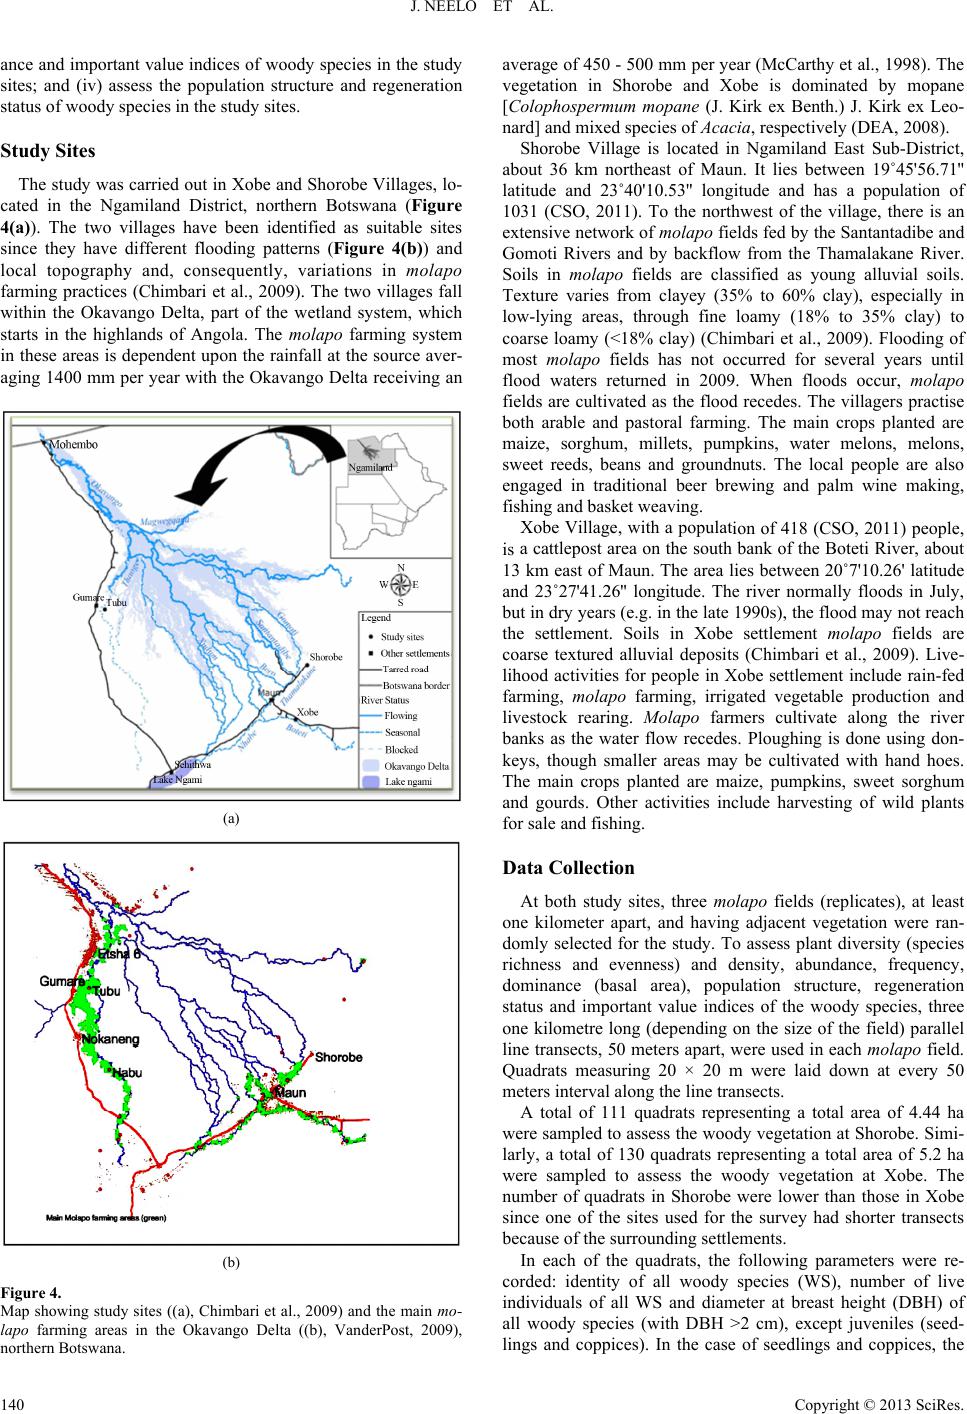 J. NEELO ET AL. ance and important value indices of woody species in the study sites; and (iv) assess the population structure and regeneration status of woody species in the study sites. Study Sites The study was carried out in Xobe and Shorobe Villages, lo- cated in the Ngamiland District, northern Botswana (Figure 4(a)). The two villages have been identified as suitable sites since they have different flooding patterns (Figure 4(b)) and local topography and, consequently, variations in mola po farming practices (Chimbari et al., 2009). The two villages fall within the Okavango Delta, part of the wetland system, which starts in the highlands of Angola. The molapo farming system in these areas is dependent upon the rainfall at the source aver- aging 1400 mm per year with the Okavango Delta receiving an (a) (b) Figure 4. Map showing study sites ((a), Chimbari et al., 2009) and the main mo- lapo farming areas in the Okavango Delta ((b), VanderPost, 2009), average of 450 - 5 northern Botswana. 00 mm per year (McCarthy et al., 1998). The , ab ion of 418 (CSO, 2011) people, is ee molapo fields (replicates), at least on total area of 4.44 ha w parameters were re- co vegetation in Shorobe and Xobe is dominated by mopane [Colophospermum mopane (J. Kirk ex Benth.) J. Kirk ex Leo- nard] and mixed species of Acacia, respectively (DEA, 2008). Shorobe Village is located in Ngamiland East Sub-District out 36 km northeast of Maun. It lies between 19˚45'56.71'' latitude and 23˚40'10.53'' longitude and has a population of 1031 (CSO, 2011). To the northwest of the village, there is an extensive network of molapo fields fed by the Santantadibe and Gomoti Rivers and by backflow from the Thamalakane River. Soils in molapo fields are classified as young alluvial soils. Texture varies from clayey (35% to 60% clay), especially in low-lying areas, through fine loamy (18% to 35% clay) to coarse loamy (<18% clay) (Chimbari et al., 2009). Flooding of most molapo fields has not occurred for several years until flood waters returned in 2009. When floods occur, molapo fields are cultivated as the flood recedes. The villagers practise both arable and pastoral farming. The main crops planted are maize, sorghum, millets, pumpkins, water melons, melons, sweet reeds, beans and groundnuts. The local people are also engaged in traditional beer brewing and palm wine making, fishing and basket weaving. Xobe Village, with a populat a cattlepost area on the south bank of the Boteti River, about 13 km east of Maun. The area lies between 20˚7'10.26' latitude and 23˚27'41.26'' longitude. The river normally floods in July, but in dry years (e.g. in the late 1990s), the flood may not reach the settlement. Soils in Xobe settlement molapo fields are coarse textured alluvial deposits (Chimbari et al., 2009). Live- lihood activities for people in Xobe settlement include rain-fed farming, molapo farming, irrigated vegetable production and livestock rearing. Molapo farmers cultivate along the river banks as the water flow recedes. Ploughing is done using don- keys, though smaller areas may be cultivated with hand hoes. The main crops planted are maize, pumpkins, sweet sorghum and gourds. Other activities include harvesting of wild plants for sale and fishing. Data Collection At both study sites, thr e kilometer apart, and having adjacent vegetation were ran- domly selected for the study. To assess plant diversity (species richness and evenness) and density, abundance, frequency, dominance (basal area), population structure, regeneration status and important value indices of the woody species, three one kilometre long (depending on the size of the field) parallel line transects, 50 meters apart, were used in each molapo field. Quadrats measuring 20 × 20 m were laid down at every 50 meters interval along the line transects. A total of 111 quadrats representing a ere sampled to assess the woody vegetation at Shorobe. Simi- larly, a total of 130 quadrats representing a total area of 5.2 ha were sampled to assess the woody vegetation at Xobe. The number of quadrats in Shorobe were lower than those in Xobe since one of the sites used for the survey had shorter transects because of the surrounding settlements. In each of the quadrats, the following rded: identity of all woody species (WS), number of live individuals of all WS and diameter at breast height (DBH) of all woody species (with DBH >2 cm), except juveniles (seed- lings and coppices). In the case of seedlings and coppices, the Copyright © 2013 SciRes. 140  J. NEELO ET AL. number of individuals of each species was counted and re- corded in each quadrat. A calliper and graduated measuring stick were used to measure diameter, respectively, of the woody plants. Plant species identification was done first directly in the field us Data Analyses s (S) is the total number of different woody sp woody species was analysed by using the Sh P where, H' = Shannon index, S = species richness, P = propor- abun- da ing relevant manuals and other reference materials as well as with the help of local people familiar with the flora. Plant no- menclature in this article follows that of Setshogo and Venter (2003) and Setshogo (2005). Species richnes ecies recorded in each of the project sites. It does not take into account the proportion and distribution of each species at the project sites. The diversity of annon Diversity Index (H) (also known as the Shannon- Weiner/Weaver Diversity Index in the ecological literature) (Krebs, 1989; Magurran, 2004). The index takes into account the species richness and proportion of each species in all sam- pled quadrats of each project site. The following formula was used to analyse woody species diversity: S 1 ln ii i HP i tion of S made up of the ith species (relative abundance). Evenness or equitability, a measure of similarityof the nces of the different woody species in the sampled project sites, was analysed by using Shannon’s Evennessor Equitability Index (E) (Krebs, 1989; Magurran, 2004). Equitability assumes a value between 0 and 1 with 1 being complete evenness. The following formula was used to calculate evenness. lnSJH where, J' = evenness and S = species richness. of the two sites w The similarity in woody species composition as computed by using Jaccard’s Similarity Coefficient (SJ) (Krebs, 1989). The values of SJ range between 0 and 1: 0 indi- cates complete dissimilarity and 1 indicates complete simi- larity in species composition. The following formula was used to determine similarity of the woody species in the two sites: J S aabc where, a = number of woody species common in the two sites; cies was determined by as the proportion (%) of th ) indicates the relative eco- lo n structure of each woody species in each of the tw Results Species Richness, DiveEvenness s representing 16 corded from X y species were 1.5 and 0. b = number of woody species recorded only in Xobe; and c = woody species recorded only in Shorobe. The mean density (MDE) of woody spe converting the total number of individuals of each woody species encountered in all the quadrats and all transects of the three replicated areas in each of the two sites to equivalent number per hectare as described in Mueller-Dombois and El- lenberg (1974). Student’s t-test, at the confidence level of P < 0.05 (Zar, 1999), was used to assess if differences existed between the mean values of total densities of woody species at Xobe and Shorobe. The frequency (MF) was calculated e number of quadrats in which each woody species was re- corded from the total number of quadrats in each of the sites. The dominance of the woody species, with diameter at breast height (DBH) of >2 cm, was determined from the space occu- pied by a species, usually its basal area (BA). The mean dominance of each species was computed by converting the total basal area of each woody species to equivalent basal area per hectare (Kent & Coker, 1992). The important value index (IVI gical importance of a woody species in each of the project sites (Kent & Coker 1992). It is determined from the summa- tion of the relative values of density, frequency and dominance of each woody species. Relative density (RMDE) was calcu- lated as the percentage of the density of each species divided by the total stem number of all species ha−1. Relative frequency (RMF) of a species was computed as the ratio of the frequency of the species to the sum total of the frequency of all species. Relative dominance (RMDO) was calculated as the percentage of the total basal area of a species out of the total basal areas of all species. Populatio o project sites was assessed through histograms constructed by using the density of individuals of each species (Y-axis) categorized into ten diameters classes (X-axis) (Peter, 1996), i.e. 1 = <2 cm; 2 = 2 - 5 cm; 3 = 5 - 10 cm; 4 = 10 - 15 cm; 5 = 15 - 20 cm; 6 = 20 - 25 cm; 7 = 25 - 30 cm; 8 = 30 - 35; 9 = 35 - 40; 10 = >40 cm. Then, based on the profile depicted in the popula- tion structures, the regeneration status of each woody species was determined. rsity and A total of 46 different species of woody plant families and 24 genera were recorded from the two sites. Only two species, one species at each site, were not identified. Of these, 27 (10 families and 14 genera) and 41 (15 Families and 23 genera) woody species were recorded at Xobe and Shorobe, respectively (Tables 1 and 2). Fabaceae (Legumino- sae) was the most diverse family at both Xobe and Shorobe represented by 12 (about 46%) and 15 (about 38%) woody species, respectively. The second and third most diverse fami- lies were Combretaceae [with 4 species (about 15%) at Xobe and 6 species (15%) at Shorobe] and Tiliaceae [with 3 species (about 12%) at Xobe and 4 species (10%) at Shorobe], respec- tively. Capparaceae, Ebenaceae and Rhamnaceae were repre- sented by two species (5%) each at Shorobe. All other families contained only one species at both sites. Ten genera and six families were found only in Shorobe while one genus and one family were found only in Xobe (Tables 1 and 2). Of the 24 genera encountered, 14 and 23 were re obe and Shorobe, respectively. At both sites, Acacia was the most diverse genus with 8 (about 57%) and 9 (about 39%) spe- cies of the total number of genera at Xobe and Shorobe sites, respectively. Combretum and Grewia [with 3 species (about 21%) each] were the second diverse genera followed by Philoneptera [with 2 species (about 14%)] at Xobe. Similarly, Combretum and Grewia [with 4 species (about 17%) each] were the second diverse genera followed by Philoneptera, Al- bizia and Terminalia [with 2 species (about 9%) each] at Shorobe. All the other genera were represented only by one species at both sites (Tables 1 and 2). The diversity and evenness of wood 5 in Xobe, respectively, and 2.18 and 0.6 in Shorobe, respec- tively. Copyright © 2013 SciRes. 141  J. NEELO ET AL. Copyright © 2013 SciRes. 142 ody species recorded from Xobe with their densities (individuals ha−1), frequencies (%), dominance (m2·ha−1), relative values (%) of densi- Species Family Local names MDE MF MDO*RMDE RMF RMDOIVI Table 1. List of wo ties, frequencies and dominance as well as Important Value Index (MDE = mean density, MF = mean frequency, MDO = mean dominance, RMDE = relative mean density, RMF = relative mean frequency, RMDO = relative mean dominance and IVI = important value index). Acacia melliferaF Fabaceae Mongana 1194.382.233.4 45.8 19.2 25.2 90.2 Acacia tortilis Fabaceae Mosu 1068.469.949.7 37.5 16.2 36.1 89.8 Philenoptera ne lsii Fabaceae Mohatha 106.1 35.922.2 3.7 8.2 16.1 27.9 Acacia luederitzii Fabaceae Mokgwelekgwele 49.3 28.310.6 1.7 6.5 7.6 15.7 Acacia erube scens Fabaceae Moloto 45.9 24.62.5 1.5 5.6 1.7 8.9 Albizia anthelm intica Fabaceae Monoga 37.5 13.82.5 1.2 3.1 2.0 6.3 1 Gymlensis C M C M 12.1 Comum C M C Eue Mo 1 Combre nseF Coae M ata 1 B Ce M Zizi si Combretucense Co Mone Grewia bicolor Tiliaceae Mogwana 0.2 0.8 0.0 0.0 0.2 0.0 0.2 Total 2745.7 100 100 100 F F F Acacia eriolobaF Fabaceae Mogotho37.0 27.04.6 1.4 6.5 3.5 1.4 nosporia seneg aelastraceaeothono 36.3 20.80.3 1.2 4.8 0.2 6.3 Terminalia pr uni oi d e s ombretaceaeotsiara 35.9 21.42.3 1.2 4.7 1.8 7.7 Gardenia volkensii Rubiaceae Morala 26.1 6.1 0.6 0.9 1.4 0.4 2.7 Mimusops zeyheri Sapotaceae Mmupudu 23.9 0.2 0.8 2.7 0.1 3.6 bretum albo p unctatombretaceaeotsoketsane20.4 22.81.8 0.7 4.9 1.2 6.8 Ximenia amer icana Olacaceae Moretologa 13.0 8.5 0.0 0.5 2.2 0.0 2.7 roton megalobotrysFphorbiaceatsebe 11.9 2.2 0.5 0.4 0.5 0.3 1.2 Dichrostac hys ciner ea Fabaceae Moselesele10.5 5.20.1 0.4 3.5 0.1 4.0 Grewia flava Tiliaceae Moretlwa 7.6 16.80.0 0.3 3.7 0.0 3.9 tum hereroembretaceokabi 6.9 2.2 0.4 0.2 0.5 0.2 0.9 Grewia retinervis Tiliaceae Mokgomph5.5 3.00.0 0.2 2.9 0.0 3.1 Acacia galpinii Fabaceae Mokala 2.6 0.7 0.2 0.1 0.2 0.1 0.4 oscia albitruncaapparaceaotopi 1.8 5.9 2.8 0.1 1.4 2.2 3.7 phus mucron ataFRhamnaceae Mokgalo1.4 2.3 0.0 0.0 0.5 0.0 0.6 Acacia nilotica Fabaceae Motlhabakgo1.2 0.8 0.0 0.1 0.2 0.0 0.3 Acacia fleckiiF Fabaceae Mohahu 0.6 0.8 0.5 0.0 0.2 0.4 0.6 m mossambimbretaceaetsweketsa0.6 0.8 0.0 0.0 0.2 0.0 0.3 Philenoptera v iolacea Fabaceae Mopororo 0.4 1.6 0.4 0.0 0.3 0.3 0.7 Unidentified species - - 0.4 0.8 0.5 0.0 0.2 0.4 0.6 *The “0” values indicate several decimal places, i.e. close to zero; F = species most preferred for fencing (Chimbari et al., unpublished). imilarities in Composition of Woody Species oth sites w Density, Frequency and Dominance cies were 2745.7 ± ± 36 (SD) (range 21 S Of the 46 woody species, 22 were recorded at b hile 5 and 19 woody species were recorded only from Xobe and Shorobe sites, respectively (Tables 1 and 2). The similari- ties of woody species in terms of richness of species, genera and families at the two sites were about 50%, 54% and 56%, re- spectively. The total mean densities of woody spe 1.35 (SD) (range = 2222 - 6545) and 4269.7 55 - 3133) individuals ha−1 at Xobe and Shorobe, respec- tively, and ranged from 0.2 (G. discolor) - 1194.3 (A. mellifera) at Xobe and 0.2 (E. divinorum) - 1675.4 (C. mopane) (Tables 1 and 2). Despite differences in absolute numbers, the total mean  J. NEELO ET AL. Table 2. −12 −1 List of woody species recorded from Shorobe with their densities (individuals ha), frequencies (%), dominance (m·ha ), relative values (%) of IVI densities, frequencies and dominance as well as Important Value Index (MDE = mean density, MF = mean frequency, MDO = mean dominance, RMDE = relative mean density, RMF = relative mean frequency, RMDO = relative mean dominance and IVI = important value index). Species Family Local names MDE MF MDO*RMDE RMF RMDO Colopho opaneF spermum mFabaceae Mophane 1675.439.987.6 25.7 6.2 26.5 58.5 Acacia tortilisF Fabaceae Mosu 509.8 71.434.9 14.7 10.3 16.6 41.6 Acacia eriolobaF Fabaceae M Pha Co F C Gs Ma Gyms C C Mi M Combse C A Rhm Bi C M e M UM Fabae C Te F C M 4 ogotho468.6 81.642.5 10.7 12.0 20.6 43.3 ilenoptera violaceFabaceae Mopororo 258.3 48.920.4 7.7 7.0 9.9 24.6 Dichrostac hys ciner ea Fabaceae Moselesele 218.4 59.34.0 6.8 8.6 2.2 17.6 Hyphaene p etersiana F Arecaceae Mokolwane 175.7 41.80.0 5.1 5.9 0.0 11.0 Grewia bicolor Tiliaceae Mogwana 175.1 29.52.1 7.1 4.5 0.9 12.5 mbretum imberbeombretaceaeMotswere 174.7 40.222.8 6.5 5.7 10.3 22.5 Croton me ga lobotry sF Euphorbiaceae Motsebi 133.5 21.815.9 3.5 3.3 6.9 13.7 Grewia flava Tiliaceae Moretlwa 88.1 33.60.6 2.0 5.2 0.2 7.4 rewia retinerviTiliaceae okgomphatl71.0 38.80.6 2.2 5.6 0.3 8.2 Acacia melliferaF Fabaceae Mongana 69.4 24.60.5 1.9 3.3 0.2 5.4 nosporia seneg ale nsielastraceaeMothono 39.9 11.40.6 1.0 1.5 0.4 3.0 Ziziphus mucronataF Rhamnaceae Mokgalo 36.0 25.92.0 1.1 3.5 1.1 5.7 ombretum hereroenseFCombretaceae Mokabi 33.1 18.91.3 1.0 2.7 0.6 4.3 Rhus tenuinervis Anacardiaceae orupaphir24.2 18.90.2 0.7 2.8 0.1 3.6 Acacia nilotica Fabaceae otlhabakgosi 12.5 7.0 0.5 0.3 0.9 0.3 1.5 retum mossambicenombretaceaeMotsweketsane 12.2 5.3 0.4 0.3 0.8 0.2 1.2 Boscia albitrunca Capparaceae Motlopi 8.8 13.71.2 0.2 2.0 0.4 2.5 lbizia anthelmintica Fabaceae Monoga 8.5 2.6 0.5 0.2 0.4 0.4 1.0 Diospyros lycioides Ebenaceae Letlhajwa 6.4 6.8 0.0 0.1 0.9 0.0 1.1 Berchemi a discolour Rhamnaceae Motsentsela 4.8 1.0 0.6 0.2 0.2 0.3 0.6 Acacia heb eclada Fabaceae Setshi 4.7 0.9 0.2 0.1 0.1 0.1 0.3 igozum brevispinosugnoniaceae Lebuta 4.5 0.9 0.0 0.1 0.1 0.0 0.2 ommiphora mossabicensis Burseraceae Moroka 4.3 9.4 0.1 0.1 1.5 0.0 1.6 Terminalia pr uni oi d e s Combretaceae Motsiara 4.2 3.7 0.6 0.1 0.5 0.3 1.0 Grewia flavescens Tiliaceae otsotsojan3.2 6.0 0.0 0.1 0.9 0.0 1.0 Ximenia amer icana Olacaceae Moretologa 3.1 5.3 0.0 0.1 0.8 0.0 0.9 Acacia sieberianaF Fabaceae Moremostlha 2.4 2.6 0.1 0.1 0.3 0.1 0.5 Albizia harveyi Fabaceae Molalakgaka 2.3 2.0 2.2 0.1 0.3 0.9 1.3 imusops zeyheri Sapotaceae Mmupudu 2.1 0.9 0.0 0.0 0.1 0.0 0.2 nidentified species - otorokofina1.9 0.9 0.0 0.0 0.1 0.0 0.2 Acacia nigresc ensF aceMokoba 1.7 2.6 0.0 0.0 0.3 0.0 0.4 Philenoptera ne lsii Fabaceae Mohatha 1.7 1.7 0.0 0.0 0.3 0.0 0.3 Capparis tomentosa apparaceae Motawana 1.5 1.0 0.2 0.1 0.2 0.1 0.3 Combretum collinum Combretaceae Modubana 1.3 0.9 0.8 0.0 0.1 0.2 0.4 Acacia fleckiiF Fabaceae Mohahu 0.4 0.9 0.0 0.0 0.1 0.0 0.1 rminalia serice aombretaceaeogonono0.4 1.7 0.0 0.0 0.2 0.0 0.3 Garcinia livingstoneiF Clusiaceae Motsaudi 0.3 1.0 0.0 0.0 0.2 0.0 0.2 Acacia erube scensF Fabaceae Moloto 0.2 0.9 0.0 0.0 0.1 0.0 0.1 Euclea divinorum Ebenaceae Motlhakola0.2 0.9 0.0 0.0 0.1 0.0 0.1 Total 269.7 100 100 100 *The “0” values inveral decimal places, i.e. cloo; F = species st preferred ng (Cbari et unpubli dicate sese to zermofor fencihimal.,shed). Copyright © 2013 SciRes. 143  J. NEELO ET AL. ensities of woody species at both sites did not exhibit logical importance. Nine and 16 species had IVI d significant differences (Students T-Test, P = 0.35). The top 10 densest woody species at Xobe were (in de- sc eckii, A. galpinii, A. lu at Xobe were (in de Important Value Index Value Index, Acacia mellifera, A. to values of less lation S tr uct ur e and Regeneration Status cies re- to five di meter class and pr rn as the first group except that in coppice recruitment and missing of individuals at lasses. To this group A irst diameter class or juveniles. This group w Discussion Forest and woodland tswana are important in providing socio-economl services, e. g. timber, fo ending order of density) Acacia mellifera, A. tortilis, Philen- optera nelsii, Acacia luederitzii, A. erioloba, A. erubescens, Terminalia prunioides, Combretum albopunctatum, Albizia an- thelmintica and Gymnosporia senegalensis (Table 1). The least five densest woody species at Xobe were (in descending order of density) Acacia fleckii, Combretum mossambicense, Philen- optera violacea, Unidentified sp. and Grewia bicolor. The 10 densest woody species at Shorobe were (in descending order of density) Colophospermum mopane, Acacia tortilis, A. erioloba, Philenoptera violacea, Dichrostachys cinerea, Hyphaene pe- tersiana, Grewia bicolor, Combretum imberbe, Croton mega- lobotrys and Grewia retinervis (Table 2). The least five densest woody species at Shorobe were (in descending order of density) Acacia fleckii, Terminalia sericea, Garcinia livingstonei, Aca- cia erubescens and Euclea divi norum. Acacia erioloba, A. erubescens, A. fl ederitzii, A. mellifera, A. nilotica, A. tortilis, Albizia anthel- mintica and Boscia albitrunca were the ten most frequent woody species at Xobe (in descending order of frequency) (Table 1). The five least frequent woody species were Philen- optera violacea, Terminalia prunioides, Unidentified species, Ximenia americana and Ziziphus mucronata. Acacia erioloba, Acacia tortilis, Dicrostachys cinerea, Philenoptera violacea, Hypaene petersiana, Combretum imberbe, Colophospermum mopane, Grewia retinervis, G. flava and G. bicolor were the top 10 most frequent species in Shorobe (in descending order of frequency) (Table 2). The five least frequent woody species were Combretum collinum, Acac i a fl eckii, Garcinia livingstonei, Acacia erubescens and Euclea divinorum. The top 10 most dominant woody species scending order of dominance) Acacia tortilis, A. mellifera, Philenoptera nelsii, Acacia luederitzii, A. erioloba, Boscia albi- trunca, Acacia erubescens, Albizia anthelmintica, Terminalia prunioides and Combretum albopunctatum (Table 1). Seven woody species (22% the total number of species recorded at the site) had very insignificant dominance values, i.e. close to zero. These are Ximenia americana, Grewia flava, Ziziphus mucro- nata, Acacia nilotica, Combretum mossambicense, Grewia bicolor and the unidentified species. The top 10 most dominant woody species at Shorobe were (in descending order of domi- nance) Colophospermum mopane, Acacia erioloba, Acacia tor- tilis, Combretum imberbe, Philenoptera violacea, Croton me- galobotrys, Dichrostachys cinerea, Grewia bicolor, Ziziphus mucronata and Albizia harveyi (Table 2). Sixteen of the woody species (about 39% of the total number of species recorded at the site) had very insignificant dominance values, i.e. close to zero. Based on their Importance rtilis, Philenoptera nelsii, Acacia luederitzii, A. erioloba, A. erubescens, Terminalia prunioides, Combretum albopunctatum, Albizia anthelmintica and Gymnosporia senegalensis in Xobe (Table 1) and Colophospermum mopane, Acacia erioloba, Aca- cia tortilis, Philenoptera violacea, Combretum imberbe, Di- chrostachys cinerea, Croton megalobotrys, Grewia bicolor, Hyphaene petersiana and Grewia retinervis in Shorobe (Table 2) were the top ten species in their descending order of eco- than one in Xobe and Shorobe, respectively, indicating that they are the least ecologically important species (Tables 1 and 2). Popu Based on their population structures, the woody spe corded at Xobe and Shorobe could be categorized in ameter class distribution patterns (Figure 5). The first group was composed of species that exhibited higher number of individuals at the lowest dia ogressively declining numbers with increasing diameter classes. To this group belonged Acacia erioloba, A. tortilis, A. mellifera, Colophospermum mopane, Combretum imberbe, Di- chrostachys cinerea, Grewia retinervis and Gymnosporia sene- galensis at Shorobeand Combretum albopunctatum, Dichro- stachys cinerea, Gymnosporia senegalensis and Ximenia ame- ricana at Xobe (Figure 5(a)). The second group was composed of species with similar di- ameter class distribution patte dividuals are missing at the higher diameter classes. To this group Commiphora mossabicensis, Diospyros lycioides, Gre- wia flavescens and Rhus tenunervis at Shorobe and Acacia luederitzii, A. tortilis, Albizia anthelmintica, Terminalia pruni- oides and Ziziphus mucronata at Xobe (Figure 5(b)) have been categorized. The third group consisted of species that showed both ham- pered seedling/ the higher diameter classes. To this group belonged Acacia hebeclada, A. nilotica, A. sieberiana, Albizia anthelmintica, Combretum hereroense, C. mossambicense, Croton megalo- botrys, Grewia bicolor, Mimusops zeyheri and Ziziphus mu- cronata at Shorobe and Acacia erubescens, A. galpinii, A. mel- lifera, Combretum hereroense, C. mossambicense, Croton me- galobotrys, Gardenia volkensii, Mimusops zeyheri and Philen- optera violacea at Xobe (Figure 5(c)). The fourth group was composed of species with missing in- dividuals in one or more of the diameter c lbizia harveyi, Berchemia discolor, Boscia albitrunca, Cap- paris tomentosa, Combretum collinum, Grewia flava, Philen- optera violacea and Terminalia prunioides at Shorobe and Aca- cia erioloba, A. fleckii, A. nilotica, Boscia albitrunca, Philen- optera nelsii and the unidentified species at Xobe (Figure 5(d)) were categorized. The fifth group consisted of species with individuals repre- sented only in the f as composed of Acacia erubescens, A. fleckii, A. nigrescens, Euclea divinorium, Garcinia livingstonei, Hyphaene petersiana, Philenoptera nelsii, Rhigozum brevispinosum, “Motorokofina” (unidentified sp.), Terminalia sericea and Ximenia Americana at Shorobe and Grewia bicolor, G. flava and G. retinervis at Xobe (Figure 5(e)). resources in Bo ic and ecologica od, fuelwood, traditional medicine, fodder, other non-timber forest products, source of grazing areas, wildlife habitats, tour- ism, watershed regulation, soil protection, carbon sequestration and storage, etc., that sustain livelihoods of communities and Copyright © 2013 SciRes. 144  J. NEELO ET AL. (a) (b) (c) (d) (e) Figure 5. structure of woody species recorded at Shorobe ((a) and (e)) and Xobe ((b), (c) and (d)) [diameter class (DBH): 1 = <2 cm; 2 = 2 - 5 cm; e national economy. Therefore, their sustainable management, central role in ecology an highest species ri (Luoga et al., 2000; Banda et al., 2008) and Uganda (Nangendo be a co ra and families of woody species re Population 3 = 5 - 10 cm; 4 = 10 - 15 cm; 5 = 15 - 20 cm; 6 = 20 - 25 cm; 7 = 25 - 30 cm; 8 = 30 - 35; 9 = 35 - 40; 10 = >40 cm. th utilization and conservation are crucial. Measures of species diversity play a d conservation biology (Magurran, 2004) since species di- versity is an important parameter of a plant community, one of the major criteria for nature conservation and connected to ecosystem dynamics and environmental quality (Kalema, 2010). A change in species diversity is often used as an indicator of anthropogenic or natural disturbances in an ecosystem (Liu & Brakenhielm, 1996; Kalema, 2010). Therefore, characterization of biodiversity through inventories can be useful in the plan- ning of operations that aim to conserve biodiversity (Belbin, 1995; Faith & Walker, 1996; Kelema, 2010). Of the two study sites, Shorobe exhibited the chness with 18 of the woody species not recorded from Xobe. Only five of the species recorded at Xobe were not encountered in the studied quadrats at Shorobe. Interestingly, even the densest and most dominant tree species in northern Botswana, namely C. mopane, and the common and conspicuous species, such as H. petersiana and Combretum imberbe at Shorobe were not recorded from the quadrats examined in Xobe, indicating their scarcity at this study site. Conversely, one of the most common species recorded in Xobe, namely A. leuderitzii, was not encountered in the quadrats sampled from Shorobe. In addi- tion, the numbers of genera and families were higher in Shorobe than Xobe. With the exception of A. tortilis and A. erioloba, the highest densities, frequencies, dominances and, hence, IVI values were exhibited by different species in the two sites. In terms of species richness and overall diversity, Shorobe and Xobe had much lower number of woody species compared with reports from studies in the Sudanian savanna in Burkina Faso (Savadogo et al., 2007), dryland forests and woodlands in Ethiopia (Woldemariam et al., 2000; Senbeta & Teketay, 2003; Zegeye et al., 2006, 2011; Worku et al., 2012) as well as wood- lands and forests in South Africa (Dovie et al., 2008), Tanzania et al., 2006; Kalema, 2010). However, the evenness values of woody species in Shorobe and Xobe were comparable with those reported for other dry land forests (Senbeta & Teketay, 2003; Alelign et al., 2007; Zegeye et al., 2006, 2011). The overall diversity of woody plants was much higher in Shorobe (H’ = 2.18) than Xobe (H’ = 1.5), which may nsequence of the high species richness in Shorobe. It has been noted that the value of H’ obtained from empirical data usually falls between 1.5 and 3.5, and rarely surpasses 4 (Mar- galef, 1972; Magurran, 2004). This implies that the diversity of woody species at Xobe falls at the lowest value of the diversity range. Although we have not investigated the causes, the dif- ference in the edaphic factors, especially the big difference in the soil types and moisture availability (Chimbari et al., 2009), may be responsible for the considerable floristic variations (richness of species, genera and families as well as overall di- versity) between the two sites. The diversity values of woody species obtained at Shorobe and Xobe are lower than those reported from Miombo Woodlands in Tanzania (Nduwamungu, 1997; Zahabu, 2001) and savanna woodlands in South Africa (Dovie et al., 2008). However, evenness values of the woody species at Shorobe (E = 0.6) and Xobe (E = 0.5) were more or less similar, also with those from other studies (Zegeye et al., 2006, 2011; Worku et al., 2012), suggesting that individuals of the different species recorded exhibited moderately similar abundance at the two sites. The Jaccard’s Similarity Coefficients of about 50% - 56% for the richness of species, gene corded from the two sites indicate that about half of the total species, genera and families encountered were specific to one or the other site. This reality has to be taken into consideration in any plan aimed at the sustainable management and conserva- tion of these resources. Shorobe exhibited much higher density of woody species Copyright © 2013 SciRes. 145  J. NEELO ET AL. compared with that of Xobe, which could be associated with th th more than 82% of the total density recorded in rded at Xobe may be attributed to seed di than Xobe while P. nelsii exhibited higher de ther dry Afromontane fo cance of species in a given ecosys- te ecies fr of the woody species recorded fr e higher number of woody species encountered at Shorobe than Xobe. With the exception of A. tortilis and A. erioloba, the two study sites differed in their densest woody species. Sur- prisingly, as stated above, the densest woody species in Shorobe, C. mopane, was not recorded from any of the quadrats assessed in Xobe, which may be attributed to its requirement of habitats with heavy textured and poorly drained soils (Ellery & Ellery, 1997). A. mellifera and A. tortilis had much higher densities at Xobe than Shorobe wi Xobe. In fact, more than 87% of the total density in Xobe was represented by the six Acacia species, five of which are also among the most dominant and frequently found species with the highest IVI values. This might suggest signs of bush encroachment due to overgrazing and over-exploitation of re- sources at Xobe (DEA, 2008). Acacia mellifera forms impene- trable patches of thickets at Xobe and is known to encroach eroded sites (Ellery & Ellery, 1997) and heavily grazed areas (El-Sheikh, 2013). Acacia tortilis is also common and wide- spread species in Botswana, which occurs on clay or loam soils in a variety of woodlands, generally near floodplains and pans. It tends to encroach heavily grazed sites (Ellery & Ellery, 1997). The domination of Acacia species, which are indicative of heavy grazing and encroachment, at Xobe is consistent with the fact that Xobe is used as a cattle post by people living in the nearby Maun Town. In addition, the relatively high number of species and density of Acacia species reco spersal, which is known to be facilitated by ruminants, and the subsequent favourable initial habitat for the developing seedlings within the accompanying droppings of the animals (Schultka & Cornelius, 1997; Teketay, 1996b, 1997b, 2005a; Kalema, 2010). Many Acacia species also use the soil seed bank as one route of regeneration after disturbance, especially following fire incidences (Sabiiti & Wein, 1987; Teketay & Granström, 1995, 1997; Teketay, 1998; Witkowski & Garner, 2000; Eriksson et al., 2003; Teketay, 2005a). It has been re- ported that grazing is a predictable selective form of distur- bance with animal behaviour through browse choice playing a significant role in determining which species are impacted (Whelan, 2001; Kalema, 2010). Grazing pressure may also play a significant role in determining plant community structure and composition by facilitating bush encroachment in frequently grazed areas (Witkowski & O’Connor, 1996; Kalema, 2010). Grazing, fire and selective tree harvesting, which are very common in the study sites, are considered major disturbances shaping species diversity and productivity (Savadogo, 2007; Kalema, 2010). It is interesting to note that P. violacea had much higher den- sities at Shorobe nsity in Xobe than Shorobe. On the one hand, P. violacea grows in open woodlands on edges of islands in seasonal swamps, and occasionally on interior regions of islands in per- manent swamps (Ellery & Ellery, 1997), habitats common in the surroundings of Shorobe. On the other, P. nelsii occurs in deep sand as part of short woodlands (Ellery & Ellery, 1997), which characterize the habitat at Xobe. The overall density of woody species recorded at Shorobe was higher than those reported from o rests (Alelign et al., 2007; Zegeye et al., 2006, 2011) and woodlands (Worku et al., 2012). The overall density of woody species recorded at Xobe was higher than other dry woodlands (Worku et al., 2012), similar to those reported from different forests (Woldemariam et al., 2000; Zegeye et al., 2006, 2011) and lower than other dry Afromontane forests (Alelign et al., 2007; Zegeye et al., 2011). The overall horizontal distribution of the woody species, represented by the frequency of occur- rence of the species in the studied quadrats, was relatively low with only 10 (out of 41) and three (out of 27) species having more than 30% frequency values at Shorobe and Xobe, respec- tively. This implies that the other species have scarce horizontal distribution at both study sites, which requires further investi- gations that can assist in the future design of appropriate man- agement interventions. Importance Value Index is an important parameter that re- veals the ecological signifi m (Lamprecht, 1989; Zegeye et al., 2006; Senbeta & Teketay, 2003; Worku et al., 2012). Acacia mellifera, A. tortilis and Philenoptera nelsii at Xobe and Colophospermum mopane, Acacia erioloba, Acacia tortilis and Philenoptera violacea at Shorobe can be considered the most ecologically important woody species with IVI values of more than 20 contributed by their high values of density, frequency and dominance. It is interesting to note that A. tortilis is recorded among the most ecologically important woody species at both study sites. In the absence of long-term demographic data on population trends, the use of diameter class distributions of woody sp om a single survey has been shown to be a potential and reli- able tool to reveal status of population structures and regenera- tion of woody species as well as predict responses of the spe- cies to disturbance and resultant changes in population structure (Condit et al., 1998; Lykke, 1998; Obiri et al., 2002; Sokpon & Biaou, 2002; Teketay, 2005a, 2005b; Feeley et al., 2007; Tabuti, 2007; Mwavu & Witkowski, 2009a; Tesfaye et al., 2010; Venter & Witkowski, 2010; Sop et al., 2011; Helm & Wit- kowski, 2012; El-Sheikh, 2013). A population size structure is simultaneously the outcome of past demographic events and an indicator of its demographic future (Wilson & Witkowski, 2003; Kalema, 2010). Based on the assessment of diameter class distributions, the population structure patterns om Shorobe and Xobe were categorized into five groups. The species in the first group exhibited reverse J-shaped distribution, which is widely acknowledged to indicate stable population structure, naturally replacing senesced individuals with seed- lings and saplings (Condit et al., 1998; Lykke, 1998; Obiri et al., 2002; Teketay, 1997a; 2005a, 2005b; Tabuti, 2007; Mwavu & Witkowski, 2009a; Tesafye et al., 2010; Sop et al., 2011; Helm & Witkowski, 2012; El-Sheikh, 2013). This appeared to be the case for about 20 and 15% of the woody species recorded at Shorobe and Xobe, respectively. Typical examples are A. erio- loba, A. tortilis and C. mopane at Shorobe and C. albopunc- tatum and G. senegalensis at Xobe. The species in the second group exhibited relatively good recruitment (of seedlings/cop- pices) but the regeneration is negatively affected as evidenced from the absence of individuals in progressively higher classes. This may be attributed to either natural- or human-induced hampered regeneration. Pole-sized and mature individuals may have been cut by the local people for various purposes. This group was comprised of about 10 and 19% of the woody spe- cies recorded at Shorobe and Xobe, respectively. The species in the other groups exhibited both naturally- and human-induced disturbances leading to their hampered regeneration. This ap- Copyright © 2013 SciRes. 146  J. NEELO ET AL. peared to be the case for about 70% and 66% of the woody species recorded at Shorobe and Xobe, respectively. In parti- cular, the species in the fifth group, represented by about 27% and 11% of the woody species recorded at Shorobe and Xobe, respectively, exhibited a very serious problem of regeneration with individuals only in the first diameter class. Some of the causes for the hampered regeneration of the woody species include clearing of the woody vegetation for cu es and cutting of trees of woody spe- ci species (Tables 1 and 2) are most pr onclusion The results revealed Xobe together house 46 different woody specde the local communi- tie that indi- vi e. Also, relatively low evenness indices, which were ca e problems described above. ing the ca regulate or promote the type, diameter and height cl ltivating crops both by molapo (Figure 2(A)) and dry land (Figure 3(B)) farmers, heavy grazing pressure, cutting of stems and lopping of branches of woody species for fencing of farms (Figures 2(A) and (B), 3(B)), kraals (Figure 3(A)) and house compounds and fuel wood. A land use assessment carried out by the University of Botswana on the basis of satellite images found that of the 48,900 ha cleared for cultivation in Ngamiland, 75% consist of dryland fields and 25% of fields in temporarily inundated floodplains (VanderPost, 2009). VanderPost (2009) also indicated that molapo farming takes place on small fields separated by strips of “natural” floodplain, and wholesale land- clearing does not usually occur, although removal of some vegetation takes place. The major impact of the molapo farming results from the heavy lopping of branch es used for fencing the farms. The heavy lopping of branches of woody species will negatively affect the production of fruits/seeds in enough qunatities required for the stable recruit- ment and regeneration of the species. However, the major im- pact was observed from the clearing and grazing (Figure 3(B)) of considerable areas of woody vegetation for the purpose of establishing and fencing rain-fed dry land farming (Figure 3(B)). In addition, the free grazing system in the study sites in particular and Botswana in general leads to the browsing and trampling of seedlings of woody species. At Shorobe, H. peter- siana was categorized in the fifth group based on its population structure. The trees of this species are cut down at about 30 cm above the ground for tapping the stem sap, which is, then, proc- essed by the local people to produce palm wine (Babitseng & Teketay, 2012). This traditional wine tapping method, which leads to the destruction of the stems of trees, is responsible for the obvious population structure (Figure 5(e)) and, hence, hampered regeneration. The socio-economic survey carried out at the two study sites revealed that 15 woody eferred for fencing, especially molapo farms (Chimbari et al., unpublished). Of these, 10 and five species recorded at Shorobe and Xobe, respectively, belong to the last three groups of population structure patterns. Six of the species recorded at Shorobe belong to the fifth group of the population structure pattern. This suggests that cutting of woody species for fenicng is contributing to the observed hampered regeneration of the species. If it is not properly managed, clearing of woody vege- tation, cutting and lopping trees excessively, coupled with an- nual recurrent fires common in the study sites and elsewhere in Botswana, will affect the population structure of woody species negatively and, hence, reduce or prevent their potential of re- generation and, therefore, perpetuation. This will, in turn, result in the decline or loss of biodiversity ultimately. Whelan (1995) argues that frequent fire outbreak can affect population struc- ture through elimination of certain classes or a delay in the whole recruitment process. Though information on fire toler- ances for woody species is not available, fire might have caused the poor representation of individuals of some of the woody species since farmers use fire to clear woody vegetation for grazing and for farming. C that Shorobe and ies, which provi s with various goods and services. Despite the apparent im- pacts from humans, domestic animals and recurrent annual fires, some of the woody species exhibited desirable values of density, frequency, dominance, IVI, population structures and regenera- tion status. Shorobe Village exhibited higher values of species, genus and family richness as well as relatively high diversity and overall density of woody species than Xobe Village. This may be attributed to the difference in the edaphic factors, espe- cially the big difference in the soil types and moisture availabil- ity, as well as the relatively higher human- and domestic ani- mal-induced disturbances at Xobe than Shorobe. The similari- ties of woody species in terms of richness of species, genera and families were medium suggesting that each site has its own characteristic species, genera and families. This is particularly important to consider when planning activities aimed at the responsible management, sustainable utilization and conserva- tion of the woody vegetation at the study sites. At both sites, the frequency of woody species was relatively low with the exception of a few species, suggesting duals of the species are thinnly or very thinnly spread hori- zontally. This is also evident from the medium evennes values recorded from the two study sites. Some of the woody species, especially those categorized in population structure Groups 3-5, exhibited negatively affected popultion structures and, as a result, hampered regeneration, which requires special attention and appropriate management intervention by the concerned bodies. The results revealed relatively low diversity and overall den- sity at Xob used by the sparse to very sparse horizontal distribution of individuals, were recorded at both sites. Many of the woody species exhibited low values of densities, basal areas and IVI values, unstable population structure and hampered regenera- tion at both study sites. These results indicate the need for at- tention and appropriate management interventions by the rele- vant national authorities at various levels, including the Kgosi (Chiefs), Village Development Committees and local commu- nities of the study sites. The following are a few examples of feasible management interventions to address th 1) Reduction of the pressure on regeneration of the woody species from the uncontrolled grazing through match rrying capacity of the study sites with appropriate numbers of livestock. 2) Introduction of management plans and appropriate tech- nologies that asses, and number of individuals of the available woody spe- cies to be harvested for the various needs of the communities. To this effect, we are also undertaking an experiment focusing on the effect of cutting diameter and height on the re-sprout- ing/coppicing ability of selected woody species at the study sites (Neelo et al., unpublished) with the aim of determining the optimal cutting diameter size(s) and height(s) for maximum re-sprouting ability of the species. Once promising results are achieved, it is hoped that the optimal cutting diameter(s) and Copyright © 2013 SciRes. 147  J. NEELO ET AL. height(s) will be demonstrated and disseminated to the local communities to promote desirable regeneration of the woody species with appropriate and sustainable utilization. 3) Establishment of rotational exclosures (Mengistu et al., 2005; Birhane et al., 2006; Aerts et al. 2009) of the areas cov- er h hampered re- ge ructures, regeneration and perpetuation of th Acknowledgements Authors are graDevelopment Re- search Centre (IDl support for this st Aarrestad, P. A., Masu, Pitlagano, M. L., Marokane, W., & Ska of soil, tree cover and ed with woody species at both sites, from both human and animal disturbances, so that the species will get enough time and appropriate environmental conditions to recover from the heavy grazing that affected their regeneration. 4) Research on the life-cycle and propagation (both sexual and asexual) methods of the woody species wit neration to promote their assisted regeneration, e.g. through enrichment planting. 5) Creation of awareness of the local communities on the status of population st e woody species in their localities so that they can promote responsible management and utilization as well as conservation of the species. teful to the International RC) for providing financia udy through the Botswana Ecohealth Project. We are thankful to Kgosi (Chiefs), Village Development Committees and local communities of the study sites, field technicians and Transport Section of the Okavango Research Institute (ORI), University of Botswana, community research assistants and Peter Smith University of Botswana Herbarium (PSUB). We are grateful to Chenamani Ntogwa for allowing us to use his compass and caliper and Amanda Tas for her voluntary help to collect, or- ganise and analyse our data. We would also like to thank ORI and its management for its logistical support. REFERENCES nga, G. S., Hytteborn, H. rpe, C. (2011). Influence large herbivores on field layer vegetation along a savanna landscape gradient in northern Botswana. Journal of Arid Environments, 75, 290-297. http://dx.doi.org/10.1016/j.jaridenv.2010.10.009 erts, R., Nyssen, J., & Haile, M. (2009). On the difference between “exclosures” and “enclosures” in ecology and the environment. Jour- A nal of Arid Environments, 73, 762-763. http://dx.doi.org/10.1016/j.jaridenv.2009.01.006 lelign, A., Teketay, D., Yemshaw, Y., & Edwards, S. (2007). Diver- sity and status of regeneration of woody plants A on the peninsula of B Zegie, northwestern Ethiopia. Tropical Ecology, 48, 37-49. Babitseng, T. M., & Teketay, D. (2013). Impact of wine tapping on the population structure and regeneration of Hyphaene petersiana Klo- tzsch ex Mart. in northern Botswana. Ethnobotany Research & Ap- plications, 11, 9-27. anda, T., Mwangulango, N., Meyer, B., Schwartz, M. K., Mbago, F., Sungula, M., & Caro, T. (2008). The woodland vegetation of Katavi- Rukwa ecosystem in western Tanzania. Forest Ecology and Man- agement, 255, 3382-3395. http://dx.doi.org/10.1016/j.foreco.2008.01.079 arnes, M. E. ( 2001). Seed predation, germination and seedling estab- lishment of Acacia erioloba in northern Botsw B ana. Journal of Arid Environments, 49, 541-554. http://dx.doi.org/10.1006/jare.2001.0805 Belbin, L. (1995). A multivariate approach to the selection of biological reserves. Biodiversity and Conservation, 9, 951-963. http://dx.doi.org/10.1007/BF00058206 Bendsen, H. (2002). The dynamics of land use systems in Ngamiland: Changing livelihoods options and strategies. Maun: Botswana Harry Openheimer Okavango Research Centr Bengtsson-Sjörs, K. (2006). Establishment and survival of woody seed- lingsin a semi-arid savanna in southern Botswana. Minor Field Study 123. Uppsala: Uppsala University. University of e. 0057-8 Ben-Shahar, R. (1993). Patterns of elephant damage to vegetation in northern Botswana. Biological C on s er v a ti o n , 65, 249-256. http://dx.doi.org/10.1016/0006-3207(93)9 23, 153- Ben-Shahar, R. (1996a). Woodland dynamics under the influence of elephants and fire in northern Botswana. Plant Ecology, 1 163. http://dx.doi.org/10.1007/BF00118268 Ben-Shahar, R. (1996b). Do elephants over-utilize mopane woodlands in northern Botswana? Journal of Tropical Ecology, 12, 505-515. http://dx.doi.org/10.1017/S0266467400009731 nd Ben-Shahar, R. (1998a). Changes in structure of the savannah wood- lands in northern Botswana following the impacts of elephants a fire. Plant Ecology, 136, 189-194. http://dx.doi.org/10.1023/A:1009708021735 en-Shahar, R. (1998b). Elephant density and impact on Kalahari wood- land habitats. Transactions of the R 149-155. Boyal Society of South Africa, 53, 09520383http://dx.doi.org/10.1080/003591998 Ben-Shahar, R., & Macdonald, D. (2002). The role of soil factors and leaf protein in the utilization of mopane plants by elephants in north- ern Botswana. BMC Ecology, 2, 3. http://dx.doi.org/10.1186/1472-6785-2-3 irhane, E., Teketay, D., &Barklund, P. (2006). Actual and potential contribution of exclosures to enhan in the drylands of Eastern Tigray. Journal B ce biodiversity of woody species of Drylands, 1, 134-147. e Bognounou, F., Tigabu, M., Savadogo, P., Thiombiano, A., Boussim, I. J., Óden, P.-C., & Guinko, S. (2010). Regeneration of five combre- taceae species along a latitudinal gradient in Sahelo-Sudanian zon of Burkina Faso. Annals of Forest Sciences, 67, 306. http://dx.doi.org/10.1051/forest/2009119 onyongo, C. M., Veenendaal, E. M., & Bredenkamp, G. (2000). Floodplain vegetation of seasonal floodplains in the N Area Okavango Delta Botswana. South A B xaraga Lagoon frican Journal of Botany, C ., & Chombo, O. (2009). Application of the ecohealth ap- C ist, 152, 495-509. 66, 15-21. himbari, M. J., Magole, L., Wiles, G., Dikgola, K., Kurugundla, N., Teketay, D., Ngwenya, B., Nyepi, M. S., Motsumi, S., Ama, K., Thakadu, O proach to understand flood-recession (Molapo) farming in the con- text of hydro-climate variability and hydro-climate change in the Okavango Delta, Botswana. Maun: University of Botswana, Harry Oppenheimer Okavango Research Centre. ondit, R., Sukumar, R., Hubbell, S. P., & Foster, R. B. (1998). Pre- dicting population trends from size distributions: A direct test in a tropical tree community. American Natural http://dx.doi.org/10.1086/286186 SO (Central Statistics Office) (2011). Botswana population and hous- ing census. Gaborone, Botswana. EA (2008). Okavango delta mana C Dgement plan. Gaborone: Depart- DF., & Shackleton, C. M. (2008). . ment of Environmental Affairs (DEA). ovie, D. B. K., Witkowski, E. T. Knowledge of plant resource use based on location, gender and gen- eration. Applied Geography, 28, 311-322 http://dx.doi.org/10.1016/j.apgeog.2008.07.002 llery, K., & Ellery, W. (1997). Plants of the Okavango Delta: A field guide. Durban: Tsaro Publisher. l-Sheikh, M. A. (2013). Population structure of E Ewoody plants in the 8/v10184-012-0008-6 arid cloud forests of Dhofar, southern Oman. Acta Botanica Croatica, 72, 97-111. http://dx.doi.org/10.247 t, 177, 39- Eriksson, I., Teketay, D., & Granstrom, A. (2003). Response of plant communities to fire in an Acacia woodland and a dry Afromontane forest, southern Ethiopia. Forest Ecology and Managemen 50. http://dx.doi.org/10.1016/S0378-1127(02)00325-0 aith, D. P., & Walker, P. A. (1996). Environmental diversity: On the best possible use of surrogate data for assessing the relative biodiver- sity of sets of areas. Biodiversity and Conservation, 5, 3 F 99-415. http://dx.doi.org/10.1007/BF00056387 AO (2010). Global forest resources a sses smen t. Rome: FAO. eeley, K. J., Davies, S. J., Noor, N. S., Kassim, A. R., & Tan (2007). Do current stem size distributi F F, S. ons predict future population al trees changes? An empirical test of intraspecific patterns in tropic Copyright © 2013 SciRes. 148  J. NEELO ET AL. at two spatial scales. Journal of Tro p ical Ecology, 23, 191-198. http://dx.doi.org/10.1017/S0266467406003919 isaha, G., Hundera, K., & Dalle, G. (2013). Woody plants’ diversity, structural analysis and regeneration status of Wof Washa natural for est, North-east Ethiopia. Afr ic an J ou rn al of Ecol F - ogy (in press). http://dx.doi.org/10.1111/aje.12071 omez-Pompa, A., Whitmore, T. C., & Hadley, M. (1991). Paris: Rain Forest Regeneration and Management. arper, J. L. (1977). Population biolog G Hy of plants. Lomdon: Academic H4). Vegetation changes after Journal of Botany, 70, 695-704. 3, 705-713. Press. einl, M., Sliva, J., & Tacheba, B. (200 single fire-events in the Okavango Delta wetland, Botswana. South African Heinl, M., Sliva, J., Murray-Hudson, M., & Tacheba, B. (2007). Post- fire succession on savanna habitats in the Okavango Delta wetland, Botswana. Journal of Tropical Ec o l og y, 2 http://dx.doi.org/10.1017/S0266467407004452 einl, M., Sliva, J., Tacheba, B., & Murray-Hudson, M. (2008). The relevance of fire frequency for the floodplain veg Okavango Delta, Botswana. African Journal o H etation of the f Ecology, 46, 350- 358. http://dx.doi.org/10.1111/j.1365-2028.2007.00847.x elm, C. V., & Witkowski, E. T. F. (2012). Characterising wide spatial variation in population size structure of a keystone African savanna tree. Forest Ecology and Management, 263, 175-188. H http://dx.doi.org/10.1016/j.foreco.2011.09.024 errera, A. (2011). Changes in spatial structureof woody savanna ve- getationafter 11 years of exclusion of large herbivores. Studies 162. Uppsala: Uppsala University. H Minor Field atersrand. hant population. Ecological Janzen, D. H. (1988). Tropical dry forests: The most endangered major tropical ecosystem. In E. O. Wilson (Ed.), Biodiversity (pp. 130-137). Washington: National Academic Press. Kalema, V. N. (2010). Diversity, use and resilience of woody plants in a multiple land-use equatorial African savanna, Uganda. Ph.D. The- sis, Johannesbur: University of the Witw Käller, A. (2003). Growth pattern and reproduction of woody vege- tation in a semi-arid savannain southern Botswana. Minor Field Study 86. Uppsala: Uppsala University. Kalwij, J. M., de Boer, W. F., Mucina, L., Prins, H. H. T, Skarpe, C., & Winterbach, C. (2010). Tree cover and biomass increase in a south- ern African savanna despite growing elep Applications, 20, 222-233. http://dx.doi.org/10.1890/09-0541.1 ent, M., & Coker, P. (1992). Vegetation description and analysis. A practical approach. London: Belhaven Press. ebs, C. J. (1989). Ecological methodology. New York: Harper K Kr Col- L: Tropical forest eco- tion. Eschborn: Deutsche Gesellschaft für Technis- L nd Management, 189, 23-35. lins Publishers. amprecht, H. (1989). Silviculture in the tropics systems and their tree species—Possibilities and methods for their long-term utiliza che Zusammenarbeit (GTZ) GmbH. eife, H. (2010). Has woody vegetation in a semi-arid savanna chan- ged after 11 years exclusion of large herbivores? Minor Field Study 153. Uppsala: Uppsala University. Liu, Q., & Brakenhielm, S. (1996). Variability of plant species diversity in Swedish natural forest and its relation to atmospheric deposition. Academic Publishers, 125, 63-72. Louga, E. J., Witkowski, E. T. F., & Balkwill, K. (2004). Regeneration by coppicing (resprouting) of miombo (African savanna) trees in re- lation to land use. Forest Eco l og y a http://dx.doi.org/10.1016/j.foreco.2003.02.001 uoga, E. J., Witkowski, E. T. F., & Balkwill, K. (2000). Differential utilisation and ethnobotany of trees in Kitulangalo forest reserve a surrounding communal lands, eastern Tanzania L nd . Economics Botany, 54, 328-343. http://dx.doi.org/10.1007/BF02864785 kke, A. M. (1998). Assessment of species composition change in sa- vanna vegetationby means of woody plants’ size class distributions and local information. Biodiversity and Conservati on Ly , 7, 1261-1275. http://dx.doi.org/10.1023/A:1008877819286 agurran, A. E. (2004). Measuring biological diversity. Malden and Oxford: Blackwell Publishing. akhabu, S. W. (2005a). Interactions between w M Moody plants, elephants sity of Science and Technology. ed to woody species growth rate? Plant Ecol- and other browsers in the Chobe Riverfront, Botswana. Doctoral Thesis, Oslo: Norwegian Univer Makhabu, S. W. (2005b). Resource partitioning within a browsing guild in a key habitat, the Chobe Riverfront, Botswana. African Journal of Ecology, 21, 641-649. Makhabu, S. W., Skarpe, C., Hytteborn, H., & Mpofu, Z. D. (2006). The plant vigour hypothesis revisited—How is browsing by ungu- lates and elephant relat ogy, 184, 163-172. http://dx.doi.org/10.1007/s11258-005-9060-9 argalef, R. (1972). Homage to Evelyn Hutchinson, or why is there an upper limit to diversity. Transactions of the Connecticut Academy of Arts and Sciences, 44, 211-235. M . maican tropical dry forest. Plant McCarthy, T. S., Bloem, A., & Larkin, P. A. (1998). Observations on the hydrology and geohydrology of the Okavango Delta, Botswana. Journal of Geology, 101, 101-117 McLaren, K. P., McDonald, M. A., Hall, J. B., & Healey, J. R. (2005). Predicting species response to disturbance from size class distribu- tions of adults and saplings in a Ja Ecology, 181, 69-84. http://dx.doi.org/10.1007/s11258-005-3497-8 engistu, T., Teketay, A., Hulten, H., & Yemshaw, Y. (2005). The role of enclosures in the recovery of woody vegetation in degraded dry- land hillsides of central and northern Ethiopia. Journal of Arid Envi M - ronments, 60, 259-281. http://dx.doi.org/10.1016/j.jaridenv.2004.03.014 molotsi, R. M., Obopile, M., Kwerepe, B. C., Sebolai, B., Rampart, M. P., Segwagwe, A. T., Ra korwe, L., & Kopong, I. (2012). Studies on M M molemana, G., Maphane, T. M., Le- ukwa (Pterocarpus angolensis D. C.) dieback in Chobe Forest Reserves in Botswana. Journal of Plant Studies, 1, 154-157. http://dx.doi.org/10.5539/jps.v1n2p154 oleele, N., Ringrose, S., Arnberg, W., Lunden, B., & Vanderpost, C. (2001). Assessment of vegetation indexes useful prediction in semi-arid rangelands. Inte M for browse (forage) rnational Journal of Remote Sensing, 22, 741-756. http://dx.doi.org/10.1080/01431160051060147 oleele, N., Ringrose, S., Matheson, W., & Vander Post, C. (2002). More woody plants? The status of bush encroachment in Botswana’s grazing areas. Journal of Environmental Management, 64, 3-11. M http://dx.doi.org/10.1006/jema.2001.0486 osugelo, D. K., Stein, M., Ringrose, S., & Nellemann, C. (2002). Vegetation changes during a 36 year period in Northern Chobe N tional Park, Botswana. Af ri ca n Jo ur na l o f E M a- cology, 40, 232-240. http://dx.doi.org/10.1046/j.1365-2028.2002.00361.x otsumi, S., Magole, L., & Kgathi, D. (2012). Indigenous knowledge and land use policy: Implications for livelihoods of flood recessi farming communities in the Okavango Delta, Botswa M on na. Physics and Chemistry of the Earth, 50-52, 185-195. http://dx.doi.org/10.1016/j.pce.2012.09.013 ueller-Dombois, D., & Ellenberg, H. (1974). Aims and methods of vegetation ecology. New York: John Wille urphy, P. G., & Lugo, A. E. (1986). Ecolog M y and Sons, Inc. My of tropical dry forest. Annual Review of Ecology, 17 , 67-88. http://dx.doi.org/10.1146/annurev.es.17.110186.000435 Mwavu, N. E., & Witkowski, E. T. F. (2008). Sprouting of woody species following cutting and tree-fall i tropical rainforest, North-Western Uganda. Forest Ecolog n a lowland semi-deciduous y and Man- agement, 255, 982-992. http://dx.doi.org/10.1016/j.foreco.2007.10.018 wavu, N. E., & Witkowski, E. T. F. (2009a). Population structure and regeneration of multiple-u tropical rainforest: Implications for primate M se tree species in a semi-deciduous African conservation. Forest Ecology and Management, 258, 840-849. http://dx.doi.org/10.1016/j.foreco.2009.03.019 wavu, N. E., & Witkowski, E. T. F. (2009b). Seedling regeneration, environment and management in a semi-deciduous Afr rain forest. Journal of Vegetation Science, 20, 7 M ican tropical 91-804. http://dx.doi.org/10.1111/j.1654-1103.2009.01084.x angendo, G., Steege, H. T., & Bongers, F. (2006). Composition of woody species in a dynamic forest-woodland-savannah Uganda: Implications for conservation and manageme N mosaic in nt. Biodiversity and Conservation, 15, 1467-1495. http://dx.doi.org/10.1007/s10531-005-1876-z duwamungu, J. (1997). Tree and shrub diversity in Miombo Wood- N Copyright © 2013 SciRes. 149  J. NEELO ET AL. lands. A case study at SUA Kitulang Tanzania. Master’s Thesis, Morogoro: Sokoi halo Forest Reserve, Morogoro, ne University of Agri- N food security, dietary diversity and income of households in N Okolwe, M. (2002). The dynamics and ca. Forest Ecology culture. eudeck, L., Avelino, L., Bareetseng, P., Ngwenya, B. N., Teketay, D., & Motsholapheko, M. R. (2012). The contribution of edible wild plants to Shorobe Village, northern Botswana. Ethnobotanical Research & Applications, 10, 449-462. orwegian Forestry Society (1992). Chobe forest inventory and mana- gement plan. Gaborone: Ministry of Agriculture. biri, J., Lawes, M., & Mu sustainable use of highvalue tree species of the coastal Pondoland forests of the Eastern Cape Province, South Afri and Management, 166, 131-148. http://dx.doi.org/10.1016/S0378-1127(01)00665-X osterbaan, R. J., Kortenhorst, L. F., & Sprey, L. H. (1986). Deve- lopment of flood-recession croppi vango Delta, Botswana. Wageningen: International Ong in the molapo’s of the Oka- Institute for Land P vation status and human P Reclamation and Improvement. are, S., Savadogo, P., Tigabu, M., Odén, P.-C., & Ouadba, J. M. (2009). Regeneration and spatial distribution of seedling populations in Sudanian dry forests in relation to conser pressure. Tropical Ecology, 50, 339-353. eters, C. M. (1996). The ecology and management of non-timber for- est resources. Washington: World Bank Technical Paper 322. http://dx.doi.org/10.1596/0-8213-3619-3 Poorter, L., Bongers, F., van Rompaey, A. R., & Klerk, M. D. (1996). Regeneration of canopy tree species at five sites in West Af moist forest. Forest Ecology and Managemrican ent, 84, 61-69. http://dx.doi.org/10.1016/0378-1127(96)03736-X ampart, M. (2007). Effects of fire and elephants on the growth of Pterocarpus angolensis (Mukwa) seedlings/saplings in th Forest Reserves (Botswana). Master’s Thesis, Ban Re Chobe gor: University of Wales. http://dx.doi.org/10.1007/BF00044832 ao, P., Barik, S. K., Pandey, H. N., & Tripathi, R. S. (1990). Com- munity composition and tree population structure in a sub-tropical broad-leaved forest along a disturbance gradien R t. Vegetatio, 88, 151- R phy, 23, 281-302. 162. ingrose, S. (2003). Characterisation of riparian woodlands and their potential water loss in the distal Okavango Delta, Botswana. Applied Geogra http://dx.doi.org/10.1016/j.apgeog.2003.08.006 ingrose, S., & Matheson, W. (2001). Spatial characteristics of Ri- parian Woodlands in the D and Records, 33, 101-114. R istal Okavango Delta. Botswana Notes their implications for human adaptation. Ringrose, S., Chipanshi, A. C., Matheson, W., Chanda, R., Motoma, L., & Magole, I. (2002). Climate and human induced woody vegetation changes in Botswana and Environmental Management, 30, 98-109. http://dx.doi.org/10.1007/s00267-002-2486-0 ingrose, S., Lesolle, D., Botshoma, T., Gopolang, B., VanderPost, C., & Matheson, W. (1999). An analysis of vegetation cove in relation to climatic trends along the Botswa R r components na Kalahari Transect. R ts, 38, 379-396. Botswana Notes and Records, 31, 33-52. ingrose, S., Matheson, W., & Vander Post, C. (1998). Analysis of soil organic carbon and vegetation cover trends along the Botswana Kala- hari Transect. Journal of Arid Environmen http://dx.doi.org/10.1006/jare.1997.0344 obinson, J. A., Lulla, K. P., Robinson, J. A., Lulla, K. P., Kashiwagi, M., Suzuki, M., Nellis, M. D., Charles, Bussing, E., Long, W & McKenzie, L. J. (2002). Conservation R . J. L., applications of astronaut photographs of earth: Tidal-flat loss (Japan), elephant effects on ve- getation (Botswana), and seagrass and mangrove monitoring (Aus- tralia). Conservation Biology, 15, 876-884. http://dx.doi.org/10.1046/j.1523-1739.2001.015004876.x utina L. P. (2004). Impalas in an elephant-impacted woodland: Browser-driven dynamics of the Chobe ripar swana. Ph.D. Thesis, Ås: Agricultural University of Norw Rian zone, northern Bot- ay. ildlife Rutina, L. P., Moe, S. R., & Swenson, J. E. (2005). Elephant Loxodonta africana driven woodland conversion to shrubland improves dry- season browse availability for impalas Aepyceros melampus. W Biology, 11, 207-213. http://dx.doi.org/10.2981/0909-6396(2005)11[207:ELADWC]2.0.C O;2 abiiti, E. N., & Wein, R. thesis of colonization success. Jo ur nal of Ecology, 74, 937-946. S W. (1987). Fire and acacia seeds: A hypo- /dx.doi.org/10.2307/2260305http:/ 7(96)03958-8 Sano, J. (1997). Age and size distribution in a long-term forest dy- namics. Forest Ecology Management, 92, 39-44. http://dx.doi.org/10.1016/S0378-112 sis, Umeå: Swed- is et Forêts des Tropiques, S nments, 36, 291-306. Savadogo, P. (2007). Dynamics of Sudanian savanna-woodland eco- systems in response to disturbances. Doctoral The ish University of Agricultural Sciences. Savadogo, P., Tigabu, M., Sawadogo, L., & Odén, P.-C. (2007). Woody species composition, structure and diversity of vegetation patches of a Sudanian savanna in Burkina Faso. Bo 294, 7-20. chultka, W., & Cornelius, R. (1997). Vegetation structure of a heavily grazed range in northern Kenya: Tree and shrub canopy. Journal of Arid Enviro http://dx.doi.org/10.1006/jare.1996.0208 ekhwela, M. B. M. (2003). Woody vegetation resource changes around selected settlements along Botswana. Journal of Arid Environment , 5 S aridity gradient in the Kalahari, 4, 469-482. http://dx.doi.org/10.1006/jare.2002.1102 ekhwela, M. B. M., Yates, D., & Lamb, D. (2000). Woody vegetation structure and wood availability in arid and sem-arid Kalahari sand system in Botswana. In S. Ringrose and S C. Raban (Eds.), Towards S urnal of Biological S eld. South African Journal of Bota ny , 59, 569-574. Sustainable Natural Resource Management in the Kalahari Transect (pp. 65-82). Gaborone: University of Botswana. enbeta, F., & Teketay, D. (2003). Diversity, community types and population structure of woody plants in Kimphee forest, a unique nature reserve in southern Ethiopia. Ethiopian Jo Sciences, 2, 169-187. etshogo, M. F. (2005). Preliminary checklist of the plants of Botswana. Pretoria and Gaborone: Southern African Botanical Diversity Net- work Report No. 37. Setshogo, M. P., & Venter, F. (2003). Trees of Botswana: Names and Distribution. Pretoria: Southern African Botanical Diversity Network Report No. 18. Shackleton, C. M. (1993). Demography and dynamics of the dominant woody species in a communal and protected area of the eastern Transvaal Lowv Skarpe, C. (1990a). Structure of the woody vegetation in disturbed and undisturbed arid savanna. Botswana. Vegetatio, 8 7 , 11-18. http://dx.doi.org/10.1007/BF00045650 Skarpe, C. (1990b). Shrub layer dynamics under different herbivore densities in an arid savanna, Botswana. Journal of Applied 27, 873-885. Ecology, 404383http://dx.doi.org/10.2307/2 Skarpe, C. (1992). Dynamics of savanna ecosystems. Journal of Vege- tation Science, 3, 293-300. http://dx.doi.org/10.2307/3235754 okpon, N., & Biaou, S. H. (2002). The use of diamSeter distributions in nage- sustained-use management of remnant forests in Benin: Case of Bassila Forest Reserve in North Benin. Forest Ecology and Ma ment, 161, 13-25. http://dx.doi.org/10.1016/S0378-1127(01)00488-1 op, T. K., Oldeland, J., Schmiedel, U., Ouedraogo, I., & Thiombiano. A. (2011). Population structure of three woody species in four ethnic domains of the sub-sahel of Burkina Faso. Land Degradation & De- S velopment, 22, 519-529. http://dx.doi.org/10.1002/ldr.1026 waine, M. D., Lieberman, D., & Hall, J. B. (1990).Structure and dy- namics of a tropical dry forest in Ghana. Vegetat i o , 8 8 , 31-51. S http://dx.doi.org/10.1007/BF00032601 Tabuti, J. R. S. (2007). The uses local perceptions and ecological status of 16 woody species of Gadumire Sub-county Uganda. Biodive and Conservation, 16, 1901-1916. rsity http://dx.doi.org/10.1007/s10531-006-9097-7 acheba, B., Segosebe, E., Vanderpost, C., & Sebego, R. (2009). As- sessing the impacts of fire on the ve able to the local communities of the seasonal T getation resources that are avail- wetlands of the Oka- vango, Botswana, in the context of different land uses and key gov- ernment policies. African Journal of Ecology, 47, 71-77. http://dx.doi.org/10.1111/j.1365-2028.2008.01052.x Copyright © 2013 SciRes. 150  J. NEELO ET AL. Copyright © 2013 SciRes. 151 T ia. Forest eketay, D. (1996b). Germination ecology of twelve indigenous and eight exotic multipurpose leguminous species from Ethiop Ecology and Management, 80, 209-223. http://dx.doi.org/10.1016/0378-1127(95)03616-4 eketay, D. (1997a). Seedling populations and regeneration of woody species in dry Afromontane forests of Ethiopia. Management, 98, 149-165. T Forest Ecology and http://dx.doi.org/10.1016/S0378-1127(97)00078-9 eketay, D. (1997b). Germination ecology of Acacia negrii, an en- demic multipurpose tree from eketay, D. (1998). Soil seed bank at an abandoned Afr T Ethiopia. Tropical Ecology, 38, 39-46. Tomontane ara- T Tology in dry Afromon- , B. Stimm and R. Mosandi (Eds.), Silvicul- ble site. Feddes Repertorium, 109, 161-174. eketay, D. (2004-2005). Causes and consequences of dryland forest degradation in Sub-Saharan Africa. Walia, 24, 3-20. eketay, D. (2005a). Seed and regeneration ec tane forests of Ethiopia: I. Seed production—Population structures. Tropical Ecology, 46, 29-44. Teketay, D. (2005b). Seed and regeneration ecology in dry Afromon- tane forests of Ethiopia: II. Forest disturbance and succession. Tropi- cal Ecology, 46, 45-64. Teketay, D. (2011). Natural regeneration and management of Podocar- pus falcatus (Thunb.) Mirb. in the Afromontane forests of Ethiopia. In: S. Günter, M. Weber ture in the tropics (pp. 325-336). London and New York: Springer- Verlag Berlin Heidelberg. http://dx.doi.org/10.1007/978-3-642-19986-8_21 eketay, D., & Granström, A. (1995). Soil seed banks in dry Afro- montane forests of Ethiopia 786. T . Journal of Vegetation Science, 6, 777- http://dx.doi.org/10.2307/3236391 Teketay, D., & Granström, A. (1997). Seed viability of Afromontane tree species in forest soils. Journal of Tropical Ecology, 13, 81-95. http://dx.doi.org/10.1017/S0266467400010270 1078/0367-2530-1210063 Teketay. D. (1996a). Seed ecology and regeneration in dry Afromon- tane Forests of Ethiopia. Doctoral Thesis, Umeå: Swedish University of Agricultural Sciences. Tesfaye, G., Teketay, D. & Fetene, M. (2002). Regeneration of fourteen tree species in Harenna forest, southeastern Ethiopia. Flora, 197, 461-474. http://dx.doi.org/10. Tesfaye, G., Teketay, D., Fetene, M., & Beck, E. (2010). Regeneration of seven indigenous tree species in a dry Afromontane forest, south- ern Ethiopia. Flora, 205, 135-143. http://dx.doi.org/10.1016/j.flora.2008.12.006 anderpost, C. (2009). Molapo farming in the Okavango Delta. fact sheet 7/2009. Maun: Harry Oppenhe University of Botswana. V imer Okavango Research Centre, 16 Venter, S. M., & Witkowski, E. T. F. (2010). Baobab (Adansonia digitata L.) density, size-class distribution and population trends be- tween four land-use types in northern Venda, South Africa. Forest Ecology and Management, 259, 294-300. http://dx.doi.org/10.1016/j.foreco.2009.10.0 W. Regeneration failure est, A. G., Midgley, J. J., & Bond, W. J. (2000) and potential importance of human disturbance in a subtropical forest. Applied Vegetation Science, 3, 223-232. http://dx.doi.org/10.2307/1479001 helan, R. J. (2001). The ecology of Wfire. Cambridge: Cambridge Uni- W Witkowski, E. T. F. (2003). Seed banks, bark thick- versity Press. ilson, B. G., & ness and change in age and size structure (1997-1999) of the African savanna tree, Burkea Africana. Plant Ecology, 167, 151-162. http://dx.doi.org/10.1023/A:1023999806577 itkowski E. T. F., & O’Connor, T. G. (1996).W Topo-edaphic, floristic and physiognomic gradients of woody plants in a semi-arid African savanna woodland. Vegetatio, 12 4, 9-23. http://dx.doi.org/10.1007/BF00045140 itkowski, E. T. F., & Garner, R. D. (200W0). Spatial distribution of soil 706843 seed banks of three African savanna woody species at contrasting sites. Plant Ecology, 149, 91-106. http://dx.doi.org/10.1023/A:1009850 W& Olsson, M. (2000). Wiversity, Z of charcoal extraction to the miombo wood- Zd.). Upper Saddle River, Z, & Kelbessa, E. (2006). Diversity, regeneration oldemariam, T., Teketay, D., Edwards S., Woody plant and avian species diversity in a dry Afromontane forest on the central plateau of Ethiopia: Biological indicators for conser- vation. Ethiopian Journal of Natural Resources, 2, 255-293. orku, A., Teketay, D., Lemenih, M., & Fetene, M. (2012). D regeneration status and population structure of gum and resin pro- ducing woody species in Boarana, Southern Ethiopia. Forests, Trees and Livelihoods, 1-12. ahabu, E. (2001). Impact lands: The case of Kitulangalo area, Tanzania. Master’s Thesis, Mo- rogoro: Sokoine University of Agriculture. ar, J. H. (1999). Biostastical analysis (4th e NJ: Prentice Hall. egeye, H., Teketay, D. status and socio-economic importance of the vegetation in the islands of Lake Ziway, south-central Ethiopia. Flora, 201, 483-498. http://dx.doi.org/10.1016/j.flora.2005.10.006 egeye, H., Teketay, D., & Kelbessa, E. (2011)Z. Diversity and regene- ration status of woody species in Tara Gedam and Abebaye forests, northwestern Ethiopia. Journal of Forestry Research, 22, 315-328. http://dx.doi.org/10.1007/s11676-011-0176-6 ida, D., Savadogo, L., Tigabu, M., Tiveau, D., Z& Oden, P. C. (2007). Dynamics of sapling population in savanna woodlands of Burkina Faso subjected to grazing, early fire and selective tree cutting for a decade. Forest Ecology and Management, 243, 102-115. http://dx.doi.org/10.1016/j.foreco.2007.02.013
|