Determination of the Stability Studies of the Sudanese Camel Insulin 551
were dissolved in 50 ml of distilled water, gently heated
and sterilized in an autoclave. Cooled the media after
sterilization and added 5 ml of each eight camel insulin
samples taken from soluble D, E, crystalline D, E, amor-
phous D, E and mixed insulin D, E respectively, tho-
roughly mixed and incubated at 20˚C - 25˚C for over-
night. Next day observed the samples for microbial grow-
th in the media.
3.4. Potency Test of Insulin Carried out by
HPLC
The standard and camel insulin samples with concen-
trations of 0.1 mg/ml, were used for insulin concentration
and potency test by HPLC method [12]. The lyophilized
material was dissolved in 0.2 M ammonium phosphate,
pH 4.0, and 250 μl were applied to a reversed phase
HPLC column. An aliquot was directly counted to esti-
mate the recoveries, The HPLC separations were per-
formed with a Beckman model 332 liquid chromato-
graph equipped with a model 210 injector fitted with a
250-μl loop. The column used was a DuPont Zorbax C-8
(4.6 mm × 25 cm; 6-μm particle diameter) maintained at
40˚C by a Bioanalytical Systems LC-22A temperature
controller. Insulin was eluted from the column with a
0.2-M ammonium phosphate (pH 4.0)/acetonitrile sol-
vent system similar to that described previously and read
with run time of 10 - 15 minutes. The peak area and
capacity factors were calculated by the HPLC reading.
The concentration of insulin by the HPLC method was
reported as mean [13].
4. Discussion
Before the marketing and use of any insulin lot, its po-
tency and stability must meet certain criteria and require-
ments. As it is an established fact that the labile drugs
and vaccines if not stored under controlled conditions,
may lose its potency and stability. Stability is arbitrarily
determined by subjecting a sample of insulin to a heat
test. Insulin thus treated loses some of its physiologic
activities but if there is a considerable loss e.g., 15% or
more, then such a preparation is not considered suitable
for general use. Similarly, traces of certain metals, parti-
cularly zinc, copper, nitrogen and iron were found in
some unstable insulin preparations; and it was therefore
assumed that the presence of these metals be a factor
affecting deterioration either upon prolonged standing at
room temperature or upon subjection to a heat test. The
deterioration of insulin upon standing and stored for a
long time is a problem of considerable importance not
only to the manufacturer but to the physician and in
particular for the patients. In the presented study we
analyzed different insulin samples, extracted, purified
and prepared from Sudanese camel insulin for the
stability, low in its ash content (free of such metals as
zinc, nitrogen) and particularly for sterility and potency
test after six months of their storage.
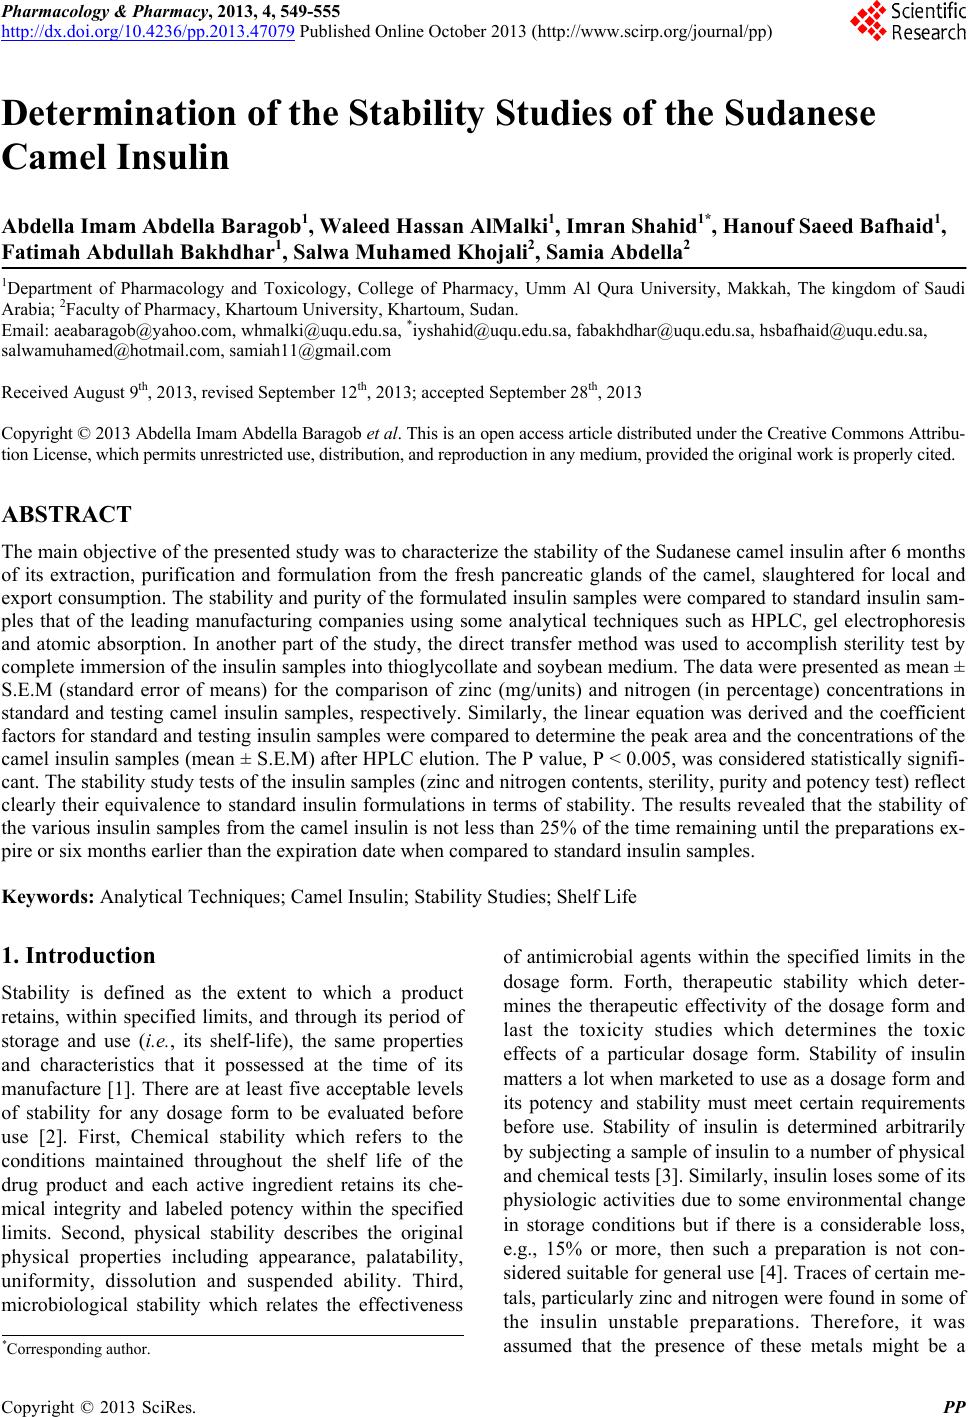
It is apparent from the results for the zinc contents of
the testing and standard insulin preparations as shown in
Table 1 that the zinc contents are not more than the
amount stated in the individual monograph, as deter-
mined by atomic absorption spectrometry. Furthermore,
the comparison of zinc concentrations of standard and
testing insulin samples in Figure 1 showed that these
figures are in compliance with Melville et al., [7] which
demonstrated that the addition of 1mg of zinc per 1000
units neither increases the efficiency nor tends to prolong
the duration of the hypoglycemic action of insulin on the
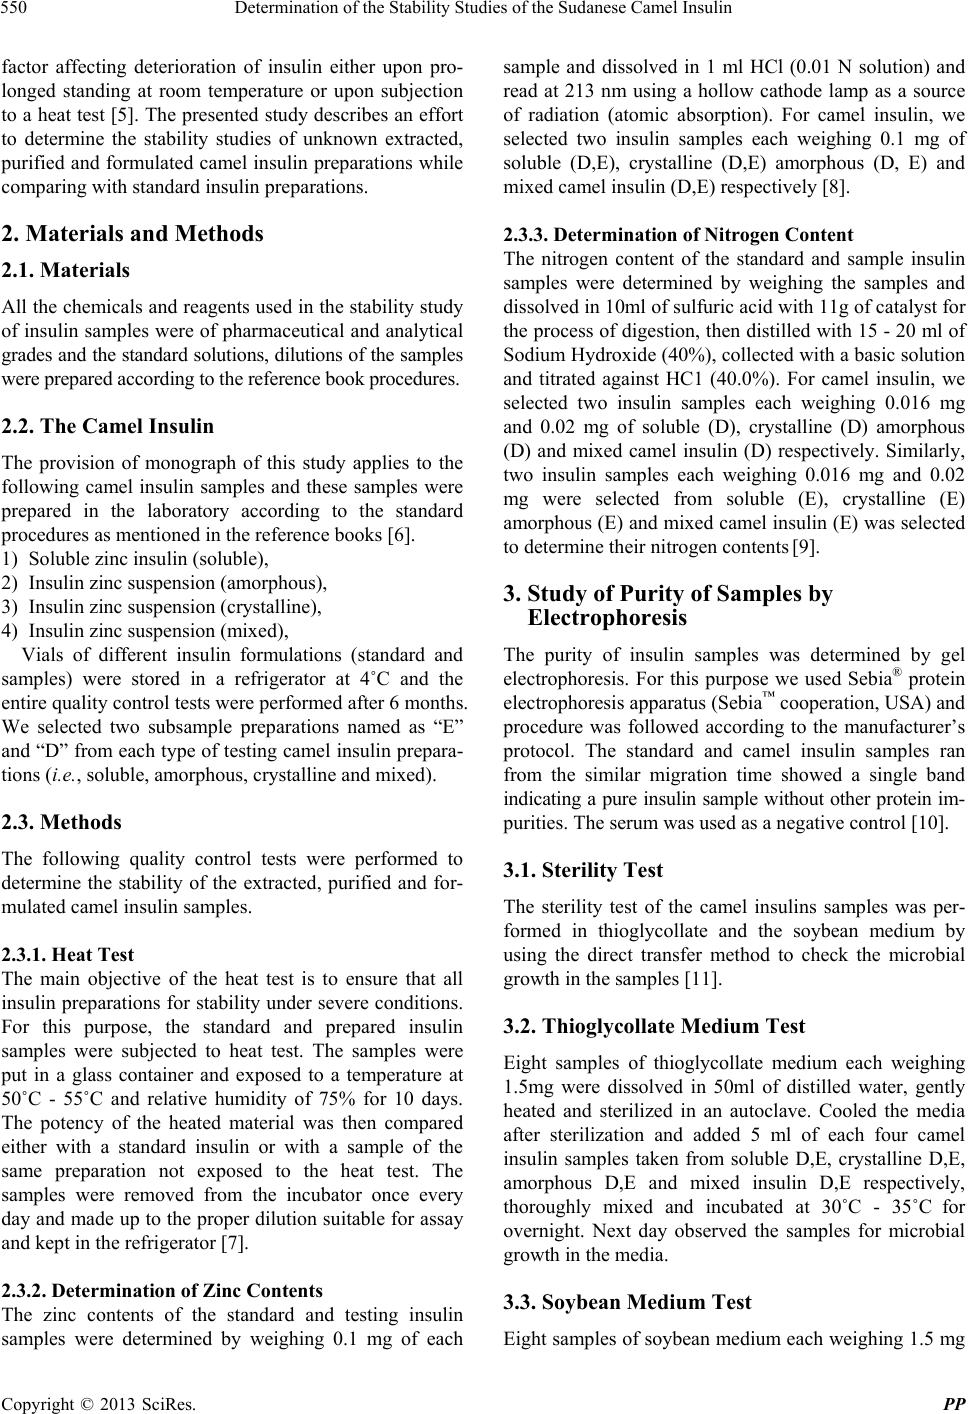
blood sugar of normal fasting rabbits. Similarly, the
nitrogen contents of the testing insulin meet the certain
criteria as mentioned in the individual monograph and
there is no considerable difference in percent nitrogen
contents when compared to standard insulin preparations
as shown in Table 2 and Figure 2. Protein gel electro-
phoresis is a reliable and an authentication method to
determine the purity of protein samples. We used hydro-
foil electrophoresis ( Sebia™ cooperation, USA) to deter-
mine and compare the purity of testing insulin samples
with standard insulins according to the manufacturer
protocol as shown in Figure 3. The results of the gel
electrophoresis demonstrated clearly that the standard
and sample insulin ran at the same migration time and
appeared only as one band which indicated that the re-
sulting samples were pure insulin samples, although the
gel bands of camel insulin samples were slight weaker
compared to standard insulin samples which might an
indication that the samples had lost a little insulin po-
tency. The concentration of the insulin samples further
analyzed by HPLC method confirmed the results of gel
electrophoresis. Microbial contamination is also a po-
tential risk factor for the insulin and labile drug pre-
parations and we confirmed that the testing insulin sam-
ples are free of any contamination by sterility test. The
thioglycollate and soybean media showed no microbial
growth in the testing insulin samples after 24 hrs incu-
bation period as shown in Table 3.
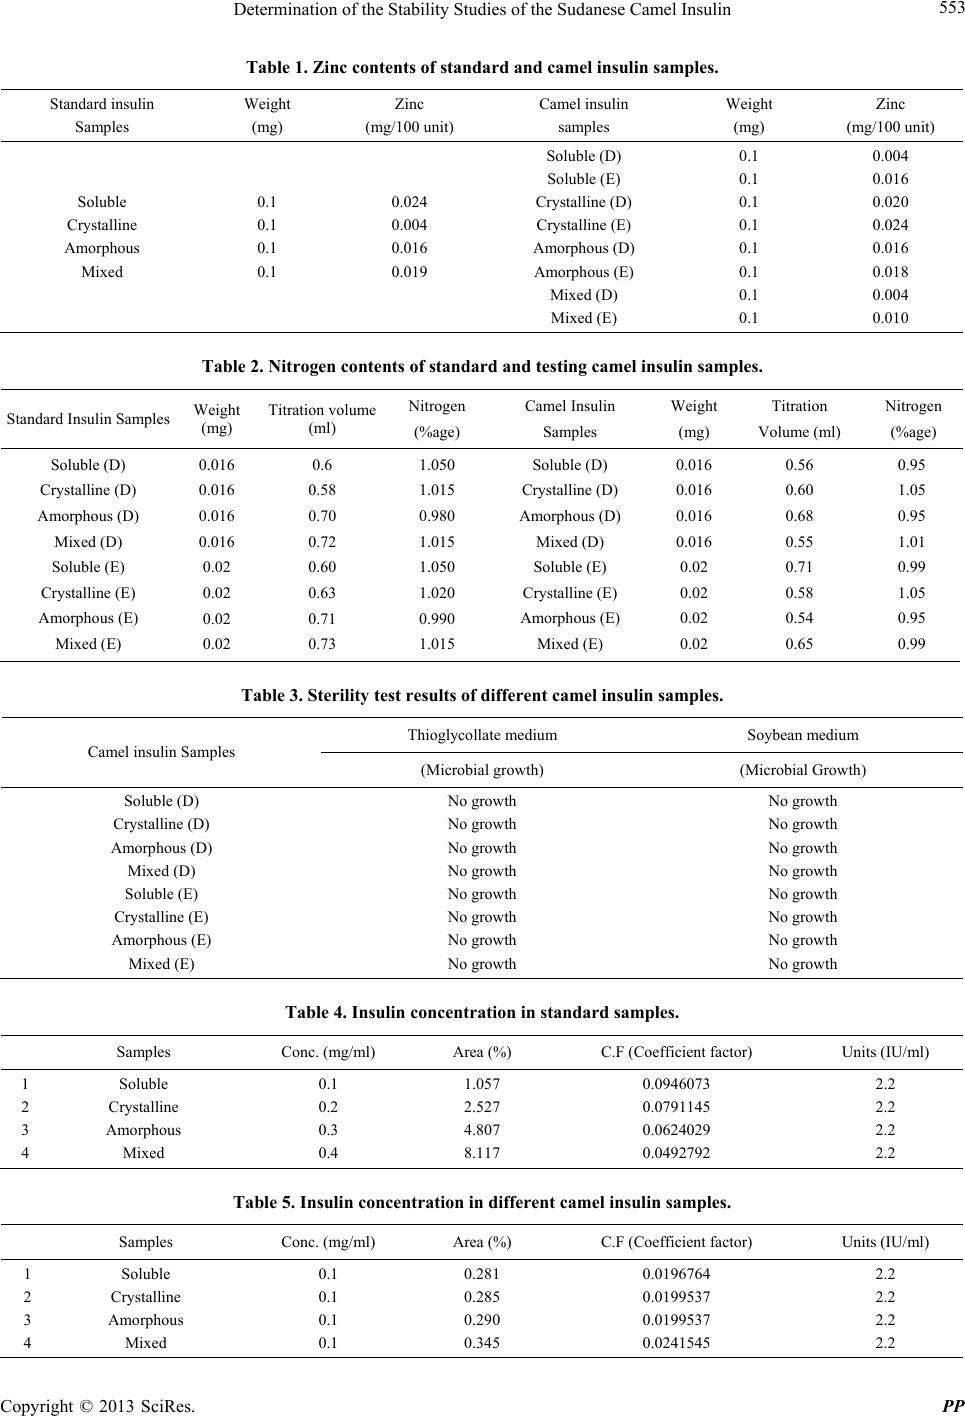
The concentration of standard insulin preparations and
testing camel insulin samples is shown in Tab les 4 an d 5
respectively. Figure 4, showed the calibration curve and
corresponding linear equation relationship among
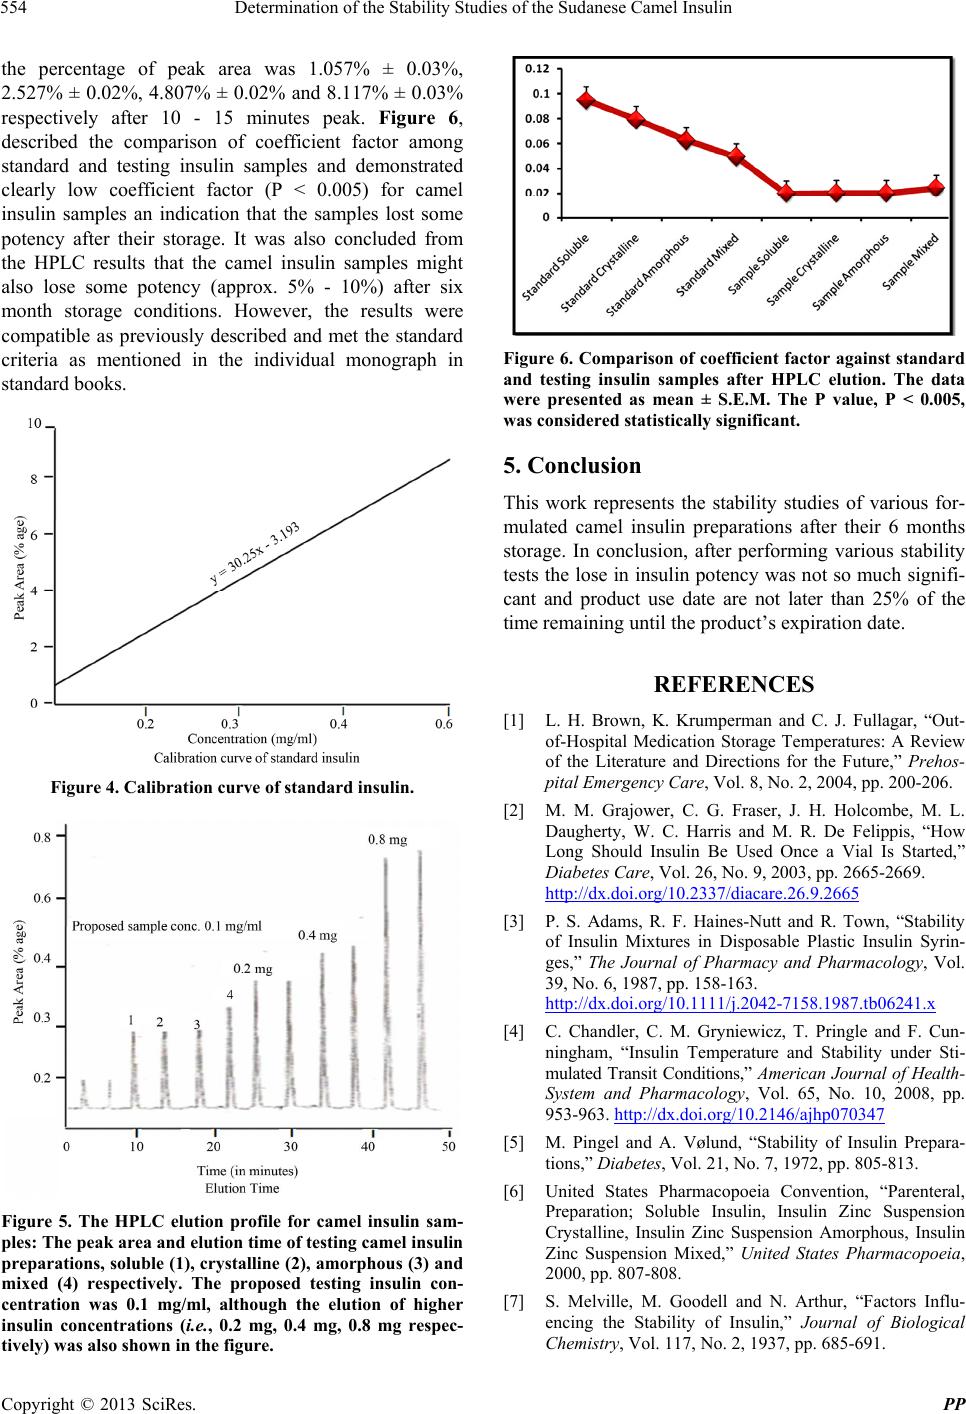
different standard insulin samples. Figure 5, represented
the HPLC elution profile for testing camel insulin
samples and reproducible doublet can be seen at
approximately 10 minutes for each sample respectively.
For camel insulin samples, the percentage of peak area
(mean ± S.E.M) was 0.281 ± 0.02%, 0.285 ± 0.01%,
0.290% ± 0.02% and 0.345 ± 0.03% respectively after 10 -
12 minutes peak while for stndard insulin preparations a
Copyright © 2013 SciRes. PP