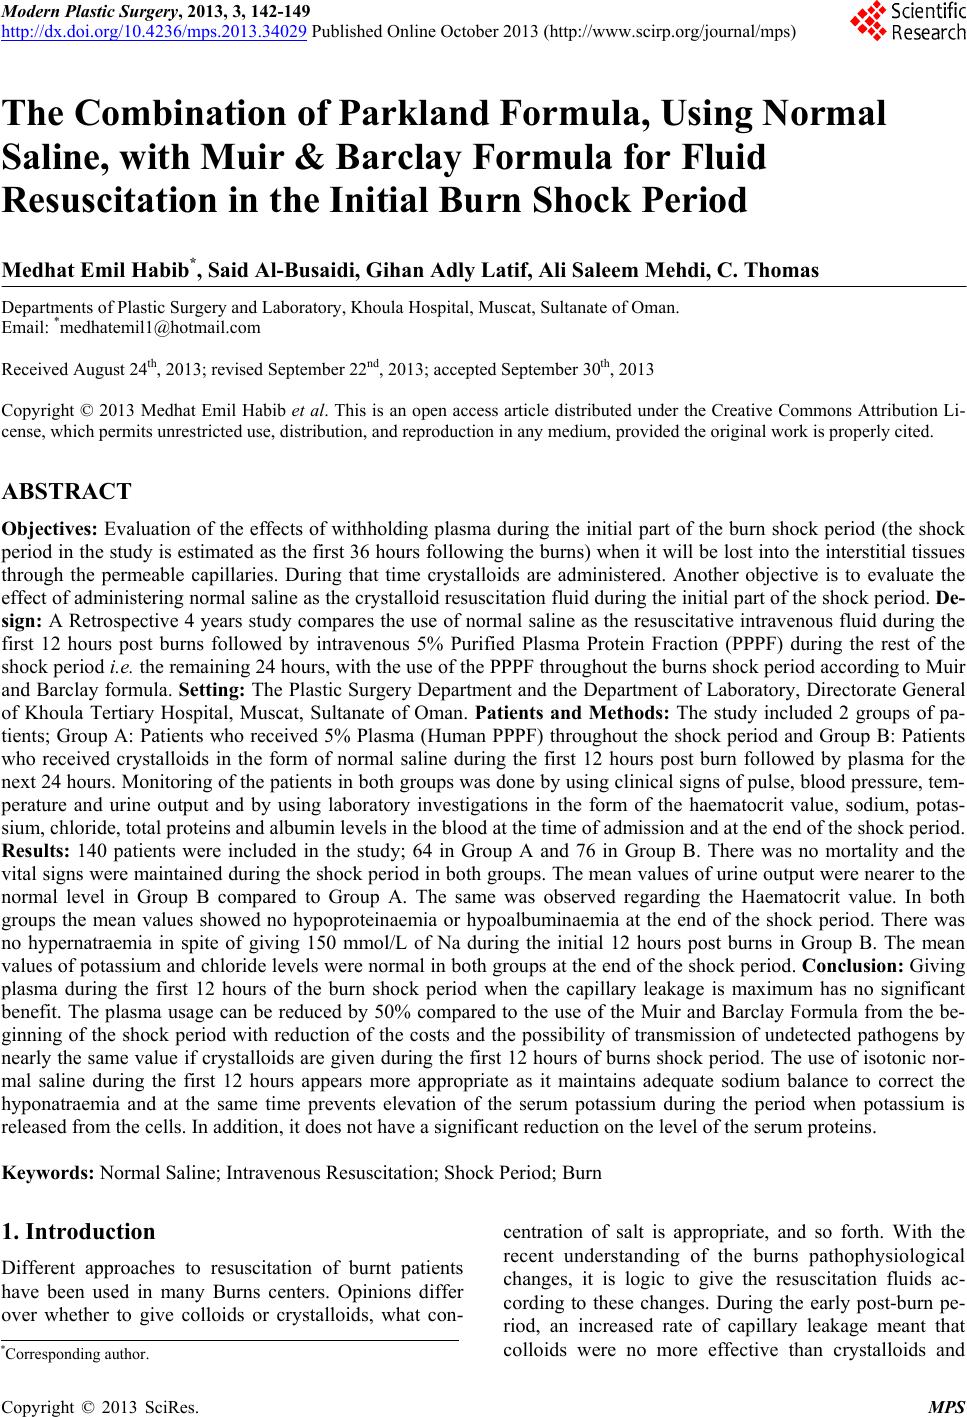
 Modern Plastic Surgery, 2013, 3, 142-149 http://dx.doi.org/10.4236/mps.2013.34029 Published Online October 2013 (http://www.scirp.org/journal/mps) The Combination of Parkland Formula, Using Normal Saline, with Muir & Barclay Formula for Fluid Resuscitation in the Initial Burn Shock Period Medhat Emil Habib*, Said Al-Busaidi, Gihan Adly Latif, Ali Saleem Mehdi, C. Thomas Departments of Plastic Surgery and Laboratory, Khoula Hospital, Muscat, Sultanate of Oman. Email: *medhatemil1@hotmail.com Received August 24th, 2013; revised September 22nd, 2013; accepted September 30th, 2013 Copyright © 2013 Medhat Emil Habib et al. This is an open access article distributed under the Creative Commons Attribution Li- cense, which permits unrestricted use, distribution, and reproduction in any medium, provided the original work is properly cited. ABSTRACT Objectives: Evaluation of the effects of withholding plasma during the initial part of the burn shock period (the shock period in the study is estimated as the first 36 hours followi ng the burns) when it will be lost into the interstitial tissues through the permeable capillaries. During that time crystalloids are administered. Another objective is to evaluate the effect of administering normal saline as the crystalloid resuscitation fluid during the in itial part of the shock period. De- sign: A Retrospective 4 years stud y compares the use of nor mal saline as the resuscitative intrav enous fluid during the first 12 hours post burns followed by intravenous 5% Purified Plasma Protein Fraction (PPPF) during the rest of the shock period i.e. the remaining 24 hours, with the use of the PPPF throughout the burns shock period according to Muir and Barclay formula. Setting: The Plastic Surgery Department and the Department of Laboratory, Directorate General of Khoula Tertiary Hospital, Muscat, Sultanate of Oman. Patients and Methods: The study included 2 groups of pa- tients; Group A: Patients who received 5% Plasma (Human PPPF) throughout the shock period and Group B: Patients who received crystalloids in the form of normal saline during the first 12 hours post burn followed by plasma for the next 24 hours. Monitoring of the patients in both groups was done by using clinical signs of pulse, blood pressure, tem- perature and urine output and by using laboratory investigations in the form of the haematocrit value, sodium, potas- sium, chloride, total proteins and albumin levels in the blood at the time of admission and at the end of the shock period. Results: 140 patients were included in the study; 64 in Group A and 76 in Group B. There was no mortality and the vital signs were maintained during the shock period in both groups. The mean values of urine output were nearer to the normal level in Group B compared to Group A. The same was observed regarding the Haematocrit value. In both groups the mean values showed no hypoproteinaemia or hypoalbuminaemia at the end of the shock period. There was no hypernatraemia in spite of giving 150 mmol/L of Na during the initial 12 hours post burns in Group B. The mean values of potassium and chloride levels were normal in both groups at the end of the shock period. Conclusion: Giving plasma during the first 12 hours of the burn shock period when the capillary leakage is maximum has no significant benefit. The plasma usage can be reduced by 50% compared to the use of the Muir and Barclay Formula from the be- ginning of the shock period with reduction of the costs and the possibility of transmission of undetected pathogens by nearly the same value if crystalloids are given during the first 12 hours of burns shock period. The use of isotonic nor- mal saline during the first 12 hours appears more appropriate as it maintains adequate sodium balance to correct the hyponatraemia and at the same time prevents elevation of the serum potassium during the period when potassium is released from the cells. In addition, it does not have a significant red uction on the level of the serum proteins. Keywords: Normal Saline; Intravenous Resuscitation; Shock Period; Burn 1. Introduction Different approaches to resuscitation of burnt patients have been used in many Burns centers. Opinions differ over whether to give colloids or crystalloids, what con- centration of salt is appropriate, and so forth. With the recent understanding of the burns pathophysiological changes, it is logic to give the resuscitation fluids ac- cording to these changes. During the early post-burn pe- riod, an increased rate of capillary leakage meant that colloids were no more effective than crystalloids and *Corresponding a uthor. Copyright © 2013 SciRes. MPS 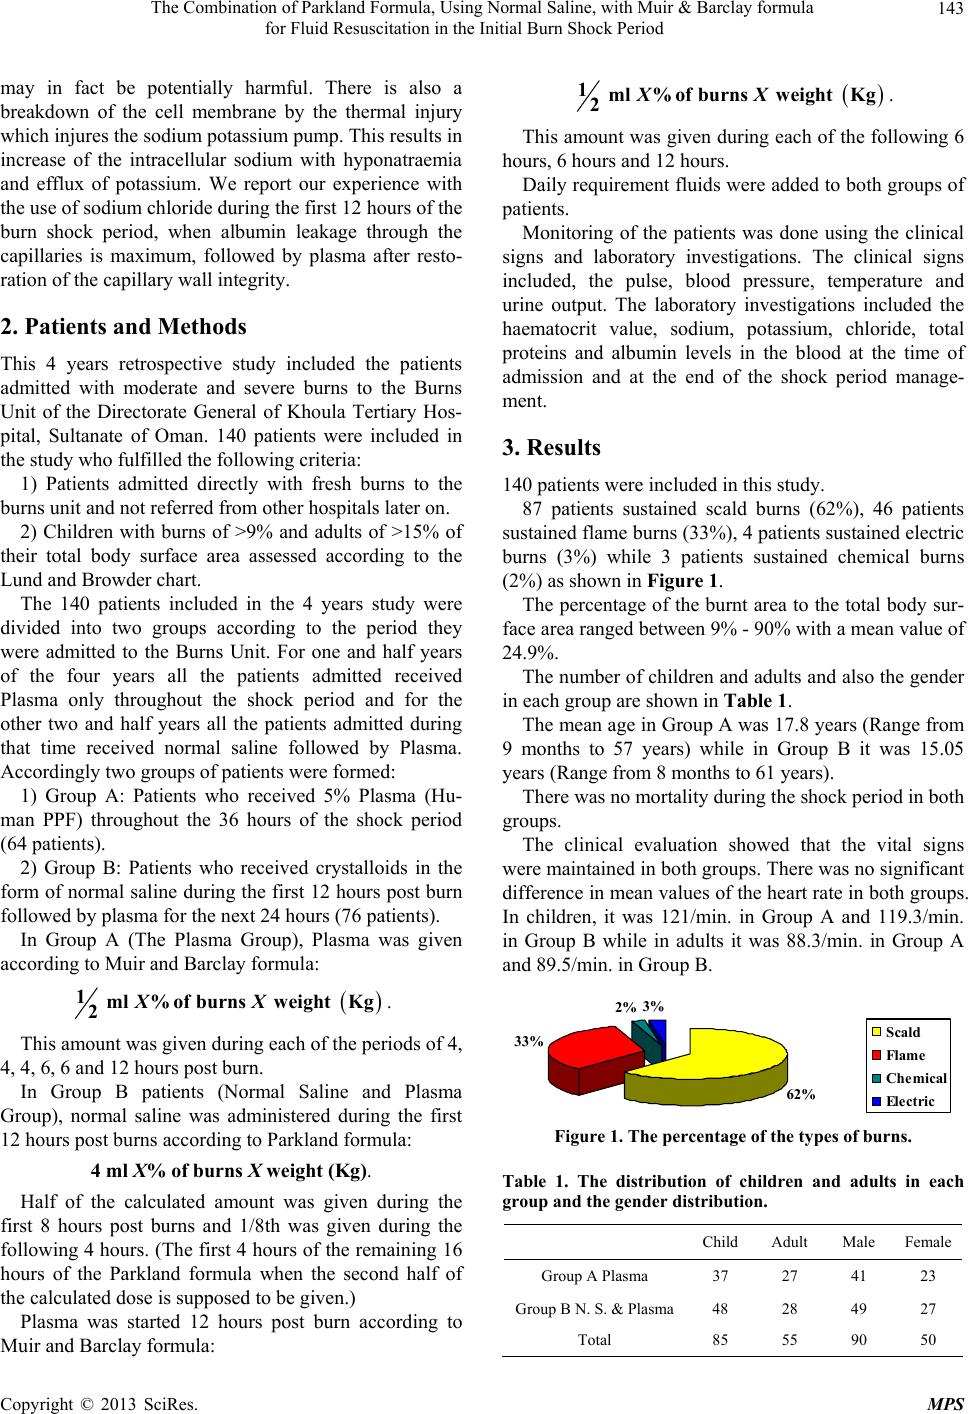 The Combination of Parkland Formula, Using Normal Saline, with Muir & Barclay formula for Fluid Resuscitation in the Initial Burn Shock Period 143 may in fact be potentially harmful. There is also a breakdown of the cell membrane by the thermal injury which injures the sodium potassium pump. This results in increase of the intracellular sodium with hyponatraemia and efflux of potassium. We report our experience with the use of sodium chloride during the first 12 hours of the burn shock period, when albumin leakage through the capillaries is maximum, followed by plasma after resto- ration of the capillary wall integrity. 2. Patients and Methods This 4 years retrospective study included the patients admitted with moderate and severe burns to the Burns Unit of the Directorate General of Khoula Tertiary Hos- pital, Sultanate of Oman. 140 patients were included in the study who fulfilled the following criteria: 1) Patients admitted directly with fresh burns to the burns unit and not referred from other hospitals later on. 2) Children with burns of >9% and adults of >15% of their total body surface area assessed according to the Lund and Browder chart. The 140 patients included in the 4 years study were divided into two groups according to the period they were admitted to the Burns Unit. For one and half years of the four years all the patients admitted received Plasma only throughout the shock period and for the other two and half years all the patients admitted during that time received normal saline followed by Plasma. Accordingly two group s of patients were formed: 1) Group A: Patients who received 5% Plasma (Hu- man PPF) throughout the 36 hours of the shock period (64 patie nts). 2) Group B: Patients who received crystalloids in the form of normal saline during the first 12 hours post burn followed by plasma for the next 24 hours (76 patients). In Group A (The Plasma Group), Plasma was given according to Muir and Barclay formula: 1ml% o f burns weightKg 2XX . This amount was given during each of the periods of 4, 4, 4, 6, 6 and 12 hours post burn. In Group B patients (Normal Saline and Plasma Group), normal saline was administered during the first 12 hours post burns according to Parkland formula: 4 ml X% of burns X weight (Kg). Half of the calculated amount was given during the first 8 hours post burns and 1/8th was given during the following 4 hours. (The first 4 hours of the remainin g 16 hours of the Parkland formula when the second half of the calculated dose is supposed to be given.) Plasma was started 12 hours post burn according to Muir and Barclay formula: 1ml% o f burns weightKg 2XX . This amount was given during each of the following 6 hours, 6 hours and 12 hours. Daily requirement fluids were added to both groups of patients. Monitoring of the patients was done using the clinical signs and laboratory investigations. The clinical signs included, the pulse, blood pressure, temperature and urine output. The laboratory investigations included the haematocrit value, sodium, potassium, chloride, total proteins and albumin levels in the blood at the time of admission and at the end of the shock period manage- ment. 3. Results 140 patients were included in this study. 87 patients sustained scald burns (62%), 46 patients sustained flame burns (33%), 4 patients sustained electric burns (3%) while 3 patients sustained chemical burns (2%) as shown in Figure 1. The percentage of the burnt area to the total body sur- face area ranged between 9% - 90% with a mean value of 24.9%. The number of children and adults and also the gender in each group are shown in Table 1. The mean age in Group A was 17.8 years (Range from 9 months to 57 years) while in Group B it was 15.05 years (Range from 8 months to 61 years). There was no mortal ity during the s hock period in bot h groups. The clinical evaluation showed that the vital signs were maintained in both groups. There was no significant difference in mean values of the heart rate in both groups. In children, it was 121/min. in Group A and 119.3/min. in Group B while in adults it was 88.3/min. in Group A and 89.5/min. in Group B. 62% 33% 2% 3% Scald Fl a me Chem i ca l Electric Figure 1. The percentage of the types of burns. Table 1. The distribution of children and adults in each group and the gender distri bution. Child Adult Male Female Group A Plasma 37 27 41 23 Group B N. S. & Plasma48 28 49 27 Total 85 55 90 50 Copyright © 2013 SciRes. MPS 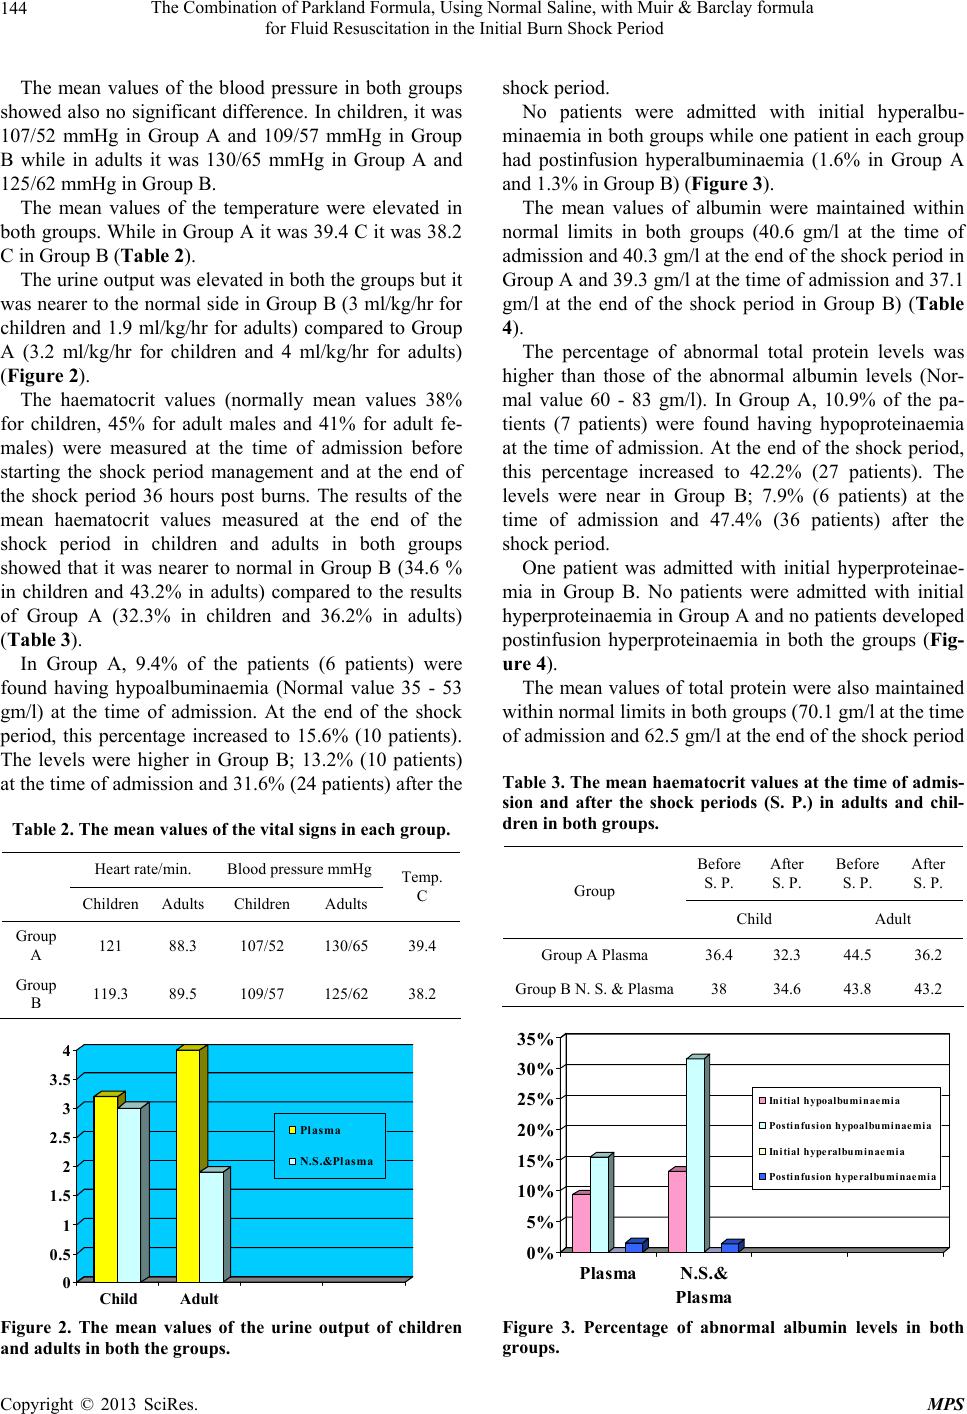 The Combination of Parkland Formula, Using Normal Saline, with Muir & Barclay formula for Fluid Resuscitation in the Initial Burn Shock Period 144 The mean values of the blood pressure in both groups showed also no significant difference. In children, it was 107/52 mmHg in Group A and 109/57 mmHg in Group B while in adults it was 130/65 mmHg in Group A and 125/62 mmHg in Group B. The mean values of the temperature were elevated in both groups. While in Group A it was 39.4 C it was 38.2 C in Group B (Table 2). The urine output was elev ated in both the groups but it was nearer to the normal side in Group B (3 ml/kg/hr for children and 1.9 ml/kg/hr for adults) compared to Group A (3.2 ml/kg/hr for children and 4 ml/kg/hr for adults) (Figure 2). The haematocrit values (normally mean values 38% for children, 45% for adult males and 41% for adult fe- males) were measured at the time of admission before starting the shock period management and at the end of the shock period 36 hours post burns. The results of the mean haematocrit values measured at the end of the shock period in children and adults in both groups showed that it was nearer to normal in Group B (34.6 % in children and 43.2% in adults) compared to the results of Group A (32.3% in children and 36.2% in adults) (Table 3). In Group A, 9.4% of the patients (6 patients) were found having hypoalbuminaemia (Normal value 35 - 53 gm/l) at the time of admission. At the end of the shock period, this percentage increased to 15.6% (10 patients). The levels were higher in Group B; 13.2% (10 patients) at the time of admission and 31.6% (24 patients) after the Table 2. The mean values of the vital signs in each group. Heart rate/min. Blood pressure mmHg Children Adults Children Adults Temp. C Group A 121 88.3 107/52 130/65 39.4 Group B 119.3 89.5 109/57 125/62 38.2 0 0.5 1 1.5 2 2.5 3 3.5 4 Child Adult Pl a sma N.S.&Plasma Figure 2. The mean values of the urine output of children and adults in both the groups. shock period. No patients were admitted with initial hyperalbu- minaemia in both groups while one patient in each group had postinfusion hyperalbuminaemia (1.6% in Group A and 1.3% in Group B) (Figure 3). The mean values of albumin were maintained within normal limits in both groups (40.6 gm/l at the time of admission and 40.3 gm/l at the end of the shock period in Group A and 39.3 gm/l at th e time of admission and 37.1 gm/l at the end of the shock period in Group B) (Table 4). The percentage of abnormal total protein levels was higher than those of the abnormal albumin levels (Nor- mal value 60 - 83 gm/l). In Group A, 10.9% of the pa- tients (7 patients) were found having hypoproteinaemia at the time of admission. At the end of the shock period, this percentage increased to 42.2% (27 patients). The levels were near in Group B; 7.9% (6 patients) at the time of admission and 47.4% (36 patients) after the shock period. One patient was admitted with initial hyperproteinae- mia in Group B. No patients were admitted with initial hyperproteinaemia in Group A and no patients developed postinfusion hyperproteinaemia in both the groups (Fig- ure 4). The mean values of total protein were also maintained within normal limits in bo th groups (70.1 gm/l at the time of admission and 62.5 gm/l at the end of the shock period Table 3. The mean haematocrit values at the time of admis- sion and after the shock periods (S. P.) in adults and chil- dren in both groups. Before S. P. After S. P. Before S. P. After S. P. Group Child Adult Group A Plasma 36.4 32.3 44.5 36.2 Group B N. S. & Plasma38 34.6 43.8 43.2 0% 5% 10% 15% 20% 25% 30% 35% PlasmaN.S.& Plasma Initial hypoalbuminaemia Postin fu s i on h ypoalbumi n aemia Initial hyperalbuminaemia Postinfusion hyperalbuminaemi a Figure 3. Percentage of abnormal albumin levels in both groups. Copyright © 2013 SciRes. MPS 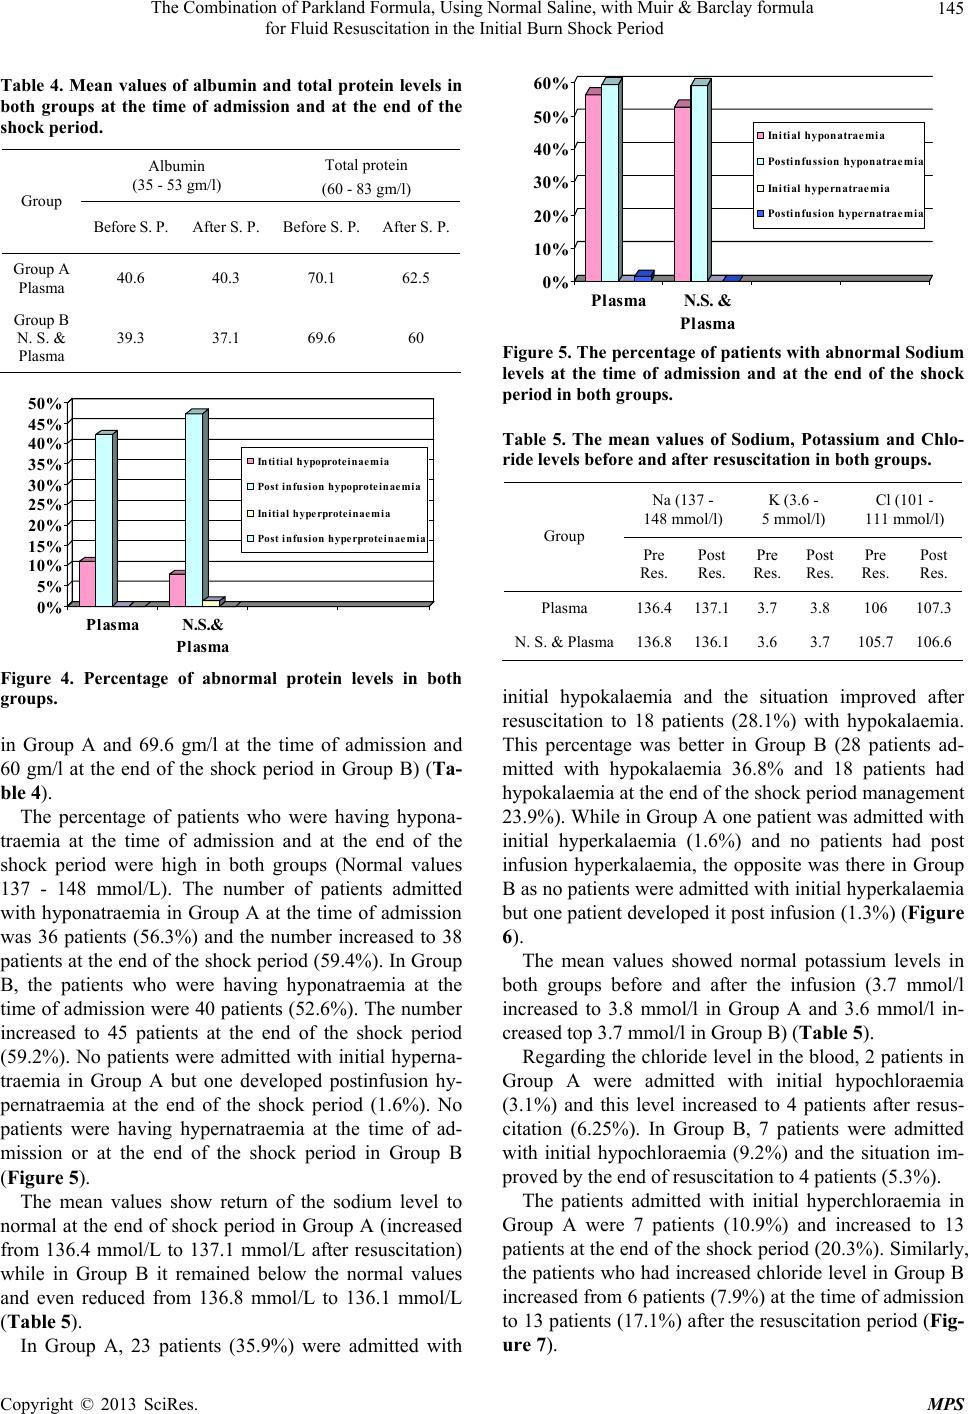 The Combination of Parkland Formula, Using Normal Saline, with Muir & Barclay formula for Fluid Resuscitation in the Initial Burn Shock Period 145 Table 4. Mean values of albumin and total protein levels in both groups at the time of admission and at the end of the shock period. Albumin (35 - 53 gm/l) Total protein (60 - 83 gm/l) Group Before S. P. After S. P. Before S. P. After S. P. Group A Plasma 40.6 40.3 70.1 62.5 Group B N. S. & Plasma 39.3 37.1 69.6 60 0% 5% 10% 15% 20% 25% 30% 35% 40% 45% 50% Plasma N.S.& Plasm Intitial hypoproteinaemia Post inf usio n hy poprot ei na em ia In itial hype rproteinaemia Post infusio n h y perprotein a emia Figure 4. Percentage of abnormal protein levels in both groups. in Group A and 69.6 gm/l at the time of admission and 60 gm/l at the end of the shock period in Group B) (Ta- ble 4). The percentage of patients who were having hypona- traemia at the time of admission and at the end of the shock period were high in both groups (Normal values 137 - 148 mmol/L). The number of patients admitted with hyponatraemia in Group A at the time of admission was 36 patients (56.3%) and the number increased to 38 patients at the end of the shock period (59.4%). In Group B, the patients who were having hyponatraemia at the time of admission were 40 patients (52.6%). The number increased to 45 patients at the end of the shock period (59.2%). No patients were admitted with initial hyperna- traemia in Group A but one developed postinfusion hy- pernatraemia at the end of the shock period (1.6%). No patients were having hypernatraemia at the time of ad- mission or at the end of the shock period in Group B (Figure 5). The mean values show return of the sodium level to normal at the end of shock period in Group A (increased from 136.4 mmol/L to 137.1 mmol/L after resuscitation) while in Group B it remained below the normal values and even reduced from 136.8 mmol/L to 136.1 mmol/L (Table 5). In Group A, 23 patients (35.9%) were admitted with 0% 10% 20% 30% 40% 50% 60% PlasmaN .S. & Plasm Initial hyponatraemia Postinfussi on h yponatraem i a Initial hype rnatraemia Postinfusi on h ypernatraem i a Figure 5. The percentage of patients with abnormal Sodium levels at the time of admission and at the end of the shock period in both groups. Table 5. The mean values of Sodium, Potassium and Chlo- ride levels before and after resuscitation in both groups. Na (137 - 148 mmol/l) K (3.6 - 5 mmol/l) Cl (101 - 111 mmol/l) Group Pre Res. Post Res. Pre Res. Post Res. Pre Res. Post Res. Plasma 136.4137.1 3.7 3.8 106 107.3 N. S. & Plasma136.8136.1 3.6 3.7 105.7106.6 initial hypokalaemia and the situation improved after resuscitation to 18 patients (28.1%) with hypokalaemia. This percentage was better in Group B (28 patients ad- mitted with hypokalaemia 36.8% and 18 patients had hypokalaemia at the end of the shock period management 23.9%). While in Group A one patient was admitted with initial hyperkalaemia (1.6%) and no patients had post infusion hyperkalaemia, the opposite was there in Group B as no patients were admitted with initial hyperk alaemia but one patient developed it post infusion (1.3%) (Figure 6). The mean values showed normal potassium levels in both groups before and after the infusion (3.7 mmol/l increased to 3.8 mmol/l in Group A and 3.6 mmol/l in- creased top 3.7 mmol/l in Group B) (Table 5). Regarding the chloride level in the blood, 2 patients in Group A were admitted with initial hypochloraemia (3.1%) and this level increased to 4 patients after resus- citation (6.25%). In Group B, 7 patients were admitted with initial hypochloraemia (9.2%) and the situation im- proved by the end of resuscitation to 4 patients (5.3%). The patients admitted with initial hyperchloraemia in Group A were 7 patients (10.9%) and increased to 13 patients at the end of the shock period (20.3%). Similarly, the patients who had increased chloride level in Group B increased from 6 patients (7.9%) at the time of admission to 13 patients (17.1%) after the resuscitation period (Fig- ure 7). Copyright © 2013 SciRes. MPS 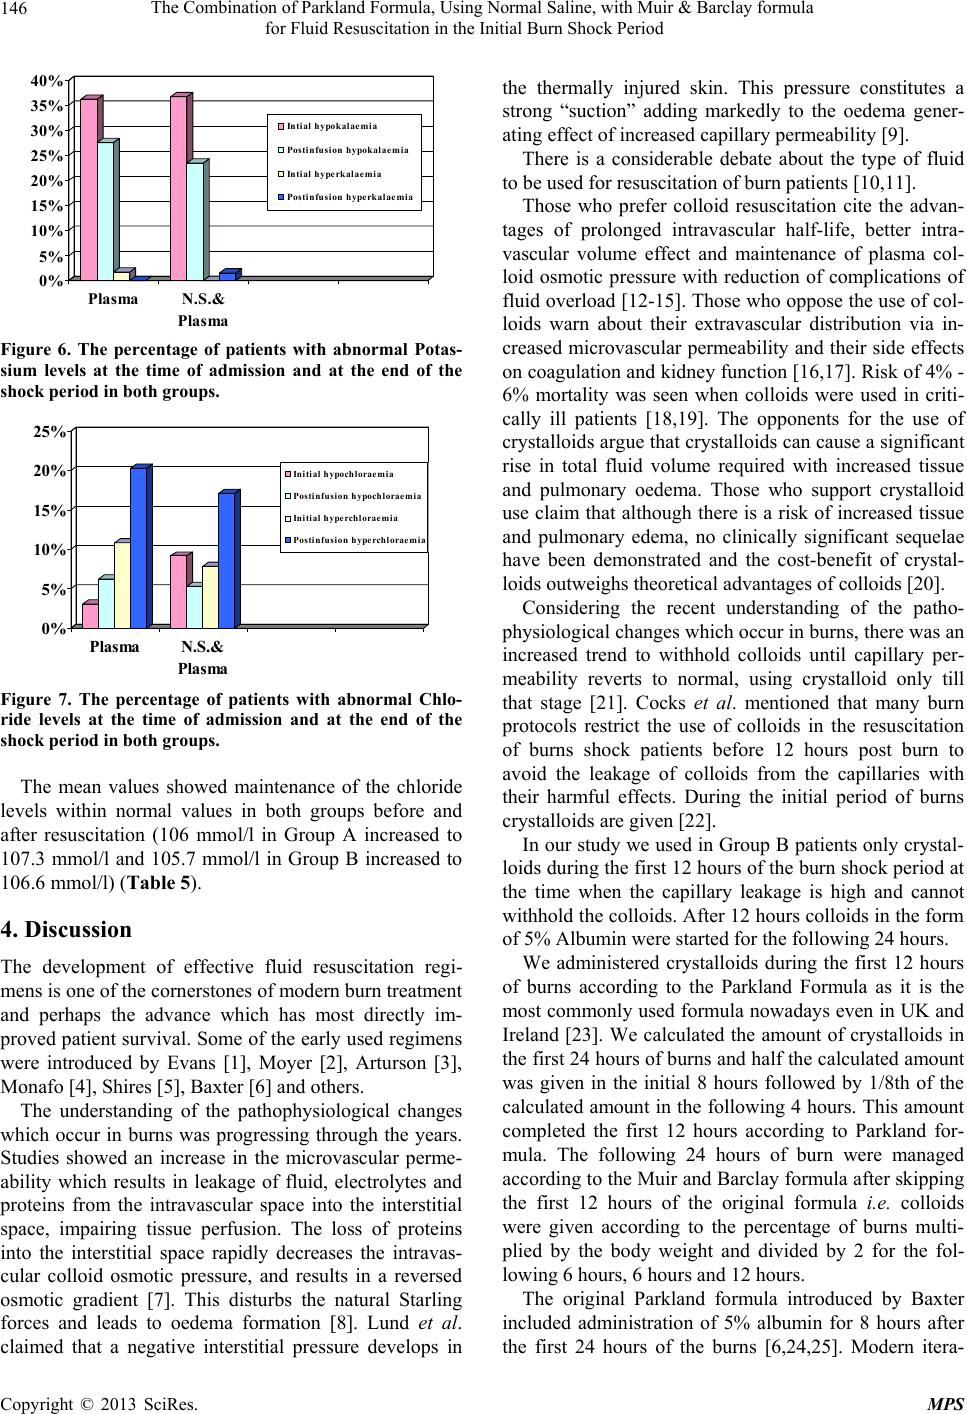 The Combination of Parkland Formula, Using Normal Saline, with Muir & Barclay formula for Fluid Resuscitation in the Initial Burn Shock Period 146 0% 5% 10% 15% 20% 25% 30% 35% 40% PlasmaN.S.& Plasma Intial hypokalaemia Postinfusion hypokalaemia Intial h yperkalaem i a Postinfusion hyperkalaemia Figure 6. The percentage of patients with abnormal Potas- sium levels at the time of admission and at the end of the shock period in both groups. 0% 5% 10% 15% 20% 25% Plasma N.S.& Plasma Initial hypochloraemia Postinfusion hypochloraemia Initial hype rchloraemia Postinfusion hyperchloraemia Figure 7. The percentage of patients with abnormal Chlo- ride levels at the time of admission and at the end of the shock period in both groups. The mean values showed maintenance of the chloride levels within normal values in both groups before and after resuscitation (106 mmol/l in Group A increased to 107.3 mmol/l and 105.7 mmol/l in Group B increased to 106.6 mmol/l) (Table 5). 4. Discussion The development of effective fluid resuscitation regi- mens is one of the cornerstones of modern burn treatment and perhaps the advance which has most directly im- proved patient survival. Some of the early used regimens were introduced by Evans [1], Moyer [2], Arturson [3], Monafo [4], Shires [5], Baxter [6] and others. The understanding of the pathophysiological changes which occur in burns was progressing through the years. Studies showed an increase in the microvascular perme- ability which results in leakage of fluid, electrolytes and proteins from the intravascular space into the interstitial space, impairing tissue perfusion. The loss of proteins into the interstitial space rapidly decreases the intravas- cular colloid osmotic pressure, and results in a reversed osmotic gradient [7]. This disturbs the natural Starling forces and leads to oedema formation [8]. Lund et al. claimed that a negative interstitial pressure develops in the thermally injured skin. This pressure constitutes a strong “suction” adding markedly to the oedema gener- ating effect of increased capillary permeability [9]. There is a considerable debate about the type of fluid to be used for resuscitation of burn patients [10,11]. Those who prefer colloid resuscitation cite the advan- tages of prolonged intravascular half-life, better intra- vascular volume effect and maintenance of plasma col- loid osmotic pressure with reduction of complications of fluid overlo ad [12-15]. Those who opp ose the use of col- loids warn about their extravascular distribution via in- creased microvascular permeability and their side effects on coagulation and kidney function [16,17]. Risk of 4% - 6% mortality was seen when colloids were used in criti- cally ill patients [18,19]. The opponents for the use of crystalloids argue that crystallo ids can cause a significan t rise in total fluid volume required with increased tissue and pulmonary oedema. Those who support crystalloid use claim that although there is a risk of increased tissue and pulmonary edema, no clinically significant sequelae have been demonstrated and the cost-benefit of crystal- loids outweighs theoretical advantages of colloids [20]. Considering the recent understanding of the patho- physiological changes which occur in burns, there was an increased trend to withhold colloids until capillary per- meability reverts to normal, using crystalloid only till that stage [21]. Cocks et al. mentioned that many burn protocols restrict the use of colloids in the resuscitation of burns shock patients before 12 hours post burn to avoid the leakage of colloids from the capillaries with their harmful effects. During the initial period of burns crystalloids are given [22]. In our study we used in Group B patients only crystal- loids during the fi rst 12 hours of the burn shock pe riod at the time when the capillary leakage is high and cannot withhold the colloids. After 12 hours collo ids in the form of 5% Albumin were started for the following 24 hours. We administered crystalloids during the first 12 hours of burns according to the Parkland Formula as it is the most commonly used formula nowadays even in UK and Ireland [23]. We calculated the amount of crystalloids in the first 24 hours of burns and half the calculated amount was given in the initial 8 hours followed by 1/8th of the calculated amount in the following 4 hours. This amount completed the first 12 hours according to Parkland for- mula. The following 24 hours of burn were managed according to the Muir and Barclay formula after skipping the first 12 hours of the original formula i.e. colloids were given according to the percentage of burns multi- plied by the body weight and divided by 2 for the fol- lowing 6 hours, 6 hours and 12 hours. The original Parkland formula introduced by Baxter included administration of 5% albumin for 8 hours after the first 24 hours of the burns [6,24,25]. Modern itera- Copyright © 2013 SciRes. MPS 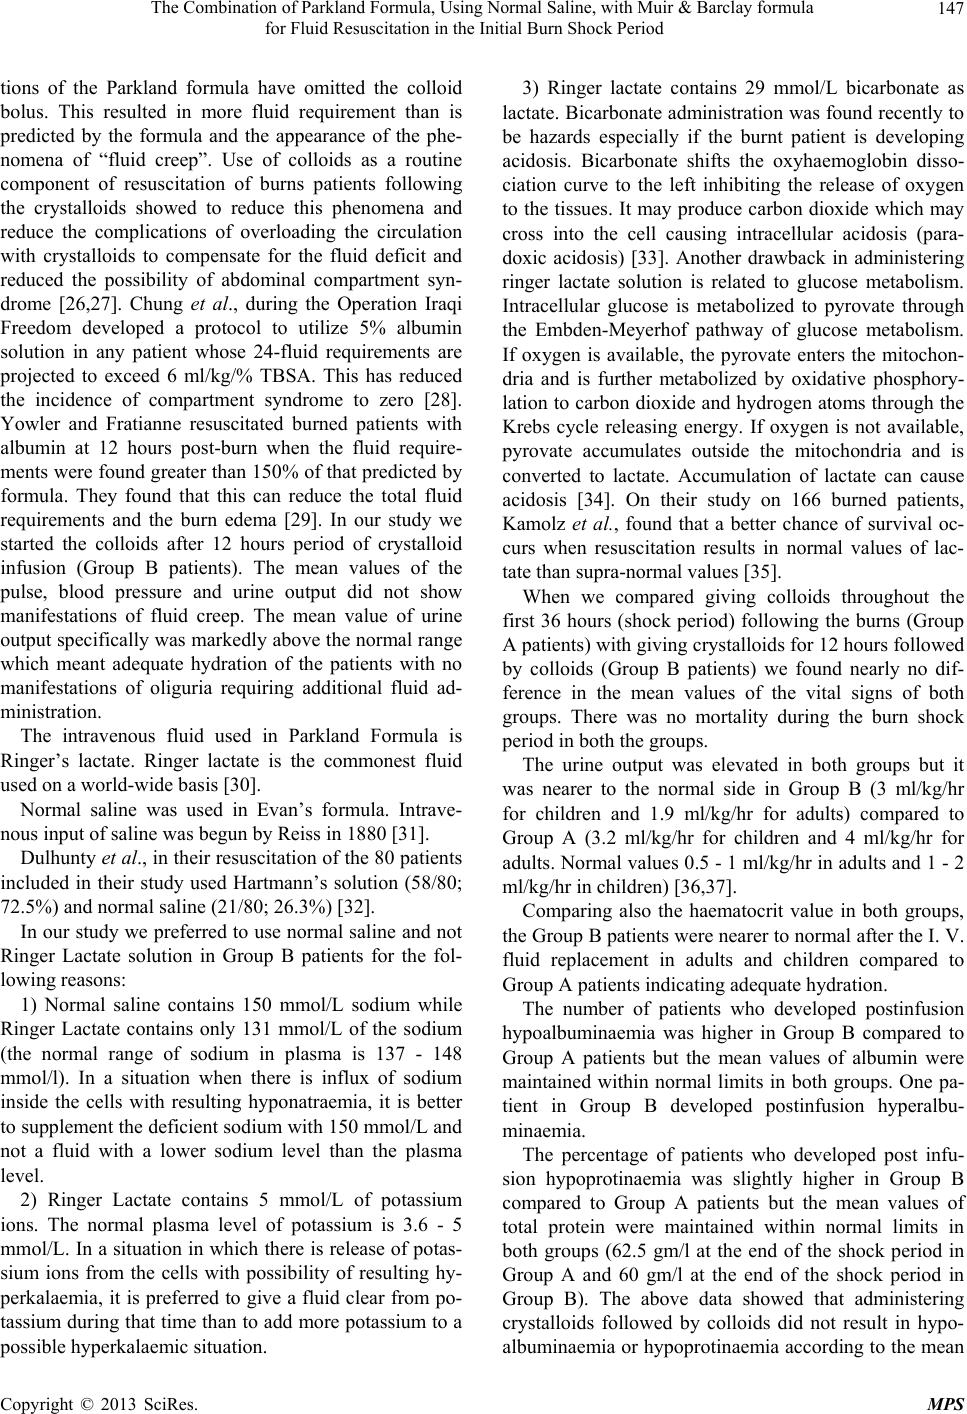 The Combination of Parkland Formula, Using Normal Saline, with Muir & Barclay formula for Fluid Resuscitation in the Initial Burn Shock Period 147 tions of the Parkland formula have omitted the colloid bolus. This resulted in more fluid requirement than is predicted by the formula and the appearance of the phe- nomena of “fluid creep”. Use of colloids as a routine component of resuscitation of burns patients following the crystalloids showed to reduce this phenomena and reduce the complications of overloading the circulation with crystalloids to compensate for the fluid deficit and reduced the possibility of abdominal compartment syn- drome [26,27]. Chung et al., during the Operation Iraqi Freedom developed a protocol to utilize 5% albumin solution in any patient whose 24-fluid requirements are projected to exceed 6 ml/kg/% TBSA. This has reduced the incidence of compartment syndrome to zero [28]. Yowler and Fratianne resuscitated burned patients with albumin at 12 hours post-burn when the fluid require- ments were found greater than 150% of that predicted by formula. They found that this can reduce the total fluid requirements and the burn edema [29]. In our study we started the colloids after 12 hours period of crystalloid infusion (Group B patients). The mean values of the pulse, blood pressure and urine output did not show manifestations of fluid creep. The mean value of urine output specifically was markedly above the normal range which meant adequate hydration of the patients with no manifestations of oliguria requiring additional fluid ad- ministration. The intravenous fluid used in Parkland Formula is Ringer’s lactate. Ringer lactate is the commonest fluid used on a world-wide basis [30]. Normal saline was used in Evan’s formula. Intrave- nous input of saline was begun by Reiss in 1880 [31]. Dulhunty et al., in their resuscitation of the 80 patients included in their study used Hartmann’s solution (58/80; 72.5%) and normal saline (21/80; 26.3%) [32]. In our study we preferred to use normal saline and not Ringer Lactate solution in Group B patients for the fol- lowing reasons: 1) Normal saline contains 150 mmol/L sodium while Ringer Lactate contains only 131 mmol/L of the sodium (the normal range of sodium in plasma is 137 - 148 mmol/l). In a situation when there is influx of sodium inside the cells with resulting hyponatraemia, it is better to supplement the deficient sodiu m with 150 mmol/L and not a fluid with a lower sodium level than the plasma level. 2) Ringer Lactate contains 5 mmol/L of potassium ions. The normal plasma level of potassium is 3.6 - 5 mmol/L. In a situation in which there is release of potas- sium ions from the cells with possibility of resulting hy- perkalaemia, it is preferred to give a fluid clear from po- tassium during that time than to add more potassium to a possibl e h y p erkalaemic sit ua tion. 3) Ringer lactate contains 29 mmol/L bicarbonate as lactate. Bicarbonate administration was found recently to be hazards especially if the burnt patient is developing acidosis. Bicarbonate shifts the oxyhaemoglobin disso- ciation curve to the left inhibiting the release of oxygen to the tissues. It may produce carbon dioxide which may cross into the cell causing intracellular acidosis (para- doxic acidosis) [33]. Another drawback in administering ringer lactate solution is related to glucose metabolism. Intracellular glucose is metabolized to pyrovate through the Embden-Meyerhof pathway of glucose metabolism. If oxygen is available, the pyrovate enters the mitochon- dria and is further metabolized by oxidative phosphory- lation to carbon dioxid e and hydrogen ato ms through the Krebs cycle releasing energy. If oxygen is not available, pyrovate accumulates outside the mitochondria and is converted to lactate. Accumulation of lactate can cause acidosis [34]. On their study on 166 burned patients, Kamolz et al., found that a better chance of survival oc- curs when resuscitation results in normal values of lac- tate than supra-normal values [35]. When we compared giving colloids throughout the first 36 hours (shock period) following the burns (Group A patients) with giving crystalloids for 12 hours followed by colloids (Group B patients) we found nearly no dif- ference in the mean values of the vital signs of both groups. There was no mortality during the burn shock period in both the groups. The urine output was elevated in both groups but it was nearer to the normal side in Group B (3 ml/kg/hr for children and 1.9 ml/kg/hr for adults) compared to Group A (3.2 ml/kg/hr for children and 4 ml/kg/hr for adults. Normal values 0.5 - 1 ml/kg/hr in adults and 1 - 2 ml/kg/hr in children) [36,37]. Comparing also the haematocrit value in both groups, the Group B patients were nearer to normal after the I. V. fluid replacement in adults and children compared to Group A patie nt s indi cat i ng adeq uat e hy d rati on. The number of patients who developed postinfusion hypoalbuminaemia was higher in Group B compared to Group A patients but the mean values of albumin were maintained within normal limits in both groups. One pa- tient in Group B developed postinfusion hyperalbu- minaemia. The percentage of patients who developed post infu- sion hypoprotinaemia was slightly higher in Group B compared to Group A patients but the mean values of total protein were maintained within normal limits in both groups (62.5 gm/l at the end of the shock period in Group A and 60 gm/l at the end of the shock period in Group B). The above data showed that administering crystalloids followed by colloids did not result in hypo- albuminaemia or hypoprotinaemia according to the mean Copyright © 2013 SciRes. MPS  The Combination of Parkland Formula, Using Normal Saline, with Muir & Barclay formula for Fluid Resuscitation in the Initial Burn Shock Period 148 values. In spite of administering 150 mmol/L of sodium in the sodium chloride solution for the initial 1 2 hours of resus- citation (Group B patients), no patients developed post- infusion hypernatraemia. At the same time the mean values of sodium postinfusion in Group B were even below the normal level compared to Group A patients which were within the normal range. These data show that administering sodium chloride does not cause hy- pernatraemia. In spite of administering no potassium ions during the first 12 hours post burn in Group B patients, the percent- age of patients who developed postinfusion hypokalae- mia in this group was less than those in Group A. One patient in Group B developed post infusion hyperkalae- mia. The mean values in both groups show normal levels of potassium at the end of the shock period in both groups. In spite of administering 150 mmol/L of chloride in the sodium chloride solution for the initial 12 hours of resuscitation (Group B patients), the percentage of pa- tients who developed postinfusion hyperchloraemia was less than those in Group A. The mean values showed maintenance of the chloride levels within normal range in both groups before and after resuscitation. 5. Conclusions Using Normal Saline in the initial part of the burn shock period is consistent with the understanding of the patho- physiology of burns and the changes that occur during its phases. Withholding plasma during the first 12 hours when the capillary leakage is maximum will reduce the loss of albumin into the interstitial space. The use of isotonic normal saline during the first 12 hours appears more appropriate as it maintains adequate sodium balance and prevents elevation of the serum po- tassium. In addition, there was no significan t reduction in the level of serum proteins. REFERENCES [1] E. Evans, O. Purnell, P. Robinett, A. Batchelor and M. Martin, “Fluid and Electrolyte Requirements in Severe Burns,” Annals of Surgery, Vol. 135, No. 6, 1952, p. 804. http://dx.doi.org/10.1097/00000658-195206000-00006 [2] C. A. Moyer, H. W. Margraf and W. W. Monafo, “Burn Shock and Extravascular Sodium Deficiency: Treatment with Ringer’s Solution with Lactate,” Archives of Surgery, Vol. 90, 1965, pp. 799-811. http://dx.doi.org/10.1001/archsurg.1965.01320120001001 [3] G. Arturson, “Pathophysiological Aspects of the Burn Syndrome with Special Reference to Liver Injury and Al- terations of Capillary Permeability,” Acta Chirurgica Scandinavica. Supplementum, Vol. 274, 1961, pp. 1-135. [4] W. W. Monafo, “The Treatment of Burn Shock by the Intravenous and Oral Administration of Hypertonic Lac- tated Saline Solution,” Journal of Trauma, Vol. 10, No. 7, 1970, pp. 575-586. http://dx.doi.org/10.1097/00005373-197007000-00006 [5] G. T. Shires, C. J. Carrico, C. R. Baxter, A. H. Giesecke and M. T. Jenkins, “Principles in Treatment of Severely Injured Patients,” Advances in Surgery, Vol. 4, 1970, pp. 255-324. [6] C. R. Baxter and T. Shires, “Physiological Response to Crystalloid Resuscitation of Severe Burns,” Annals of the New York Academy of Sciences, Vol. 150, No. 3, 1968, pp. 874-894. http://dx.doi.org/10.1111/j.1749-6632.1968.tb14738.x [7] S. Tricklebank, “Modern Trends in Fluid Therapy for Burns,” Burns, Vol. 35, No. 6, 2009, pp. 757-767. http://dx.doi.org/10.1016/j.burns.2008.09.007 [8] Guyton and Hall, “Textbook of Medical Physiology,” 9th Edition, 1996, pp. 187-193. [9] T. Lund, H. Onarheim and R. K. Reed, “Pathogenisis of Edema Formation in Burn Injuries,” World Journal of Surgery, Vol. 16, No. 1, 1992, pp. 2-9. http://dx.doi.org/10.1007/BF02067107 [10] C. Holm, “Resuscitation in Shock Associated with Burns. Tradition or Evidence-Based Medicine?” Resuscitation, Vol. 44, No. 3, 2000, pp. 157-164. http://dx.doi.org/10.1016/S0300-9572(00)00159-3 [11] A. R. Webb, “Crystalloid or Colloid for Resuscitation. Are We Any the Wiser?” Critical Care, Vol. 3, No. 3, 1999, pp. 25-28. http://dx.doi.org/10.1186/cc346 [12] L. Fodor, A. Fodor, Y. Ramon, O. Shoshani, Y. Rissin and Y. Ullmann, “Controversies in Fluid Resuscitation for Burn Management: Literature Review and Our Ex- perience,” Injury, Vol. 37, No. 5, 2006, pp. 374-379. http://dx.doi.org/10.1016/j.injury.2005.06.037 [13] M. J. Davies, “Crystalloid or Colloid: Does It Matter?” Journal of Clinical Anesthesia, Vol. 1, No. 6, 1989, pp. 464-471. http://dx.doi.org/10.1016/0952-8180(89)90013-5 [14] M. I. Griffel and B. S. Kaufman, “Pharmacology of Col- loids and Crystalloids,” Critical Care Clinics, Vol. 8, No. 2, 1992, pp. 235-253. [15] A. Aharoni, D. Abramovici, M. Weinberger, R. Moscona and B. Hirshowitz, “Burn Resuscitation with a Low-Vol- ume Plasma Regimen—Analysis of Mortality,” Baillière’s Clinical Anaesthesiology, Vol. 11, 1997, pp. 369-384. [16] R. S. Bisonni, D. R. Holtgrave, F. Lawler and D. S. Mar- ley, “Colloids versus Crystalloids in Fluid Resuscitation: An Analysis of Randomized Controlled Trials,” Journal of Family Practice, Vol. 32, No. 4, 1991, pp. 387-390. [17] D. C. Gore, J. M. Dalton and T. W. Gehr, “Colloid Infu- sions Reduce Glomerular Filtration in Resuscitated Burn Victims,” Journal of Trauma, Vol. 40, No. 3, 1996, pp. 356-360. http://dx.doi.org/10.1097/00005373-199603000-00005 [18] G. Schierhout and I. Roberts, “Fluid Resuscitation with Copyright © 2013 SciRes. MPS  The Combination of Parkland Formula, Using Normal Saline, with Muir & Barclay formula for Fluid Resuscitation in the Initial Burn Shock Period Copyright © 2013 SciRes. MPS 149 Colloid or Crystalloid Solutions in Critically Ill Patients: A Systematic Review of Randomized Trials,” BMJ, Vol. 316, No. 28, 1998, pp. 961-964. http://dx.doi.org/10.1136/bmj.316.7136.961 [19] I. Roberts, “Cochrane Injuries Group Albumin Reviewers. Human Albumin Administration in Critically Ill Patients: Systematic Review of Randomised Controlled Trials,” BMJ, Vol. 317, No. 7153, 1998, pp. 235-340. http://dx.doi.org/10.1136/bmj.317.7153.235 [20] G. V. Sudhakar, and P. Lakshmi, “Role of HES 130/ 0.4 in Resuscitation of Patients with Major Burn Injury,” Transfusion Alternatives in Transfusion Medicine, Vol. 10, No. 2, 2008, pp. 43-50. http://dx.doi.org/10.1111/j.1778-428X.2008.00107.x [21] R. Cole, “The UK Albumin Debate,” Burns, Vol. 25, No. 7, 1999, p. 565. [22] A. J. Cocks, A. O’Connell and H. Martin, “Crystalloids, Colloids and the Kids: A Review of Paediatric Burns in Intensive Care,” Burns, Vol. 24, No. 8, 1998, pp. 717-724. http://dx.doi.org/10.1016/S0305-4179(98)00102-8 [23] S. Tricklebank, “Modern Trends in Fluid Therapy for Burns,” Burns, Vol. 35, No. 6, 2009, pp. 757-767. http://dx.doi.org/10.1016/j.burns.2008.09.007 [24] M. Haberal, E. S. Abali and H. Karakayali, “Fluid Man- agement in Major Burn Injuries,” Indian Journal of Plas- tic Surgery, Vol. 43, Suppl. 1, 2010, pp. 29-36. http://dx.doi.org/10.4103/0970-0358.70715 [25] G. D. Warden, “Burn Shock Resuscitation,” World Jour- nal of Surgery, Vol. 16, No. 1, 1992, pp. 16-23. http://dx.doi.org/10.1007/BF02067109 [26] C. Csontos, V. Foldi, T. Fischer and L. Bogar, “Factors Affecting Fluid Requirement on the First Day after Se- vere Burn Trauma,” ANZ Journal of Surgery, Vol. 77, No. 9, 2007, pp. 745-748. http://dx.doi.org/10.1111/j.1445-2197.2007.04221.x [27] J. R. Saffle, “The Phenomenon of ‘Fluid Creep’ in Acute Burn Resuscitation,” Journal of Burn Care & Research, Vol. 28, No. 3, 2007, pp. 382-395. [28] K. K. Chung, L. H. Blackbourne, S. E. Wolf, et al., “Evolution of Burn Resuscitation in Operation Iraqi Free- dom,” Journal of Burn Care & Research, Vol. 27, No. 5, 2006, pp. 606-611. http://dx.doi.org/10.1097/01.BCR.0000235466.57137.f2 [29] C. J. Yowler and R. B. Fratianne, “Current Status of Burn Resuscitation,” Clinics in Plastic Surgery, Vol. 27, No. 1, 2000, pp. 1-10. [30] A. D. Mansfield, “Resuscitation and Monitoring,” Resus- citation, Vol. 44, No. 3, 2000, pp. 157-164. [31] D. Mahler, A. Baruchin, D. Hauben, A. R. Moscona, B. Hirshowitz, H. Y. Kaplan, I. Peled, M. R. Wexler, E. Vure and J. Shulman, “Recent Concepts Regarding the Resuscitation of the Burned Patient,” Burns, Vol. 9, No. 1, 1982, pp. 30-37. http://dx.doi.org/10.1016/0305-4179(82)90133-4 [32] J. M. Dulhunty, R. J. Boots, M. J. Rudd, M. J. Muller and J. Lipman, “Increased Fluid Resuscitation Can Lead to Adverse Outcomes in Major-Burn Injured Patients, but Low Mortality Is Achievable,” Burns, Vol. 34, No. 8, 2008, pp. 1090-1097. http://dx.doi.org/10.1016/j.burns.2008.01.011 [33] R. Touquet, J. Fothergill and M. W. Platt, “Resuscita- tion,” In: R. M. Kirk, A. O. Mansfield and J. P. S. Coch- rane, Eds., Clinical Surgery in General, 3rd Edition, 1999, pp. 3-18. [34] W. F. Ganong, “Review of Medical Physiology; Section IV Endocrinology, Metabolism and Reproductive Func- tion; 17 Energy Balance,” Metabolism and Nutrition, 1995, pp. 255-289. [35] L. P. Kamolz, H. Andel, W. Schramm, G. Meissl, D. N. Herndon and M. Frey, “Lactate: Early Predictor of Mor- bidity and Mortality in Patients with Severe Burns,” Burns, Vol. 31, No. 8, 2005, pp. 986-990. http://dx.doi.org/10.1016/j.burns.2005.06.019 [36] J. K. Rose and D. N. Herndon, “Advances in the Treat- ment of Burn Patients,” Burns, Vol. 23, Suppl. 1, 1997, pp. S19-S26. [37] G. D. Warden, “Burn Shock Resuscitation,” World Jour- nal of Surgery, Vol. 16, No. 1, 1992, pp. 16-23. http://dx.doi.org/10.1007/BF02067109
|