 Technology and Investment, 2013, 4, 10-15 doi:10.4236/ti.2013. 43B002 Published Online August 2013 (http://www.scirp.org/journal/ti) Comparing the Eff ects of CAF TA on Internal Trade of China and ASEAN Countries Tavi Supriana Department of Agribusiness, Faculty of Agriculture, University of Sumatera Utara, Medan, Indonesia Email: tavihutasuhut@yahoo.co.id Received April, 2013 ABSTRACT This paper compares the effects of CAFTA on internal trade of China and ASEAN Countries. ASEAN countries are analyzed individually, by developing two gravity models and using the panel data of 7 samples countries and areas from 2002 to 2010. The empirical result shows that GDP, distance, exchange rate, population and policy framework of CAFTA are trade determinant factors for China and ASEAN countries. The effects of CAFTA implementation in this study can be divided in four categories. Firstly, positive and significant effect. Singapore and Malaysia are gaining this effect. Secondly, positive effect but not significant, China and Thailand are gaining this effect. Thirdly, negative but not significant. Indonesia is having negative but not significant effect. Fourthly, negative and significant. Philippines is having this effect. Negative effect is happened to Indonesia and Philippines, not significant for Indonesia, but signifi- cant for Philippines. These two countries are getting less compare to other ASEAN countries. The rank of ASEAN countries that receive the greatest effect of CAFTA to the smallest one, that is: Singapore, Malaysia, Thailand, Indone- sia and the last Philippines and this result is similar with the rank of countries Total Factor Productivity (TFP) growth rate. Keywords: CAFTA; Internal Trade; Determinant Factors; Positive Effect; Negative Effect 1. Introduction China ASEAN Free Trade Area (CAFTA) is the world’s third largest regional free trade area, after European Union (EU) and North America Free Trade Area (NAFTA). CAFTA has a population of 1.9 Billion, covers a total land area of 14 million km2, with US$6000 Billion of GDP and trade volume of US$ 4500 Billion, including ASEAN and China. The Agreement Framework on China-ASEAN Comprehensive Economic Cooperation (CEC) was signed in 2002 and will be implemented gradually over a period of 10 years. This means that the former members of ASEAN countries, Indonesia, Malaysia, Singapore, Thailand, Philippines and Brunei Darussalam began to implement CAFTA in full on January 1, 2010. ASEAN countries which joined later, namely Vietnam, Laos, Cambodia and Myanmar, will implement this agreement in 2015. The implementation of CAFTA has actually started in 2004. The participants agreed to implement an Early Harvest Program (EHP) with a package of agricultural and industrial products. The EHP committed the partici- pating countries to the elimination of tariffs on agricul- tural and industrial products between 2004 and 2006. By the 1st January 2004, the tariff on approximately 600 kinds of products (mainly agricultural produce) shall be lowered. The products include live animals, meat and edible meat offal, fish, dairy products, other animal products, live trees, edible vegetable, edible fruits, and nuts. The tariff reduction was between 0 to 10 per cent, and by 1st January 2006, should have been under zero tariffs. CAFTA was expected to increase trade flows, market access services, investment rules and regulations, and improve aspects of economic cooperation to promote economic relations in order to improve welfare of the members. According to the statistics of China’s Ministry of Commerce, since the implementation of CAFTA, China has risen its position from the sixth to the third largest trade partner of ASEAN, and ASEAN has been the fourth largest trade partner of China for years. Bilateral trade volume increased from US$ 78.2 Billion in 2003 to US$231.1 Billion in 2008. However the impact of the CAFTA implementation is not the same between countries. CAFTA presents differ- ent opportunities and challenges to different ASEAN members due to the gaps of level of development. Another determinant factor is differentiation in cost of production between ASEAN members and between ASEAN and China, relatively. China’s relatively lower cost of pro- duction compared to ASEAN has decreased the export Copyright © 2013 SciRes. TI  T. SUPRIANA 11 competitiveness of ASEAN. Differentiation of cost of production between ASEAN countries even exist. Beside differentiation in cost of production, there is homogeneity in production and exports in the region. China and ASEAN has similar sectors of commodities production and exports. In this condition, theoretically only countries which have the lowest of cost production will gain in trading. The magnitude of the trade increases as a result of this agreement has been reviewed by several researchers. Various studies are generally done to the economy of China. [1] analyzed the effect of CAFTA implementation on China trade. This paper focused on both China’s bi- lateral trade with its trading partner along with its effect, both creation and diversion effects. The result showed that the diversion effect is greater than the creation effect. [2] investigated the implementation of CAFTA on In- donesia trade and found that the diversion and creation effects on Indonesia are not significant. She also found that the diversion effect, which leads to a decrease in society’s wealth, is greater than that of the creation effect. [3] explored the impact of CAFTA on ASEAN’s man- ufacturing industry and finds that there are members of ASEAN which receive a positive impact and there are will lose. China has a large market, lower cost of labour and other types of cost production, a reliable stock of human capital and attractive investment incentives. The threat is even greater since most of the products produced and exported by China are also produced and exported by ASEAN. This has resulted in a huge competition since the two regions are substituted and complementary goods. Therefore both regions have to compete each other. There are several techniques could be used to analyze the effects of free trade area implementation. The first technique is CGE (Computable General Equilibrium), such as Global Trade Analysis Project (GTAP). [4] analyze impacts of China-ASEAN free trade area using GTAP model, upgraded database to 2010 with dynamic recursive approach, designed baseline projection and scenario analysis to simulate the long term impacts of China-ASEAN free trade on trade, import and export price, GDP, and resident’s income. Compared with baseline projection, implementation of CAFTA would have significant impacts on trade, production, GDP and resident’s income to CAFTA members, bilateral trading partners and other countries. As the distortion of tariff on trade was declined, import prices of products with tariff reduction could decrease in China and most ASEAN members. CAFTA could provide trade internally in the free trade area, and adjust the domestic production structure of the members. Under the policy framework of CAFTA, China could give priority to increase products with comparative advantages. ASEAN members could shift resources from agricultural sector to industrial sector. Another technique that usually uses to analyze trade creation and diversion is Balassian model. [5] used Balassian model to measure the trade creation and trade diversion of China-ASEAN Free trade area on china’s import. OLS and Chow test for structural change across time are employed. The result is that there is evidence of trade creation of CAFTA on China’s import and no evidence of trade diversion on China’s import from extra-region. [6] analyzed impact of the China–ASEAN Free Trade Area (CAFTA) on China’s international agricultural trade and its regional agricultural development, using the Global Trade Analysis Project model and the China Agricultural Decision Support System. The analysis showed that: 1) CAFTA will improve resource allocation efficiencies for both China and ASEAN and will promote bilateral agricultural trade and, hence, will have positive effects on the economic development of both sides; 2) CAFTA will accelerate China’s export of the agricultural commodities in which it has comparative advantages, such as vegetables, wheat and horticultural products, but at the same time bring about a large increase in imports of commodities such as vegetable oil and sugar; and 3) CAFTA will have significantly varying impacts on China’s regional agricultural development because of large differences in the agricultural production structure in each region. [7] analyzed the impact of CAFTA implementation on Indonesia’s export by using the GTAP model; a Multi Regional Computable General Equilibrium Model. The results shows that CAFTA provides opportunities for increased export from Indonesia; Indonesia obtained a net trade creation of international trade amounted to 2% and total exports growth increased by 1.8. However, the export performance of Indonesia in the period showed a decrease of competitiveness, as shown by the decline in share of Indonesian export commodities which are highly competitive and high intra-industry linkage. This paper also found that the commodity structure of China and the non compeeting behavior of ASEAN countries including Indonesia (tends to complement), China is relatively easier to penetrate ASEAN market. All of related studies treated ASEAN countries as a group, and compared the effect to China. This paper will compare the effects of the CAFTA on internal trade of ASEAN countries and China, and ASEAN countries would be analyzed individually. Beside the effects of CAFTA this paper also analyzes the determinants of trade for China and ASEAN. 2. Theoretical Analysis and Empirical Methodology The model used in this study is gravity model. Gravity Copyright © 2013 SciRes. TI  T. SUPRIANA 12 model employed because beside to analyze the effect of CAFTA, the model can also use to study the trade determination factors. The model is based on Newton’s law of gravitation, which states that the force of gravity between two objects is affected by the mass and the distance between that two objects. In the context of international trade, this model suggests that the intensity of trade between countries will also be affected by the mass and the distance between countries, which mass is described by the national income or population. Gravity model is used for several reasons. First, the gravity model is supported by various trade theories, including the classical trade theories and the new trade theories. Second, the gravity model can analyze the determination variables of trade, both macroeconomics variables such as aggregate income, per capita income, exchange rates, transportation costs, and social variables, such as population, political system, as well as cultural variables, such as the common language. Third, gravity models can be used to analyze the impact of a trade poli- cies such as, cooperation policies (bilateral, multilateral, regional, financial, border), institutional policies, and other trade policies. One form of the development of gravity models is to use the power of gravity between the two particles is represented by the value of trade or exports from country i to country j, while GDP of both countries to represent the mass of both particles and distance between the two particles is represented by the great circle distance calculation. According to Chen and Tu (2005), the basic version of gravity model takes the following form: Ln Xij = β0 + β1 ln(YiYj) + β2 ln Dij + µij` (1) where Xij is the value of exports from country i to country j, Yi and Yj are the GDPs of country i and j, Dij is the distance between country i and country j, β0 is a constant, β1 and β2 are the elasticities and µij is the error term. This study aims to examine the effect of the implementation of CAFTA on the magnitude of the trade flow in ASEAN countries and China for the period 2002-2010. The selected countries of the ASEAN are Indonesia, Malaysia, Philippines, Singapore, and Thailand. Brunei Darussalam has been excluded in this analysis because the lack of the data. These countries were chosen because it is the first ASEAN countries that apply the agreement in early 2004, by removing all tariffs for agricultural commodities are traded. ASEAN members that joint later, namely Vietnam, Laos, Cambodia, and Myanmar, haven’t implemented this agreement until 2015. The model used is static gravity model modified from the study [1]. In this case, a dummy variable will be used to measure the impact of CAFTA on the trade flow (export and imports). This paper uses year 2004 as the starting point, since the EHP agreement was first implemented in 2004. Data pre 2004 are used to describe the flows of trade pre CAFTA implementation. The model used to analyze the impact of CAFTA on export of ASEAN countries and China is as follows: 012 34 5 lnX ln ln ln ln_ t cj tt cj cj tt cjjcj cj GDP GDPDIST ERPOPIN CAFTA t where: is volume of export between country c and country j t c GDP GDP DIST j : is distance between country c and country j : is GDP between country c and country j cj cj : is an exchange rate between country c and country j ER POP _ : is population of country j t cj NCAFTA : is dummy variable, 0 for year’s pre CAFTA, 1 otherwise β0: is constant β1, β2, …, β5: are elasticities t cj : is error term The model used to analyze the impact of CAFTA on import of ASEAN countries and China is as follows: 012 34 5 lnIMP ln ln ln ln_ t cj tt cj cj tt cjjcj cj GDP GDPDIST ERPOPIN CAFTA t where: is volume of import between country c and country j t c GDP GDP DIST j : is distance between country c and country j : is GDP between country c and country j cj cj : is an exchange rate between country c and country j ER POP : is population of country j _t cj NCAFTA : is dummy variable, 0 for year’s pre CAFTA, 1 otherwise. β0: is constant β1, β2, …, β5: are elasticities : is error term Gross Domestic Product (GDP) and population represent the size of a country’s economy. The larger the GDP, the greater the amount of goods and services can be traded, so that the expected value of β1 is positive. The distance across the capital cities is used to measure transportation costs, time costs, synchronization fees, and transaction costs. The greater the distance between countries, the greater the transportation costs and the less the flow of trade will be, so that value of β2 is negative. Exchange rate is one of the factors which may affect trade, the more expensive the currency of a country relatively, the more expensive the goods and services originating from the country. This increased prices will reduce the amount of demand for goods and services traded, so that the expect value of β3 is negative. Population represents the market size of a country. Population effect on trade is positive. Increase in population led to an increase in Copyright © 2013 SciRes. TI 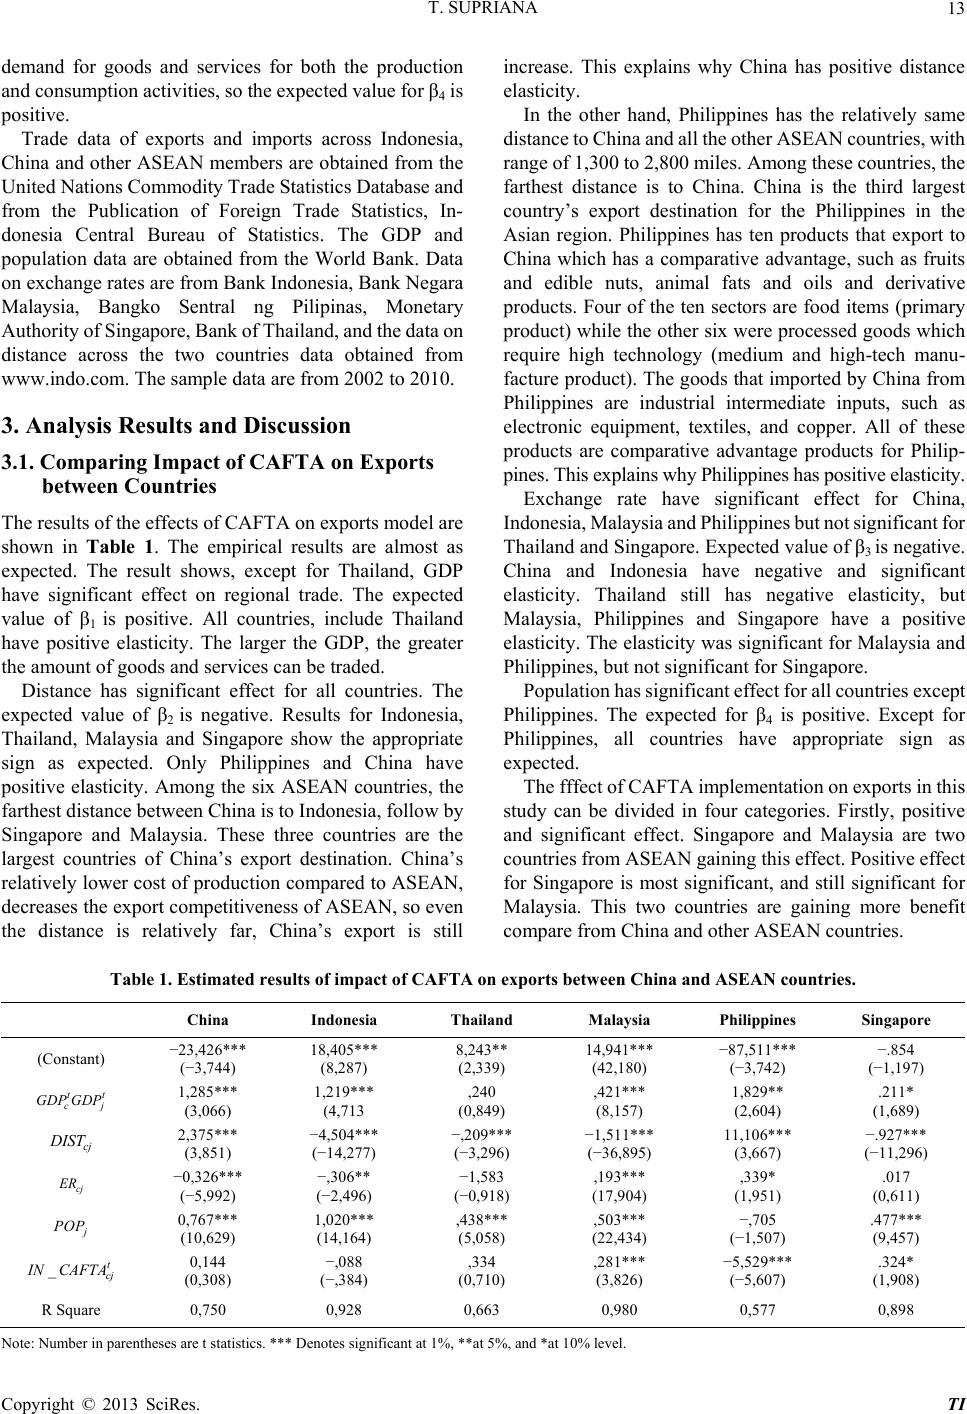 T. SUPRIANA Copyright © 2013 SciRes. TI 13 demand for goods and services for both the production and consumption activities, so the expected value for β4 is positive. Trade data of exports and imports across Indonesia, China and other ASEAN members are obtained from the United Nations Commodity Trade Statistics Database and from the Publication of Foreign Trade Statistics, In- donesia Central Bureau of Statistics. The GDP and population data are obtained from the World Bank. Data on exchange rates are from Bank Indonesia, Bank Negara Malaysia, Bangko Sentral ng Pilipinas, Monetary Authority of Singapore, Bank of Thailand, and the data on distance across the two countries data obtained from www.indo.com. The sample data are from 2002 to 2010. 3. Analysis Results and Discu s sion 3.1. Comparing Impact of CAFTA on Exports between Countries The results of the effects of CAFTA on exports model are shown in Table 1. The empirical results are almost as expected. The result shows, except for Thailand, GDP have significant effect on regional trade. The expected value of β1 is positive. All countries, include Thailand have positive elasticity. The larger the GDP, the greater the amount of goods and services can be traded. Distance has significant effect for all countries. The expected value of β2 is negative. Results for Indonesia, Thailand, Malaysia and Singapore show the appropriate sign as expected. Only Philippines and China have positive elasticity. Among the six ASEAN countries, the farthest distance between China is to Indonesia, follow by Singapore and Malaysia. These three countries are the largest countries of China’s export destination. China’s relatively lower cost of production compared to ASEAN, decreases the export competitiveness of ASEAN, so even the distance is relatively far, China’s export is still increase. This explains why China has positive distance elasticity. In the other hand, Philippines has the relatively same distance to China and all the other ASEAN countries, with range of 1,300 to 2,800 miles. Among these countries, the farthest distance is to China. China is the third largest country’s export destination for the Philippines in the Asian region. Philippines has ten products that export to China which has a comparative advantage, such as fruits and edible nuts, animal fats and oils and derivative products. Four of the ten sectors are food items (primary product) while the other six were processed goods which require high technology (medium and high-tech manu- facture product). The goods that imported by China from Philippines are industrial intermediate inputs, such as electronic equipment, textiles, and copper. All of these products are comparative advantage products for Philip- pines. This explains why Philippines has positive elasticity. Exchange rate have significant effect for China, Indonesia, Malaysia and Philippines but not significant for Thailand and Singapore. Expected value of β3 is negative. China and Indonesia have negative and significant elasticity. Thailand still has negative elasticity, but Malaysia, Philippines and Singapore have a positive elasticity. The elasticity was significant for Malaysia and Philippines, but not significant for Singapore. Population has significant effect for all countries except Philippines. The expected for β4 is positive. Except for Philippines, all countries have appropriate sign as expected. The fffect of CAFTA implementation on exports in this study can be divided in four categories. Firstly, positive and significant effect. Singapore and Malaysia are two countries from ASEAN gaining this effect. Positive effect for Singapore is most significant, and still significant for Malaysia. This two countries are gaining more benefit compare from China and other ASEAN countries. Table 1. Estimated results of impact of CAFTA on exports between China and ASEAN countr ies. China Indonesia Thailand Malaysia Philippines Singapore (Constant) −23,426*** (−3,744) 18,405*** (8,287) 8,243** (2,339) 14,941*** (42,180) −87,511*** (−3,742) −.854 (−1,197) tt cj GDP GDP 1,285*** (3,066) 1,219*** (4,713 ,240 (0,849) ,421*** (8,157) 1,829** (2,604) .211* (1,689) cj IST 2,375*** (3,851) −4,504*** (−14,277) −,209*** (−3,296) −1,511*** (−36,895) 11,106*** (3,667) −.927*** (−11,296) cj R −0,326*** (−5,992) −,306** (−2,496) −1,583 (−0,918) ,193*** (17,904) ,339* (1,951) .017 (0,611) OP 0,767*** (10,629) 1,020*** (14,164) ,438*** (5,058) ,503*** (22,434) −,705 (−1,507) .477*** (9,457) _t cj NCAFTA 0,144 (0,308) −,088 (−,384) ,334 (0,710) ,281*** (3,826) −5,529*** (−5,607) .324* (1,908) R Square 0,750 0,928 0,663 0,980 0,577 0,898 N ote: Number in parentheses are t statistics. *** Denotes significant at 1%, **at 5%, and *at 10% level. 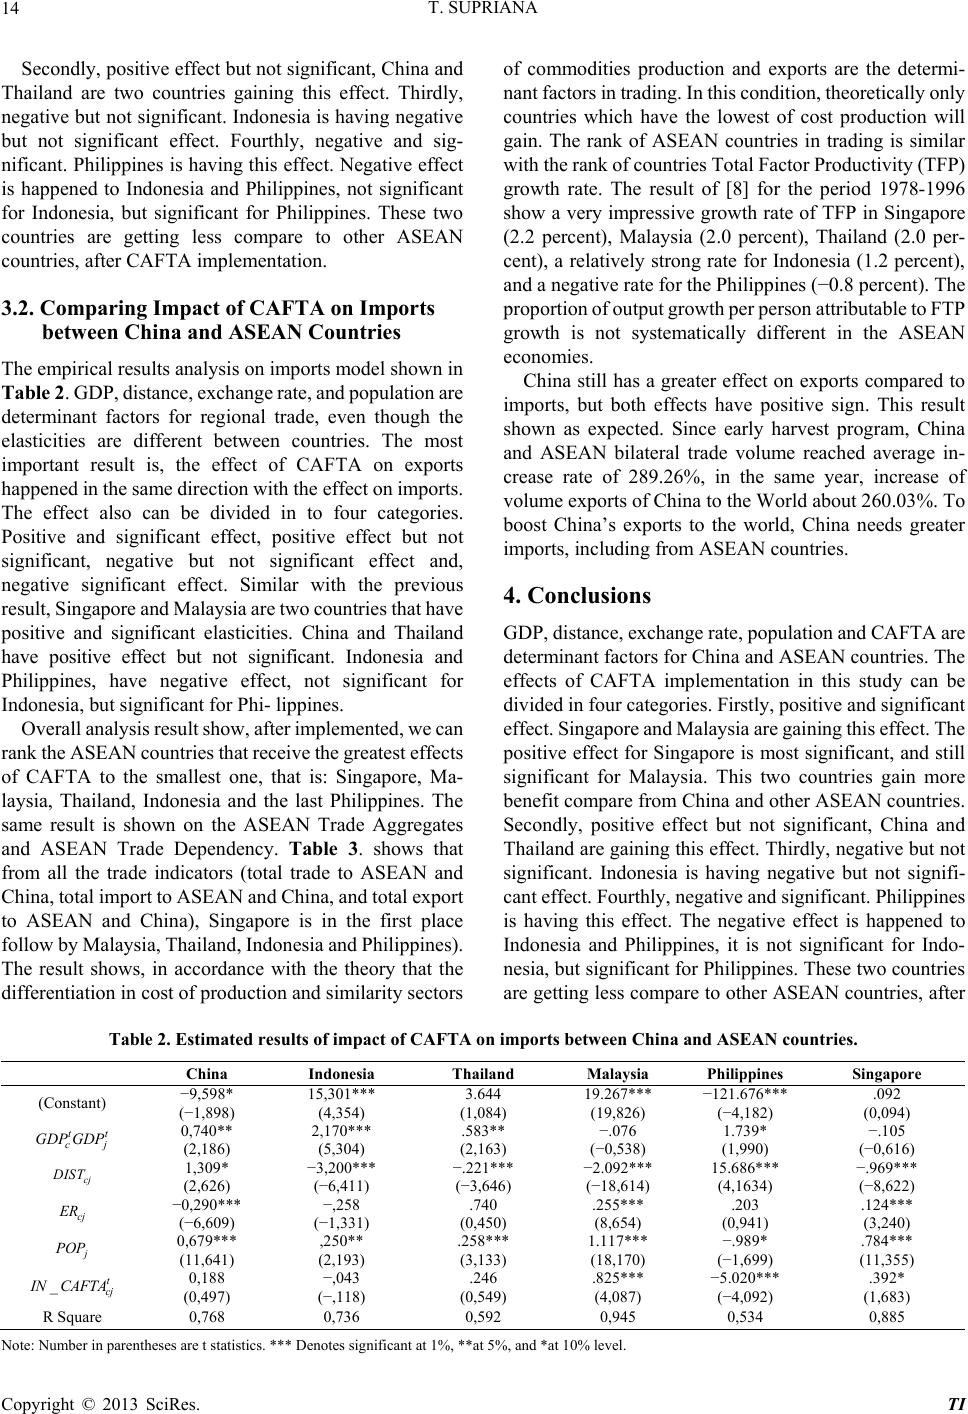 T. SUPRIANA 14 Secondly, positive effect but not significant, China and Thailand are two countries gaining this effect. Thirdly, negative but not significant. Indonesia is having negative but not significant effect. Fourthly, negative and sig- nificant. Philippines is having this effect. Negative effect is happened to Indonesia and Philippines, not significant for Indonesia, but significant for Philippines. These two countries are getting less compare to other ASEAN countries, after CAFTA implementation. 3.2. Comparing Impact of CAFTA on Imports between China and ASEAN Countries The empirical results analysis on imports model shown in Table 2. GDP, distance, exchange rate, and population are determinant factors for regional trade, even though the elasticities are different between countries. The most important result is, the effect of CAFTA on exports happened in the same direction with the effect on imports. The effect also can be divided in to four categories. Positive and significant effect, positive effect but not significant, negative but not significant effect and, negative significant effect. Similar with the previous result, Singapore and Malaysia are two countries that have positive and significant elasticities. China and Thailand have positive effect but not significant. Indonesia and Philippines, have negative effect, not significant for Indonesia, but significant for Phi- lippines. Overall analysis result show, after implemented, we can rank the ASEAN countries that receive the greatest effects of CAFTA to the smallest one, that is: Singapore, Ma- laysia, Thailand, Indonesia and the last Philippines. The same result is shown on the ASEAN Trade Aggregates and ASEAN Trade Dependency. Table 3. shows that from all the trade indicators (total trade to ASEAN and China, total import to ASEAN and China, and total export to ASEAN and China), Singapore is in the first place follow by Malaysia, Thailand, Indonesia and Philippines). The result shows, in accordance with the theory that the differentiation in cost of production and similarity sectors of commodities production and exports are the determi- nant factors in trading. In this condition, theoretically only countries which have the lowest of cost production will gain. The rank of ASEAN countries in trading is similar with the rank of countries Total Factor Productivity (TFP) growth rate. The result of [8] for the period 1978-1996 show a very impressive growth rate of TFP in Singapore (2.2 percent), Malaysia (2.0 percent), Thailand (2.0 per- cent), a relatively strong rate for Indonesia (1.2 percent), and a negative rate for the Philippines (−0.8 percent). The proportion of output growth per person attributable to FTP growth is not systematically different in the ASEAN economies. China still has a greater effect on exports compared to imports, but both effects have positive sign. This result shown as expected. Since early harvest program, China and ASEAN bilateral trade volume reached average in- crease rate of 289.26%, in the same year, increase of volume exports of China to the World about 260.03%. To boost China’s exports to the world, China needs greater imports, including from ASEAN countries. 4. Conclusions GDP, distance, exchange rate, population and CAFTA are determinant factors for China and ASEAN countries. The effects of CAFTA implementation in this study can be divided in four categories. Firstly, positive and significant effect. Singapore and Malaysia are gaining this effect. The positive effect for Singapore is most significant, and still significant for Malaysia. This two countries gain more benefit compare from China and other ASEAN countries. Secondly, positive effect but not significant, China and Thailand are gaining this effect. Thirdly, negative but not significant. Indonesia is having negative but not signifi- cant effect. Fourthly, negative and significant. Philippines is having this effect. The negative effect is happened to Indonesia and Philippines, it is not significant for Indo- nesia, but significant for Philippines. These two countries are getting less compare to other ASEAN countries, after Table 2. Estimated results of impact of CAFTA on imports between China and ASEAN countries. China Indonesia Thailand Malaysia Philippines Singapore (Constant) −9,598* (−1,898) 15,301*** (4,354) 3.644 (1,084) 19.267*** (19,826) −121.676*** (−4,182) .092 (0,094) tt cj GDP GDP 0,740** (2,186) 2,170*** (5,304) .583** (2,163) −.076 (−0,538) 1.739* (1,990) −.105 (−0,616) cj IST 1,309* (2,626) −3,200*** (−6,411) −.221*** (−3,646) −2.092*** (−18,614) 15.686*** (4,1634) −.969*** (−8,622) cj ER −0,290*** (−6,609) −,258 (−1,331) .740 (0,450) .255*** (8,654) .203 (0,941) .124*** (3,240) OP 0,679*** (11,641) ,250** (2,193) .258*** (3,133) 1.117*** (18,170) −.989* (−1,699) .784*** (11,355) _t cj NCAFTA 0,188 (0,497) −,043 (−,118) .246 (0,549) .825*** (4,087) −5.020*** (−4,092) .392* (1,683) R Square 0,768 0,736 0,592 0,945 0,534 0,885 Note: Number in parentheses are t statistics. *** Denotes significant at 1%, **at 5%, and *at 10% level. Copyright © 2013 SciRes. TI 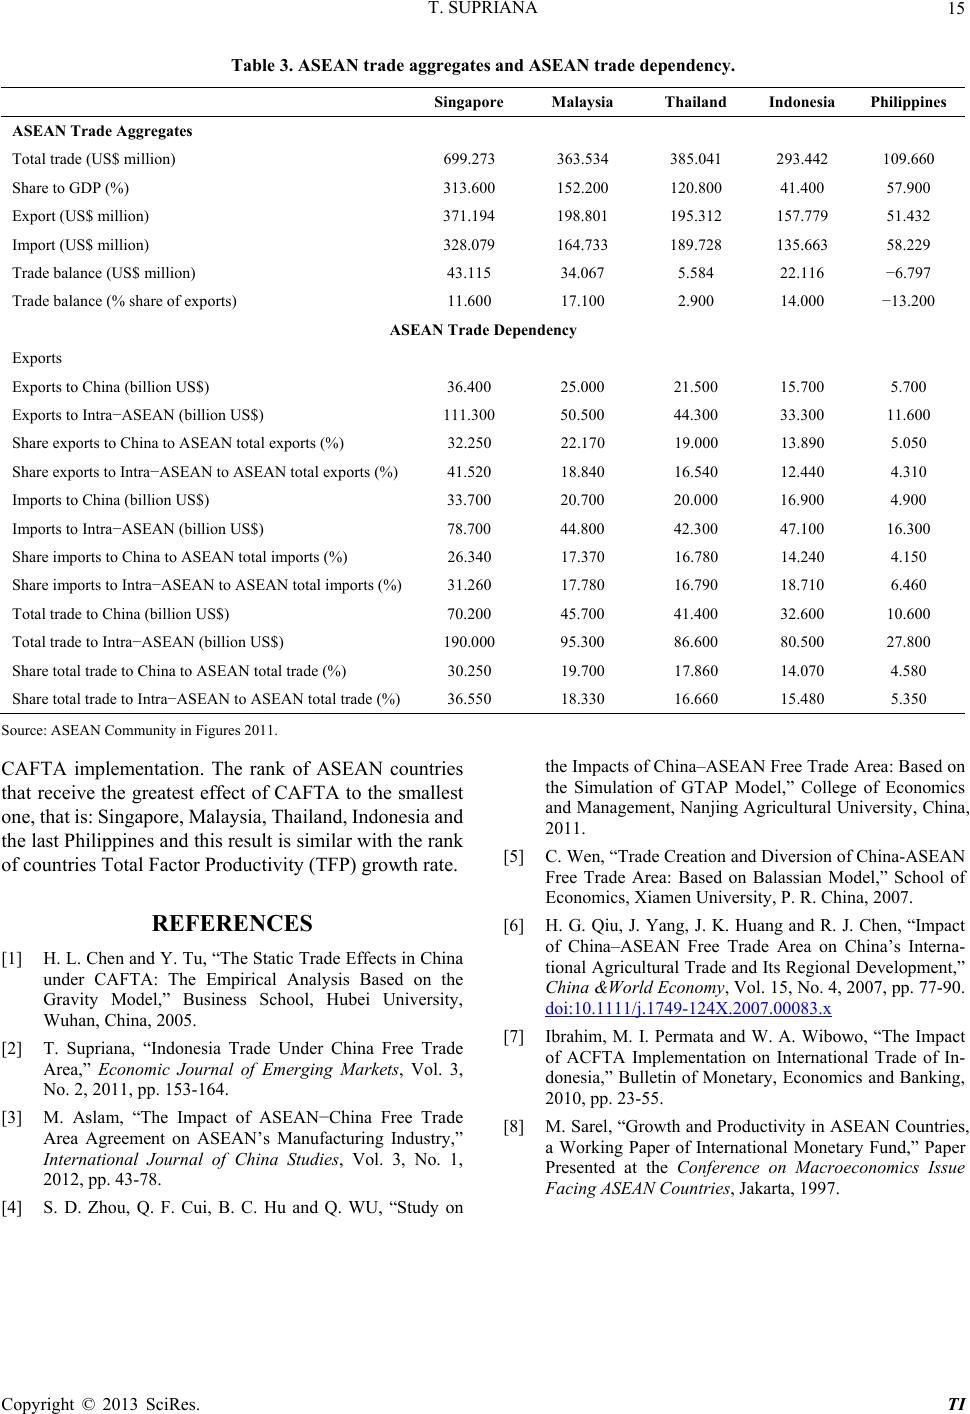 T. SUPRIANA 15 Table 3. ASEAN trade aggregates and ASEAN trade dependency. Singapore Malaysia Thailand Indonesia Philippines ASEAN Trade Aggregates Total trade (US$ million) 699.273 363.534 385.041 293.442 109.660 Share to GDP (%) 313.600 152.200 120.800 41.400 57.900 Export (US$ million) 371.194 198.801 195.312 157.779 51.432 Import (US$ million) 328.079 164.733 189.728 135.663 58.229 Trade balance (US$ million) 43.115 34.067 5.584 22.116 −6.797 Trade balance (% share of exports) 11.600 17.100 2.900 14.000 −13.200 ASEAN Trade Dependency Exports Exports to China (billion US$) 36.400 25.000 21.500 15.700 5.700 Exports to Intra−ASEAN (billion US$) 111.300 50.500 44.300 33.300 11.600 Share exports to China to ASEAN total exports (%) 32.250 22.170 19.000 13.890 5.050 Share exports to Intra−ASEAN to ASEAN total exports (%)41.520 18.840 16.540 12.440 4.310 Imports to China (billion US$) 33.700 20.700 20.000 16.900 4.900 Imports to Intra−ASEAN (billion US$) 78.700 44.800 42.300 47.100 16.300 Share imports to China to ASEAN total imports (%) 26.340 17.370 16.780 14.240 4.150 Share imports to Intra−ASEAN to ASEAN total imports (%)31.260 17.780 16.790 18.710 6.460 Total trade to China (billion US$) 70.200 45.700 41.400 32.600 10.600 Total trade to Intra−ASEAN (billion US$) 190.000 95.300 86.600 80.500 27.800 Share total trade to China to ASEAN total trade (%) 30.250 19.700 17.860 14.070 4.580 Share total trade to Intra−ASEAN to ASEAN total trade (%)36.550 18.330 16.660 15.480 5.350 Source: ASEAN Community in Figures 2011. CAFTA implementation. The rank of ASEAN countries that receive the greatest effect of CAFTA to the smallest one, that is: Singapore, Malaysia, Thailand, Indonesia and the last Philippines and this result is similar with the rank of countries Total Factor Productivity (TFP) growth rate. REFERENCES [1] H. L. Chen and Y. Tu, “The Static Trade Effects in China under CAFTA: The Empirical Analysis Based on the Gravity Model,” Business School, Hubei University, Wuhan, China, 2005. [2] T. Supriana, “Indonesia Trade Under China Free Trade Area,” Economic Journal of Emerging Markets, Vol. 3, No. 2, 2011, pp. 153-164. [3] M. Aslam, “The Impact of ASEAN−China Free Trade Area Agreement on ASEAN’s Manufacturing Industry,” International Journal of China Studies, Vol. 3, No. 1, 2012, pp. 43-78. [4] S. D. Zhou, Q. F. Cui, B. C. Hu and Q. WU, “Study on the Impacts of China–ASEAN Free Trade Area: Based on the Simulation of GTAP Model,” College of Economics and Management, Nanjing Agricultural University, China, 2011. [5] C. Wen, “Trade Creation and Diversion of China-ASEAN Free Trade Area: Based on Balassian Model,” School of Economics, Xiamen University, P. R. China, 2007. [6] H. G. Qiu, J. Yang, J. K. Huang and R. J. Chen, “Impact of China–ASEAN Free Trade Area on China’s Interna- tional Agricultural Trade and Its Regional Development,” China &World Economy, Vol. 15, No. 4, 2007, pp. 77-90. doi:10.1111/j.1749-124X.2007.00083.x [7] Ibrahim, M. I. Permata and W. A. Wibowo, “The Impact of ACFTA Implementation on International Trade of In- donesia,” Bulletin of Monetary, Economics and Banking, 2010, pp. 23-55. [8] M. Sarel, “Growth and Productivity in ASEAN Countries, a Working Paper of International Monetary Fund,” Paper Presented at the Conference on Macroeconomics Issue Facing ASEAN Countries, Jakarta, 1997. Copyright © 2013 SciRes. TI
|