 Open Journal of Nursing, 2013, 3, 445-452 OJN http://dx.doi.org/10.4236/ojn.2013.36060 Published Online October 2013 (http://www.scirp.org/journal/ojn/) Undiagnosed obstructive sleep apnea in hypertensive outpatients in primary care—Associations with sleep complaints, depressive symptoms and global perceived health Anders Broström1,2, Ola Sunnergren3,4, Kristofer Årestedt5,6, Peter Johansson7,8, Per Nilsen9, Bengt Fridlund1, Eva Svanborg1,3 1Department of Nursing Science, School of Health Sciences, Jönköping University, Jönköping, Sweden 2Department of Clinical Neurophysiology, Linköping University Hospital, Linköping, Sweden 3Department of Clinical and Experimental Medicine, Division of Clinical Neurophysiology, Faculty of Health Sciences, Linköping University, Linköping, Sweden 4Department of ENT, Ryhov Hospital, Jönköping, Sweden 5School of Health and Caring Sciences, Faculty of Health, Social Work and Behavioural Sciences, Linnaeus University, Kalmar, Sweden 6Department of Medicine and Health Sciences, Division of Nursing Sciences, Faculty of Health Sciences, Linköping University, Linköping, Sweden 7Department of Cardiology, Linköping University Hospital, Linköping, Sweden. 8Department of Medicine and Health Sciences, Division of Cardiovascular Medicine, Faculty of Health Sciences, Linköping Univer- sity, Linköping, Sweden 9Division of Health Care Analysis, Faculty of Health Sciences, Department of Health and Society, Linköping University, Linköping, Sweden Email: anders.brostrom@hhj.hj.se Received****************2013 Copyright © 2013 Anders Broström et al. This is an open access article distributed under the Creative Commons Attribution License, which permits unrestricted use, distribution, and reproduction in any medium, provided the original work is properly cited. ABSTRACT Objective: 1) To describe the prevalence of undiag- nosed obstructive sleep apnea (OSA) and depressive symptoms in hypertensive men and women below 65 years of age, and 2) to describe the association of OSA to subjective sleep complaints, depressive symptoms and global perceived health. Design: Cross-sectional design focusing on nursing care outcomes of obstruct- tive sleep apnea. Setting: Four primary care health centres in Sweden. PATIENTS: 411 consecutive pa- tients (52% women), mean age 57.9 years (SD 5.9 years), with diagnosed hypertension (BP > 140/90). Main Outcome Measures: Prevalence of OSA and depressive symptoms, and association of OSA to sleep complaints, depressive symptoms and global per- ceived health. RESULTS: Mild, moderate and severe OSA was seen among 29%, 16% and 14% of patients, respectively. Depressive symptoms were seen in 16% of the total group, with a higher prevalence among men, compared to women, 21% vs. 12%. No differ- ences were found regarding blood pressure, estimated sleep need, sleep sufficiency index, insomnia symp- toms, daytime sleepiness or depressive symptoms with respect to different degrees of OSA. Apnea-hypopnea index was significantly associated to perceived health after adjustment for gender and comorbidities, but when depressive symptoms and non-restorative sleep were added to the model, 33% of the variance in glo- bal perceived health was explained. Conclusion: OSA is highly prevalent among patients with hypertension in primary care and does together with sleep com- plaints and depressive symptoms have a negative im- pact on global perceived health. Hypertensive pa- tients without subjective sleep complaints or depres- sive symptoms may still have OSA. Keywords: Depression; Global Perceived Health; Hypertension; Nursing Care; Obstructive Sleep Apnea; Sleep Disordered Breathing; Sleep 1. INTRODUCTION The worldwide prevalence of hypertension (HT) has been estimated to be as high as 1 billion individuals. Es- timates suggest that HT is responsible for 62 percent of OPEN ACCESS  A. Broström et al. / Open Journal of Nursing 3 (2013) 445-452 446 cerebrovascular disease, 49 percent of ischemic heart disease (IHD), and 7.1 million deaths each year [1]. Ob- structive sleep apnea (OSA) occurs in 24% of men and 9% of women when defined as at least five respiratory pauses per hour of sleep [2]. OSA is associated to various types of cardiovascular disease (e.g., stroke, IHD, heart failure, arrhythmias) and can cause an increased mortal- ity [3]. A suggested mechanism is the increased cardio- vascular stress (i.e., sympathetic activation) caused by the breathing related events (i.e., the apneas/hypopneas that causes hypoxia) [3]. Another suggested cause is the high and increasing prevalence of obesity [4]. Swedish data indicate an increasing obesity problem among HT patients, and, as a consequence, an increasing occurrence of OSA [5]. Global perceived health (GPH) is an important out- come in nursing care, incorporating depression, insomnia and daytime sleepiness as crucial components [6], of which all are associated with OSA in patients referred to sleep clinics, but also with poor health perceptions in the general population [7]. Simultaneous use of antidepres- sant and antihypertensive medications may increase the likelihood of OSA syndrome (OSAS) diagnosis [8]. Im- proved knowledge about the links between OSA, subjec- tive sleep complaints, depression and GPH in hyperten- sive outpatients may help nurses to identify patients, as well as targets for nursing interventions. The purpose of this study was 1) to describe the prevalence of different severity levels of OSA in adults with HT in primary care, and 2) to explore the contributions of OSA to subjective insomnia and daytime sleepiness, depressive symptoms and GPH in patients with undiagnosed OSA. 2. MATERIALS AND METHODS 2.1. Design and Selection Criteria A cross-sectional design focusing on nursing care out- comes of OSA breathing was used. After ethical approval (Dnr M29-07), all 918 eligible patients 18 - 65 years of age with diagnosed hypertension (140/90) at four pri- mary care centres in Sweden were screened. Exclusion criteria were terminal disease, ongoing treatment for OSAS, severe psychiatric disease, dementia, alcohol/drug abuse, or difficulties reading and understanding the Swe- dish language. 2.2. Clinical Variables A nurse (i.e., specialized on pulmonary medicine) and a physician (i.e., specialized in ear nose and throat diseases) collected all data at the hospital. The data comprised weight, height, blood pressure, subjective sleep (i.e., sleep duration, estimated sleep need), medication and co-morbidities. Diagnosis of diabetes mellitus was based on a history, current treatment (oral therapy or insulin) or a fasting blood glucose value ≥7 mmol/l. IHD was de- fined on the basis of a history of angina pectoris and/or myocardial infarction and/or coronary angioplasty and/or coronary bypass surgery. Respiratory disease was prem- ised on a history of asthma or chronic obstructive pul- monary disease, or on current treatment (β2 agonists and/ or inhaled corticosteroids). 2.3. Self-Rating Scales The 11 items of the Berlin Sleep Apnea Questionnaire (BSAQ) focusing on occurrence of OSA symptoms/ characteristics (i.e., part 1; snoring, witnessed apneas, part 2; daytime sleepiness, part 3; occurrence of obesity, and HT) was used to measure the risk of having OSA [9]. If two of the three parts are showing an “occurrence” of symptoms/characteristics the patient is supposed to have a high risk of suffering from OSA. The 3 items of the Minimal insomnia symptoms scale (MISS) were used to measure difficulties initiating sleep, difficulties main- taining sleep and difficulties with non-restorative sleep [10]. The patients grade their difficulties on a scale ranging from no problems (0), to very great problems (4). The Epworth sleepiness scale (ESS) was used to measure daytime sleepiness [11]. The eight items (i.e., different daily situations in which the subjects are asked to rate the likeliness of dozing or falling asleep) are rated on a scale of 0 - 3 and are summarised into a score between 0 - 24 points with a cut-off of >10 indicating excessive daytime sleepiness. The 14 items Hospital anxiety and depression scale (HAD) was used to measure depressive symptoms [12]. The scores from the seven depression items ranges from 0 - 21, the higher score the more depressive symp- toms. A cut-off of ≥7 was used to indicate depressive symptoms. The first question concerning current health status from the SF-36, was used to measure GPH [13]. The participants ranked their health as 1) excellent, 2) very good, 3) good, 4) fair or 5) poor. 2.4. Recordings of Sleep Disordered Breathing Full-night respiratory recordings were performed in the patients’ homes, including monitoring of nasal-airflow, pulse oximetry, respiratory movements and body position. Data were recorded with a polygraphic equipment (Em- bletta, Somnologica, ResMed AB, Trollhättan, Sweden) and all recordings were scored according to the 2007 recommendations of the American Academy of Sleep Medicine [14] by the same experienced physician who was blinded to the results of the other data. The total number of apneas and hypopneas was divided by the estimated sleep time, giving the apnea-hypopnea index (AHI). An oxygen-desaturation index (ODI) was calcu- lated in the same manner. Patients were defined as hav- ing mild (i.e., AHI > 5), moderate (i.e., >15) or severe Copyright © 2013 SciRes. OPEN ACCESS  A. Broström et al. / Open Journal of Nursing 3 (2013) 445-452 447 (i.e., >30) OSA. 2.5. Statistical Analysis Normally distributed variables were analysed with t-test, ANOVA or Pearson correlations. Mann-Whitney test, Kruskal-Wallis test, Chi-square test or Spearman rank correlations were used on non-normally distributed or dichotomous variables. To examine if AHI was inde- pendently associated with perceived health, nested linear regression analysis was used. Before entering the regres- sion model, AHI was logarithmic transformed to normal- ity. Adjustments were made for theoretically selected covariates (i.e., gender, diabetes, IHD, respiratory dis- ease, body mass index (BMI) and depressive symptoms) and subjective sleep complaints (i.e. , non-restorative sleep) with the highest correlation to perceived health. The significance level was set to p < 0.05. All statistical analyses were performed with the PASW statistics 18 (IBM Inc., USA). 3. RESULTS 3.1. Study Population Of the 918 patients 12% (50 men and 59 women) were omitted from participation due to exclusion criteria’s and 28% (170 men and 159 women) chose not to participate. Of the 480 patients who participated in the clinical ex- amination 411 accepted respiratory recordings. Seven- teen recordings were lost due to technical problems. Thus, the final study population consisted of 394 patients. Population characteristics, co-morbidities and medica- tions are given in Table 1. 3.2. Prevalence of OSA and Depressive Symptoms Fifty-nine percent of the 394 patients had OSA (AHI ≥ 5). Mild, moderate and severe OSA occurred among 29%, 16% and 14% of the patients, respectively. Average ODI was twice and five times as high in the groups with mo- derate and severe OSA (20.0 and 45.6, respectively) com- pared to those with mild OSA (7.9) (p < 0.001) (Table 1). Neither systolic, diastolic blood pressure nor medication differed between the three groups of patients with OSA, or compared to patients without OSA. BMI was signifi- cantly associated with AHI (p < 0.001). Obesity (BMI ≥ 30) was seen in 30%, 43% and 68% of the patients with mild, moderate and severe OSA, respectively. Diabetes was more prevalent among patients with at least mild OSA (p = 0.04, χ2 3.8). Neither history of IHD nor respiratory disease was associated with severity of OSA. Prevalence of depressive symptoms in relation to severity of OSA is presented in Table 2 . A total of 16% had a HAD score ≥ 7. A larger proportion of men than women had depressive symptoms, 21% vs. 12% (p < 0.01). 3.3. Association of OSA to Sleep Complaints, Depressive Symptoms and GPH Patients with moderate or severe OSA had longer sleep duration compared to those with mild or no OSA (p < 0.01). The total HAD score was not associated with the degree of OSA. Patients without OSA had better GPH compared to individuals with at least mild OSA (p < 0.01). Depressive symptoms, non-restorative sleep, dif- ficulties maintaining sleep, difficulties initiating sleep and BMI were the variables with the strongest correla- tions to perceived health. AHI and ODI were also sig- nificantly related to GPH (Table 3). Table 4 shows that patients with depressive symptoms had more difficulties maintaining sleep (p = 0.004), non- restorative sleep (p = 0.008) and GPH (0.001), but no differences were seen regarding sleep duration, sleep need, difficulties initiating sleep or daytime sleepiness. AHI was significantly associated with GPH after adjust- ment for gender and co-morbidities (block 3, Table 5). After adding BMI to the model in block 4 AHI and dia- betes became non-significant. Depressive symptoms and non-restorative sleep explained almost 22% of the vari- ance in GPH. 4. DISCUSSION An important result of relevance for nursing care was that a large proportion of hypertensive outpatients had objective evidence of OSA, but there was no association to blood pressure. Depressive symptoms were common, but not clearly related to OSA. Gender, respiratory dis- ease, BMI, depressive symptoms and non-restorative sleep explained 33% of the variance in GPH. The preva- lence of OSA in this study (59%) is larger than that found in other large community-based general popula- tion studies, which is somewhat surprising given that the average BMI in this Swedish study was lower than that in previous North American studies. For example, the Sleep Heart Health Study [15] and the Wisconsin Sleep Cohort Study [16] documented OSA prevalence rates between 22% - 46%. We included only patients with HT, which may be an explanation for the difference. Our finding is in line with Worshop et al. [17], which found that 38% of 68 hypertensive patients had OSA, regard- less of hypertensive treatment, compared to 4% among normotensive controls. A previous study [18] of men with therapy-resistant HT found that 56% had OSA, compared with 19% in successfully treated hyperten- sive’s matched for age and gender. Two other previous studies [19,20] observed different rates, but different designs and other scoring criteria’s Copyright © 2013 SciRes. OPEN ACCESS 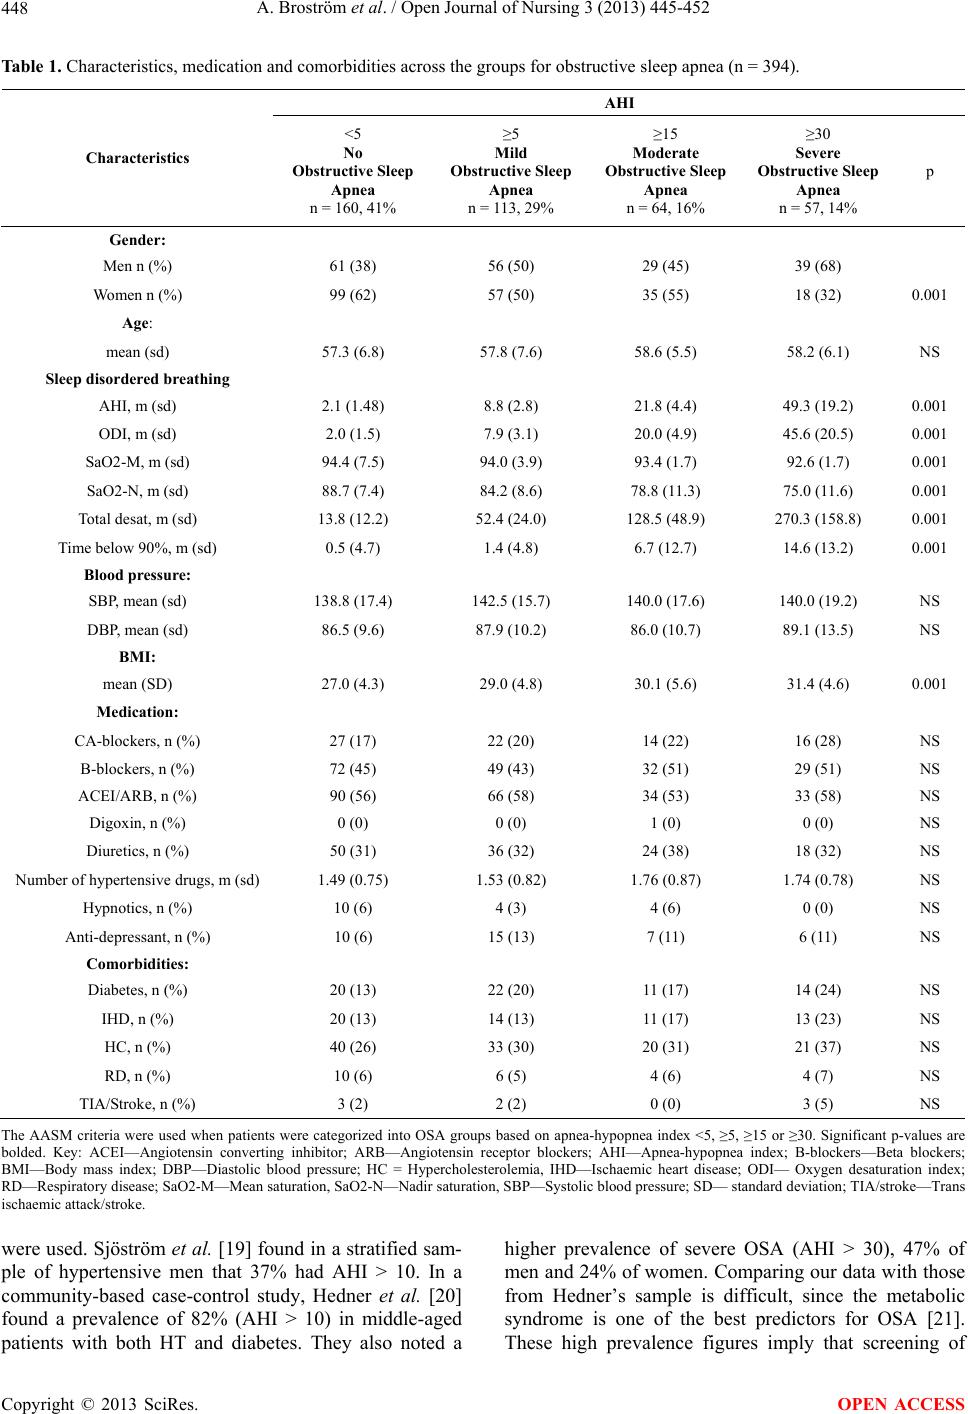 A. Broström et al. / Open Journal of Nursing 3 (2013) 445-452 Copyright © 2013 SciRes. 448 OPEN ACCESS Table 1. Characteristics, medication and comorbidities across the groups for obstructive sleep apnea (n = 394). AHI Characteristics <5 No Obstructive Sleep Apnea n = 160, 41% ≥5 Mild Obstructive Sleep Apnea n = 113, 29% ≥15 Moderate Obstructive Sleep Apnea n = 64, 16% ≥30 Severe Obstructive Sleep Apnea n = 57, 14% p Gender: Men n (%) 61 (38) 56 (50) 29 (45) 39 (68) Women n (%) 99 (62) 57 (50) 35 (55) 18 (32) 0.001 Age: mean (sd) 57.3 (6.8) 57.8 (7.6) 58.6 (5.5) 58.2 (6.1) NS Sleep disordered breathing AHI, m (sd) 2.1 (1.48) 8.8 (2.8) 21.8 (4.4) 49.3 (19.2) 0.001 ODI, m (sd) 2.0 (1.5) 7.9 (3.1) 20.0 (4.9) 45.6 (20.5) 0.001 SaO2-M, m (sd) 94.4 (7.5) 94.0 (3.9) 93.4 (1.7) 92.6 (1.7) 0.001 SaO2-N, m (sd) 88.7 (7.4) 84.2 (8.6) 78.8 (11.3) 75.0 (11.6) 0.001 Total desat, m (sd) 13.8 (12.2) 52.4 (24.0) 128.5 (48.9) 270.3 (158.8) 0.001 Time below 90%, m (sd) 0.5 (4.7) 1.4 (4.8) 6.7 (12.7) 14.6 (13.2) 0.001 Blood pressure: SBP, mean (sd) 138.8 (17.4) 142.5 (15.7) 140.0 (17.6) 140.0 (19.2) NS DBP, mean (sd) 86.5 (9.6) 87.9 (10.2) 86.0 (10.7) 89.1 (13.5) NS BMI: mean (SD) 27.0 (4.3) 29.0 (4.8) 30.1 (5.6) 31.4 (4.6) 0.001 Medication: CA-blockers, n (%) 27 (17) 22 (20) 14 (22) 16 (28) NS B-blockers, n (%) 72 (45) 49 (43) 32 (51) 29 (51) NS ACEI/ARB, n (%) 90 (56) 66 (58) 34 (53) 33 (58) NS Digoxin, n (%) 0 (0) 0 (0) 1 (0) 0 (0) NS Diuretics, n (%) 50 (31) 36 (32) 24 (38) 18 (32) NS Number of hypertensive drugs, m (sd) 1.49 (0.75) 1.53 (0.82) 1.76 (0.87) 1.74 (0.78) NS Hypnotics, n (%) 10 (6) 4 (3) 4 (6) 0 (0) NS Anti-depressant, n (%) 10 (6) 15 (13) 7 (11) 6 (11) NS Comorbidities: Diabetes, n (%) 20 (13) 22 (20) 11 (17) 14 (24) NS IHD, n (%) 20 (13) 14 (13) 11 (17) 13 (23) NS HC, n (%) 40 (26) 33 (30) 20 (31) 21 (37) NS RD, n (%) 10 (6) 6 (5) 4 (6) 4 (7) NS TIA/Stroke, n (%) 3 (2) 2 (2) 0 (0) 3 (5) NS The AASM criteria were used when patients were categorized into OSA groups based on apnea-hypopnea index <5, ≥5, ≥15 or ≥30. Significant p-values are bolded. Key: ACEI—Angiotensin converting inhibitor; ARB—Angiotensin receptor blockers; AHI—Apnea-hypopnea index; B-blockers—Beta blockers; BMI—Body mass index; DBP—Diastolic blood pressure; HC = Hypercholesterolemia, IHD—Ischaemic heart disease; ODI— Oxygen desaturation index; RD—Respiratory disease; SaO2-M—Mean saturation, SaO2-N—Nadir saturation, SBP—Systolic blood pressure; SD— standard deviation; TIA/stroke—Trans ischaemic attack/stroke. were used. Sjöström et al. [19] found in a stratified sam- ple of hypertensive men that 37% had AHI > 10. In a community-based case-control study, Hedner et al. [20] found a prevalence of 82% (AHI > 10) in middle-aged patients with both HT and diabetes. They also noted a higher prevalence of severe OSA (AHI > 30), 47% of men and 24% of women. Comparing our data with those from Hedner’s sample is difficult, since the metabolic syndrome is one of the best predictors for OSA [21]. hese high prevalence figues imply that screening of T r 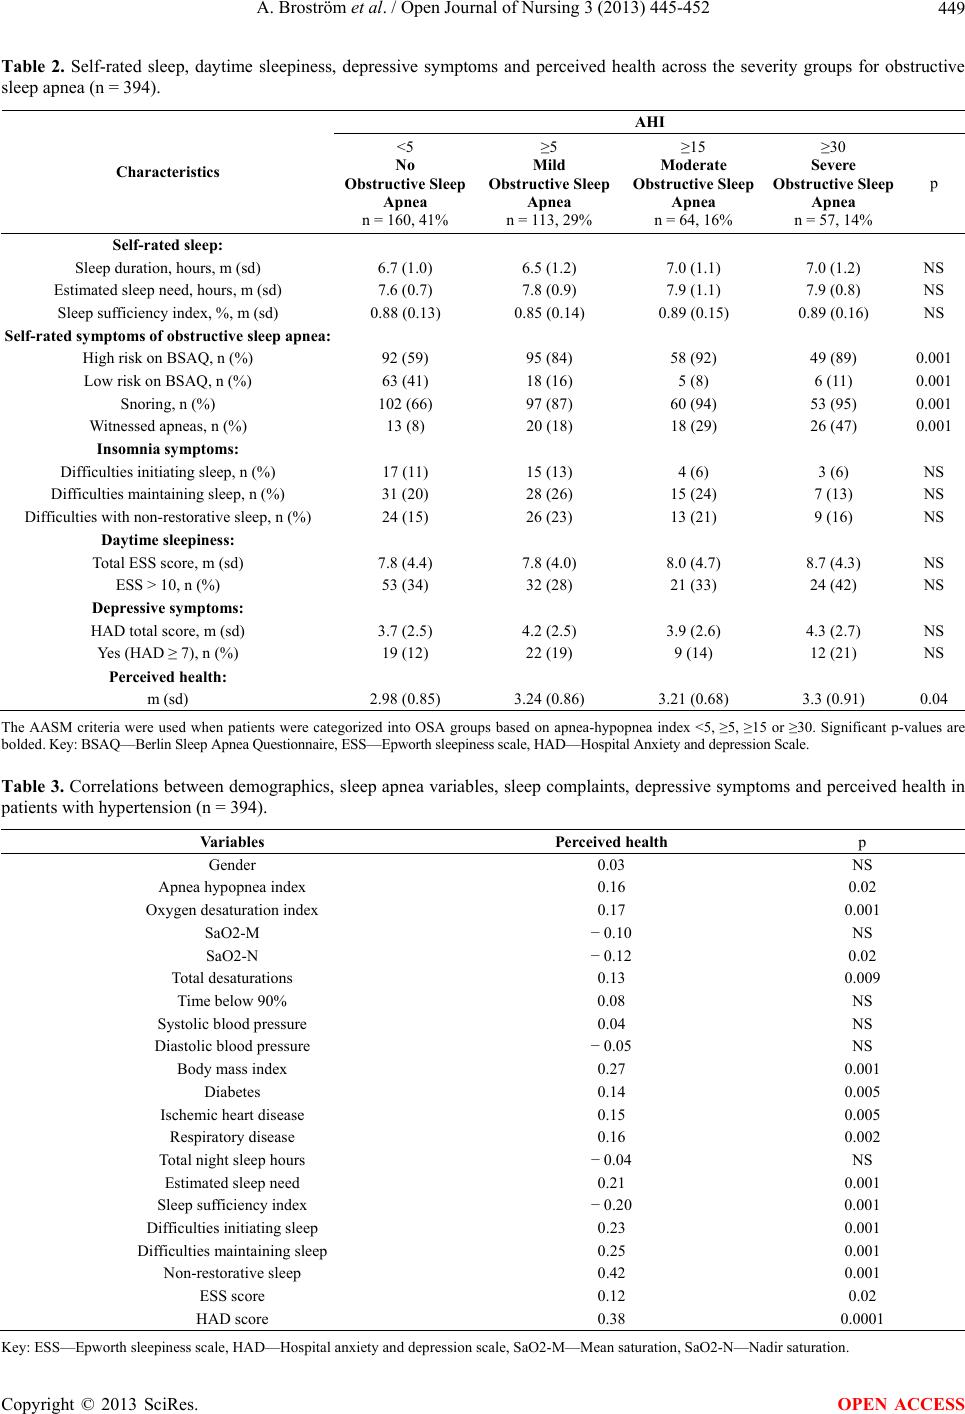 A. Broström et al. / Open Journal of Nursing 3 (2013) 445-452 449 Table 2. Self-rated sleep, daytime sleepiness, depressive symptoms and perceived health across the severity groups for obstructive sleep apnea (n = 394). AHI Characteristics <5 No Obstructive Sleep Apnea n = 160, 41% ≥5 Mild Obstructive Sleep Apnea n = 113, 29% ≥15 Moderate Obstructive Sleep Apnea n = 64, 16% ≥30 Severe Obstructive Sleep Apnea n = 57, 14% p Self-rated sleep: Sleep duration, hours, m (sd) 6.7 (1.0) 6.5 (1.2) 7.0 (1.1) 7.0 (1.2) NS Estimated sleep need, hours, m (sd) 7.6 (0.7) 7.8 (0.9) 7.9 (1.1) 7.9 (0.8) NS Sleep sufficiency index, %, m (sd) 0.88 (0.13) 0.85 (0.14) 0.89 (0.15) 0.89 (0.16) NS Self-rated symptoms of obstructive sleep apnea: High risk on BSAQ, n (%) 92 (59) 95 (84) 58 (92) 49 (89) 0.001 Low risk on BSAQ, n (%) 63 (41) 18 (16) 5 (8) 6 (11) 0.001 Snoring, n (%) 102 (66) 97 (87) 60 (94) 53 (95) 0.001 Witnessed apneas, n (%) 13 (8) 20 (18) 18 (29) 26 (47) 0.001 Insomnia symptoms: Difficulties initiating sleep, n (%) 17 (11) 15 (13) 4 (6) 3 (6) NS Difficulties maintaining sleep, n (%) 31 (20) 28 (26) 15 (24) 7 (13) NS Difficulties with non-restorative sleep, n (%) 24 (15) 26 (23) 13 (21) 9 (16) NS Daytime sleepiness: Total ESS score, m (sd) 7.8 (4.4) 7.8 (4.0) 8.0 (4.7) 8.7 (4.3) NS ESS > 10, n (%) 53 (34) 32 (28) 21 (33) 24 (42) NS Depressive symptoms: HAD total score, m (sd) 3.7 (2.5) 4.2 (2.5) 3.9 (2.6) 4.3 (2.7) NS Yes (HAD ≥ 7), n (%) 19 (12) 22 (19) 9 (14) 12 (21) NS Perceived health: m (sd) 2.98 (0.85) 3.24 (0.86) 3.21 (0.68) 3.3 (0.91) 0.04 The AASM criteria were used when patients were categorized into OSA groups based on apnea-hypopnea index <5, ≥5, ≥15 or ≥30. Significant p-values are bolded. Key: BSAQ—Berlin Sleep Apnea Questionnaire, ESS—Epworth sleepiness scale, HAD—Hospital Anxiety and depression Scale. Table 3. Correlations between demographics, sleep apnea variables, sleep complaints, depressive symptoms and perceived health in patients with hypertension (n = 394). Variables Perceived health p Gender 0.03 NS Apnea hypopnea index 0.16 0.02 Oxygen desaturation index 0.17 0.001 SaO2-M − 0.10 NS SaO2-N − 0.12 0.02 Total desaturations 0.13 0.009 Time below 90% 0.08 NS Systolic blood pressure 0.04 NS Diastolic blood pressure − 0.05 NS Body mass index 0.27 0.001 Diabetes 0.14 0.005 Ischemic heart disease 0.15 0.005 Respiratory disease 0.16 0.002 Total night sleep hours − 0.04 NS Estimated sleep need 0.21 0.001 Sleep sufficiency index − 0.20 0.001 Difficulties initiating sleep 0.23 0.001 Difficulties maintaining sleep 0.25 0.001 Non-restorative sleep 0.42 0.001 ESS score 0.12 0.02 HAD score 0.38 0.0001 Key: ESS—Epworth sleepiness scale, HAD—Hospital anxiety and depression scale, SaO2-M—Mean saturation, SaO2-N—Nadir saturation. Copyright © 2013 SciRes. OPEN ACCESS 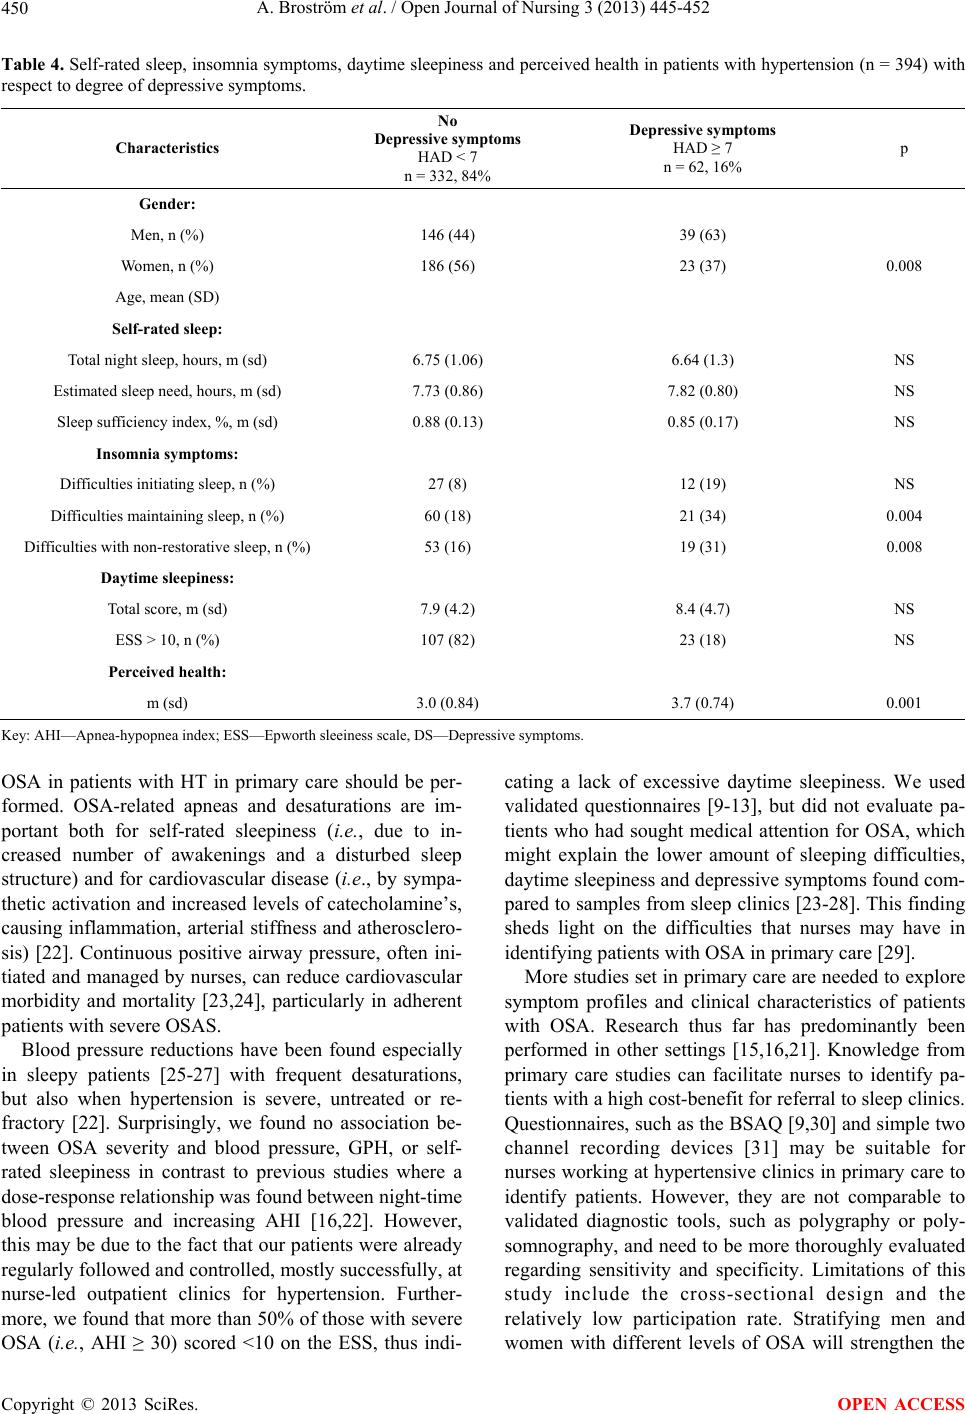 A. Broström et al. / Open Journal of Nursing 3 (2013) 445-452 450 Table 4. Self-rated sleep, insomnia symptoms, daytime sleepiness and perceived health in patients with hypertension (n = 394) with respect to degree of depressive symptoms. Characteristics No Depressive symptoms HAD < 7 n = 332, 84% Depressive symptoms HAD ≥ 7 n = 62, 16% p Gender: Men, n (%) 146 (44) 39 (63) Women, n (%) 186 (56) 23 (37) 0.008 Age, mean (SD) Self-rated sleep: Total night sleep, hours, m (sd) 6.75 (1.06) 6.64 (1.3) NS Estimated sleep need, hours, m (sd) 7.73 (0.86) 7.82 (0.80) NS Sleep sufficiency index, %, m (sd) 0.88 (0.13) 0.85 (0.17) NS Insomnia symptoms: Difficulties initiating sleep, n (%) 27 (8) 12 (19) NS Difficulties maintaining sleep, n (%) 60 (18) 21 (34) 0.004 Difficulties with non-restorative sleep, n (%) 53 (16) 19 (31) 0.008 Daytime sleepiness: Total score, m (sd) 7.9 (4.2) 8.4 (4.7) NS ESS > 10, n (%) 107 (82) 23 (18) NS Perceived health: m (sd) 3.0 (0.84) 3.7 (0.74) 0.001 Key: AHI—Apnea-hypopnea index; ESS—Epworth sleeiness scale, DS—Depressive symptoms. OSA in patients with HT in primary care should be per- formed. OSA-related apneas and desaturations are im- portant both for self-rated sleepiness (i.e., due to in- creased number of awakenings and a disturbed sleep structure) and for cardiovascular disease (i.e., by sympa- thetic activation and increased levels of catecholamine’s, causing inflammation, arterial stiffness and atherosclero- sis) [22]. Continuous positive airway pressure, often ini- tiated and managed by nurses, can reduce cardiovascular morbidity and mortality [23,24], particularly in adherent patients with severe OSAS. Blood pressure reductions have been found especially in sleepy patients [25-27] with frequent desaturations, but also when hypertension is severe, untreated or re- fractory [22]. Surprisingly, we found no association be- tween OSA severity and blood pressure, GPH, or self- rated sleepiness in contrast to previous studies where a dose-response relationship was found between night-time blood pressure and increasing AHI [16,22]. However, this may be due to the fact that our patients were already regularly followed and controlled, mostly successfully, at nurse-led outpatient clinics for hypertension. Further- more, we found that more than 50% of those with severe OSA (i.e., AHI ≥ 30) scored <10 on the ESS, thus indi- cating a lack of excessive daytime sleepiness. We used validated questionnaires [9-13], but did not evaluate pa- tients who had sought medical attention for OSA, which might explain the lower amount of sleeping difficulties, daytime sleepiness and depressive symptoms found com- pared to samples from sleep clinics [23-28]. This finding sheds light on the difficulties that nurses may have in identifying patients with OSA in primary care [29]. More studies set in primary care are needed to explore symptom profiles and clinical characteristics of patients with OSA. Research thus far has predominantly been performed in other settings [15,16,21]. Knowledge from primary care studies can facilitate nurses to identify pa- tients with a high cost-benefit for referral to sleep clinics. Questionnaires, such as the BSAQ [9,30] and simple two channel recording devices [31] may be suitable for nurses working at hypertensive clinics in primary care to identify patients. However, they are not comparable to validated diagnostic tools, such as polygraphy or poly- somnography, and need to be more thoroughly evaluated regarding sensitivity and specificity. Limitations of this study include the cross-sectional design and the relatively low participation rate. Stratifying men and women with different levels of OSA will strengthen the Copyright © 2013 SciRes. OPEN ACCESS 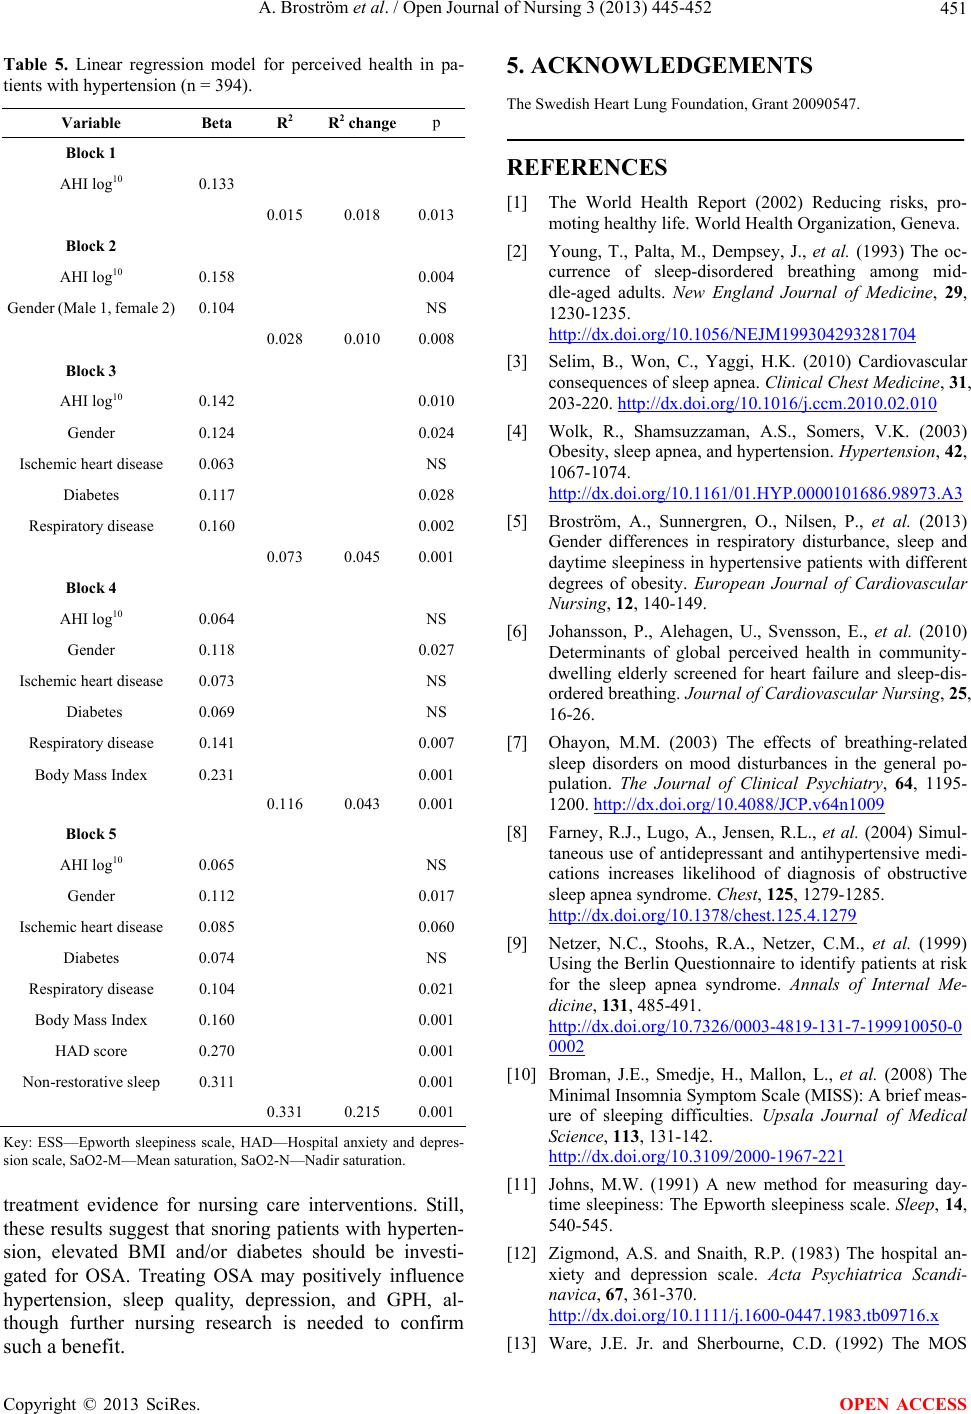 A. Broström et al. / Open Journal of Nursing 3 (2013) 445-452 451 Table 5. Linear regression model for perceived health in pa- tients with hypertension (n = 394). Variable Beta R2 R 2 changep Block 1 AHI log10 0.133 0.015 0.018 0.013 Block 2 AHI log10 0.158 0.004 Gender (Male 1, female 2) 0.104 NS 0.028 0.010 0.008 Block 3 AHI log10 0.142 0.010 Gender 0.124 0.024 Ischemic heart disease 0.063 NS Diabetes 0.117 0.028 Respiratory disease 0.160 0.002 0.073 0.045 0.001 Block 4 AHI log10 0.064 NS Gender 0.118 0.027 Ischemic heart disease 0.073 NS Diabetes 0.069 NS Respiratory disease 0.141 0.007 Body Mass Index 0.231 0.001 0.116 0.043 0.001 Block 5 AHI log10 0.065 NS Gender 0.112 0.017 Ischemic heart disease 0.085 0.060 Diabetes 0.074 NS Respiratory disease 0.104 0.021 Body Mass Index 0.160 0.001 HAD score 0.270 0.001 Non-restorative sleep 0.311 0.001 0.331 0.215 0.001 Key: ESS—Epworth sleepiness scale, HAD—Hospital anxiety and depres- sion scale, SaO2-M—Mean saturation, SaO2-N—Nadir saturation. treatment evidence for nursing care interventions. Still, these results suggest that snoring patients with hyperten- sion, elevated BMI and/or diabetes should be investi- gated for OSA. Treating OSA may positively influence hypertension, sleep quality, depression, and GPH, al- though further nursing research is needed to confirm such a benefit. 5. ACKNOWLEDGEMENTS The Swedish Heart Lung Foundation, Grant 20090547. REFERENCES [1] The World Health Report (2002) Reducing risks, pro- moting healthy life. World Health Organization, Geneva. [2] Young, T., Palta, M., Dempsey, J., et al. (1993) The oc- currence of sleep-disordered breathing among mid- dle-aged adults. New England Journal of Medicine, 29, 1230-1235. http://dx.doi.org/10.1056/NEJM199304293281704 [3] Selim, B., Won, C., Yaggi, H.K. (2010) Cardiovascular consequences of sleep apnea. Clinical Chest Medicine, 31, 203-220. http://dx.doi.org/10.1016/j.ccm.2010.02.010 [4] Wolk, R., Shamsuzzaman, A.S., Somers, V.K. (2003) Obesity, sleep apnea, and hypertension. Hypertension, 42, 1067-1074. http://dx.doi.org/10.1161/01.HYP.0000101686.98973.A3 [5] Broström, A., Sunnergren, O., Nilsen, P., et al. (2013) Gender differences in respiratory disturbance, sleep and daytime sleepiness in hypertensive patients with different degrees of obesity. European Journal of Cardiovascular Nursing, 12, 140-149. [6] Johansson, P., Alehagen, U., Svensson, E., et al. (2010) Determinants of global perceived health in community- dwelling elderly screened for heart failure and sleep-dis- ordered breathing. Journal of Cardiovascular Nursing, 25, 16-26. [7] Ohayon, M.M. (2003) The effects of breathing-related sleep disorders on mood disturbances in the general po- pulation. The Journal of Clinical Psychiatry, 64, 1195- 1200. http://dx.doi.org/10.4088/JCP.v64n1009 [8] Farney, R.J., Lugo, A., Jensen, R.L., et al. (2004) Simul- taneous use of antidepressant and antihypertensive medi- cations increases likelihood of diagnosis of obstructive sleep apnea syndrome. Chest, 125, 1279-1285. http://dx.doi.org/10.1378/chest.125.4.1279 [9] Netzer, N.C., Stoohs, R.A., Netzer, C.M., et al. (1999) Using the Berlin Questionnaire to identify patients at risk for the sleep apnea syndrome. Annals of Internal Me- dicine, 131, 485-491. http://dx.doi.org/10.7326/0003-4819-131-7-199910050-0 0002 [10] Broman, J.E., Smedje, H., Mallon, L., et al. (2008) The Minimal Insomnia Symptom Scale (MISS): A brief meas- ure of sleeping difficulties. Upsala Journal of Medical Science, 113, 131-142. http://dx.doi.org/10.3109/2000-1967-221 [11] Johns, M.W. (1991) A new method for measuring day- time sleepiness: The Epworth sleepiness scale. Sleep, 14, 540-545. [12] Zigmond, A.S. and Snaith, R.P. (1983) The hospital an- xiety and depression scale. Acta Psychiatrica Scandi- navica, 67, 361-370. http://dx.doi.org/10.1111/j.1600-0447.1983.tb09716.x [13] Ware, J.E. Jr. and Sherbourne, C.D. (1992) The MOS Copyright © 2013 SciRes. OPEN ACCESS  A. Broström et al. / Open Journal of Nursing 3 (2013) 445-452 Copyright © 2013 SciRes. 452 OPEN ACCESS 36-item short-form health survey (SF-36). I. Conceptual framework and item selection. Medical Care, 30, 473- 483. http://dx.doi.org/10.1097/00005650-199206000-00002 [14] Iber, C., Ancoli-Israel, S., Chesson, A., et al. (2007) The AASM manual for the scoring of sleep and associated events: Rules, terminology and technical specifications. 1st Edition, American Academy of Sleep medicine. Westchester. [15] Peppard, P.E., Young, T., Palta, M., et al. (2000) Pro- spective study of the association between sleep-disor- dered breathing and hypertension. New England Journal of Medicine, 342, 1378-1384. http://dx.doi.org/10.1056/NEJM200005113421901 [16] Nieto, F.J., Young, T.B., Lind, B.K., et al. (2000) Asso- ciation of sleep-disordered breathing, sleep apnea, and hypertension in a large community-based study. JAMA, 288, 1829-1836. http://dx.doi.org/10.1001/jama.283.14.1829 [17] Worsnop, C.J., Naughton, M.T., Barter, C.E., et al. (1998) The prevalence of obstructive sleep apnea in hyperten- sives. American Journal of Respiratory and Crititical Care Medicine, 157, 111-115. http://dx.doi.org/10.1164/ajrccm.157.1.9609063 [18] Isaksson, H. and Svanborg, E. (1991) Obstructive sleep apnea syndrome in male hypertensives, refractory to drug therapy. Nocturnal automatic blood pressure measure- ments—An aid to diagnosis? Clinical and Experimental Hypertension, 13, 1195-1212. http://dx.doi.org/10.3109/10641969109042122 [19] Sjöström, C., Lindberg, E., Elmasry, A., et al. (2002) Pre- valence of sleep apnoea and snoring in hypertensive men: A population based study. Thorax, 57, 602-607. http://dx.doi.org/10.1136/thorax.57.7.602 [20] Hedner, J., Bengtsson-Boström, K., Peker, Y., et al. (2006) Hypertension prevalence in obstructive sleep ap- noea and sex: A population-based case-control study. European Respiratory Journal, 27, 564-570. http://dx.doi.org/10.1183/09031936.06.00042105 [21] Drager, L.F., Genta, P.G., Pedrosa, R.P., et al. (2010) Characteristics and predictors of obstructive sleep apnea in patients with systemic hypertension. American Journal of Cardiology, 105, 1135-1139. http://dx.doi.org/10.1016/j.amjcard.2009.12.017 [22] Baguet, J.P., Barone-Rochette, G. and Pépin, J.L. (2009) Hypertension and obstructive sleep apnoea syndrome: current perspectives. Journal of human hypertension, 23, 431-443. http://dx.doi.org/10.1038/jhh.2008.147 [23] Lavie, P. (2007) Mortality in sleep apnoea syndrome: A review of the evidence. European Respiratory Review, 16, 203-210. http://dx.doi.org/10.1183/09059180.00010610 [24] Marin, J.M., Carrizo, S.J., Vicente, E., et al. (2005) Long-term cardiovascular outcomes in men with ob- structive sleep apnoea-hypopnoea with or without treat- ment with continuous positive airway pressure: An obser- vational study. Lancet, 365, 1046-1053. [25] Pepperell, J.C., Ramdassingh-Dow, S., Crosthwaite, N., et al. (2002) Ambulatory blood pressure after therapeutic and subtherapeutic nasal continuous positive airway pres- sure for obstructive sleep apnoea: A randomised parallel trial. Lancet, 359, 204-210. http://dx.doi.org/10.1016/S0140-6736(02)07445-7 [26] Becker, H.F., Jerrentrup, A., Ploch, T., et al. (2003) Ef- fect of nasal continuous positive airway pressure treat- ment on blood pressure in patients with obstructive sleep apnea. Circulation, 107, 68-73. http://dx.doi.org/10.1161/01.CIR.0000042706.47107.7A [27] Barbé, F., Durán-Cantolla, J., Capote, F., et al. (2010) Long-term effect of continuous positive airway pressure in hypertensive patients with sleep apnea. American Journal of Respiratory and Critical Care Medicine, 181, 718-726. http://dx.doi.org/10.1164/rccm.200901-0050OC [28] D´Ambrosio, C., Bowman, T. and Mohsenin, V. (1999) Quality of life in patients with obstructive sleep ap- nea:effect of nasal continuous airway pressure-a prospec- tive study. Chest, 115, 123-129. http://dx.doi.org/10.1378/chest.115.1.123 [29] Kramer, N.R., Cook, T.E., Carlisle, C.C., et al. (1999) The role of the primary care physician in recognizing ob- structive sleep apnea. Archives of Internal Medicine, 159, 965-968. http://dx.doi.org/10.1001/archinte.159.9.965 [30] Netzer, N.C., Hoegel, J.J., Loube, D., et al. (2003) Prevalence of symptoms and risk of sleep apnea in pri- mary care. Chest, 124, 1406-1414. http://dx.doi.org/10.1378/chest.124.4.1406 [31] Collop, N.A., McDowell, A., et al. (2007) Clinical guide- lines for the use of unattended portable monitors in the diagnosis of obstructive sleep apnea in adult patients. Portable monitoring task force of the American Academy of Sleep Medicine. Journal of Clinical Sleep Medicine, 3, 737-737.
|