 Technology and Investment, 2013, 4, 1-9 doi:10.4236/ti.2013. 43B001 Published Online August 2013 (http://www.scirp.org/journal/ti) Assessing Some Determinants of the Regional Patenting: An Essay from the Mexican States Vicente German-Soto1, Luis Gutiérrez Flores2 1Facultad de Economía, Universidad Autónoma de Coahuila, Unidad Camporredondo, Edificio “E”, Planta Baja, C.P. 25280, Saltillo, México 2Centro de Investigaciones Socio-Económicas (CISE), Universidad Autónoma de Coahuila, Unidad Camporredondo, Edificio “S”, Planta Baja C.P. 25280, Saltillo, México Email: vicentegerman@uadec.edu.mx, luis.gutierrez@uadec.edu.mx Received April, 2013 ABSTRACT The aim of this work is to study the environment that affects and influences in the creation of regional patents. With this purpose the patenting process is modeled as dynamic one where, beside other factors, its past values contribute to create synergies to continue patenting in a feedback process. Using a dynamic panel data estimator we find that past patenting level trends to encourage the actual one. Also, a positive and significant effect from education, university expenditure, population density and industrial concentration on patents is reported in the Mexican states set. Conclusions highlight that agglomeration forces are the main factors for patenting, followed by university expenditure and industrial concen- tration. Keywords: Patents; Innovation; Agglomeration; Dynamic Panel Data; Education 1. Introduction Patents itself are expressions of new knowledge and in- novative activities on how to produce and how to in- crease the productivity and despite of the existence of clear disadvantages in its use as an output of the innova- tion activity –about it, see [2,18]– it has widely been ac- cepted everywhere. One explanation could be that the innovation is a wide concept very difficult to measure and one of its preferred measures has been the count of patents. Another explanation is, maybe, that count of patents is a statistical number easy to obtain for a great set of countries and economies. There is an extensive literature considering patents for several purposes, but mainly as measure to analyze the technical change. For example, it has been considered as a catalyst for technical change and the technical change as key element to reach majors levels of economic growth and international trade, primarily from a theo- retical perspective. At this respect, [29] examines a search model of growth in which ideas are productivity levels that are drawn from a distribution. He shows that only way to get exponential growth in such model is if ideas are drawn from a Pareto distribution. [26] maps a production function where the elasticity of substitution depends on the extent to which new techniques that are appropriate at higher capital-labor ratios have seen dis- covered. In his model the global production function is Cobb-Douglas and technical change in the long run is labor-augmenting. Others, such as [10], and Slottje (2007) present a model where patent activity serves as catalyst for technical change and they examine if it has occurred over time. [34] reports a decreasing relationship between how strong the optimal patent protection should be and the ability of the economy to successfully follow risky innovation strategies. This finding suggests that devel- oping economies should adopt a more strict intellectual property policy, compared to the ones followed by more advanced economies. Other studies have used patents statistics to examine different aspects about the realization of technological change. The relationship between patents and Research & Development (R&D) expenditures, patents and knowledge spillovers, patents and inventiveness rate of growth, patents and economic growth, and some others have been examined in some detail in literature –see, for instance, [3,9,23]. There appears to be a consensus that patent statistics reflect somehow the technological state of the art of a country, or its ability to embed technical change into the functioning of the economic system. However, count of patents is a general measurement of the innovation level and its only consideration is not suf- ficient to estimate the true level of innovation of the economies. One patent has the property of being useful Copyright © 2013 SciRes. TI  V. GERMAN-SOTO, L. G. FLORES 2 for many years and so impacting the incomes of its trademark owner a long time. This particularity suggests that other ways must be considered if the purpose is to take into advantage of the number of patents generated in one economy, although there has been little progress on the creation of more robust measurements mainly due to the scarcity of information. In this work, we consider that a most complete measure of the innovation level would be the accumulation of patents. There are at least two empirical reasons to consider the patents accumulation. First, a patent is useful for many years and so it impacts in the economy a long time. Sec- ond, a majority of variables are accumulated amounts that not only represent the performance of that year or time period. As examples we have some indexes of edu- cation such as the average schooling years, the general domestic product of the economy is influenced by the added value created in that year but also by the corre- sponding figures of the past years, agglomeration indexes also constitute aggregations along the time of a set of variables, the employment level, etc. In this way, the only consideration of the number of patents created in a specific year would give an incomplete picture of the relationship among the economic variables and innova- tion. On the other hand, the economic theory predicts a pos- itive effect of knowledge on productivity and innovation on knowledge, but size and importance of factors that promote the patents as via to increase the knowledge and innovation kept yet under research. The purpose of this paper is to explore how patent activity can be determined by some factors arising from the “macro” sphere. We estimate a dynamic panel data (DPD) model to observe the relationship between accumulated patents (as per- centage of population) against some of its primary fac- tors. This technique has the advantage that takes into account the past patenting as other factor that affects and stimulates the actual activity of patenting. As it is known, DPD model presents a difficulty because lagged de- pendent variable included in the right side of the regres- sion equation is correlated with the error term and so it presents problems of endogeneity. Regarding this aspect, we follow the econometric suggestions and a Generalized Method of Moments (GMM), as in [7], is implemented. The contribution of this work is in several directions. First, the implemented model tests if determined primary economic factors are performing as is expected from the theory –magnitude and direction of the effect. Second, at empirical level this essay has not been undergone, while commented papers above are concentrated in theoretical issues on technical change, they not specifically consider how patenting can be stimulated with the end to reach a technical change. Third, the empirical essay allows quan- tifying how economic environment is impacting in the patenting activity. And, finally, DPD and GMM methods are yet a novelty in the patenting theme. The application to the regional Mexican case gives light to understand two phenomena occurring in the last few years. First, rates of economic growth in Mexico are erratic and mainly low –below of 3% in the last ten years– and, second, Mexican regions are increasingly more uneven. Both problems have practical cones- quences in a variety of ways, such as the creation of new employment, reduction of poverty, improving the pro- ductivity, and stabilizing the rate of exchange, among other. Specifically, the exercise allows responding to how much patenting activity is linked to the industrial structure, urbanization degree, education level and re search activities in the Mexican states? Our results suggest that, effectively, agglomeration (population density), education, industrial concentration and government subsidy to public universities have sig- nificant and positive impacts on patenting process of the Mexican states. Agglomeration forces and industrial concentration are identified as the main factors for pat- enting. It means that innovation in Mexico follows a geographical pattern in areas densely settled and techno- logically advanced in line with previous findings by [19]. We hope that these results become helpful to understand the patenting process in Mexico and its relevance to achieve major stadiums of economic development. The layout of this document is as follows. The first section below presents a theoretical point of view re- garding knowledge, innovation and patents and their links with economic growth that can be used to generate specific hypotheses. Then, section 2 presents the econo- metric model, the variables and availability of informa- tion to conduct the empirical essay. The section 3 com- ments the main results and details about direction of the estimates. Finally, section 4 highlights some conclusions reached in this work. 2. Theoretical Standpoint As the economy has evolved over time, the key factor behind growth also has been displaced from labor to knowledge accumulation. Nevertheless, accumulated knowledge finds its raison d’être through innovation. The interaction between knowledge and innovation shapes the necessary strength to allow the economy to remain competitive. The essence of any modern econ- omy relies on its ability to increase the application of knowledge ([17]), which makes us think about innova- tion in terms of knowledge used to create new knowl- edge. In this sense, firms and industries produce technologi- cal knowledge which is internal to its activities, but later might spill over to the rest of the industry or the economy Copyright © 2013 SciRes. TI  V. GERMAN-SOTO, L. G. FLORES 3 when such knowledge gets imitated or copied at a very low cost by other firms ([36]). This spillover effect al- lows for the production function to operate with increas- ing returns, thereby creating a process of sustained eco- nomic growth as long as the economy continues to gen- erate knowledge aiming to innovate. Under this analyti- cal view, the application of new technologies becomes fundamental in achieving the goals of innovation and economic productivity growth. The mechanisms implemented to foster knowledge based innovation can be observed in two levels of analy- sis. In the first one, which can be labeled as the “micro” level, there are the firms. Internally, firms make efforts to enhance their technological capacity aiming to increase productivity that finally traduces in a better market posi- tioning. Since academic researchers began to recognize the importance of knowledge accumulation for develop- ing innovative procedures or in the design of new prod- ucts, there has been increasing interest in inquiring about the determinants that cause firms to enhance their inno- vation performance. The most explicit determinant is the amount of resources devoted by firms to R&D. It is usu- ally thought that R&D helps in accelerating scientific innovations that lead to productive growth of firms, in- dustries and the economy.1 For instance, the works of [2,11,18,24,25,30], develop the analytic perspective of R&D impact on firm innovation performance in several ways. The second level of analysis involves an aggregated perspective. We label this as the “macro” level. In the “macro” level case an important element in the discus- sion of innovation, knowledge accumulation, and growth is added. That element is space. As economic integration has been moving forward across the world, then regions, rather than countries, have been considered as units of analysis ([37]). This of course arises from the fact that regions are more homogeneous and better connected within themselves, and that the flow of information fa- cilitates the exchange of new ideas. In the “macro” level, innovation is the result of the combination of several factors such as education, Indus- trialization degree, concentration and agglomeration forces, which tend to accelerate the economic growth of a country and determine international trade patterns. In this context, the works of [14,28,31,33] relate innovation to the geographical concentration in order to establish production patterns. The “macro” level is precisely the analytical perspective adopted in this work. The aforementioned used ways to characterize the mechanisms implemented to foster knowledge based innovation (micro and macro levels) are not opposed to each other. Instead, they should be regarded as comple- mentary results of the process in which innovation is incorporated into the economic system of production. However, some market economy disadvantages cause public entities, mainly governments and universities, to assume the responsibility in financing innovative active- ties. As a matter of fact, public entities are instrumental in providing resources, incentives and opportunities for the private sector to innovate ([15]). Additionally, in many cases there are policy instruments designed to fos- ter scientific research and higher education implemented by governments as responses to market failures.2 Not only the public sector provides incentives and financial resources, but also protects property rights and helps mitigating risks ([15,16]). Particularly, governments tend to fund basic research, in contrast to private firms which tend to develop market rewarded activities (applied re- search). In turn, universities produce and disseminate knowledge while educating its students becoming in a fundamental source of human capital. Universities also serve as a potential source of technological advances for the industry. In Mexico, some studies have marked the start of a re- search area of interest given the relevance of the tech- nology innovation diffusion on productivity and growth. Particularly, the works of [1,13,19-21,35] have all at- tempted to characterize the recent phases of the devel- opment and growth process in Mexico through the use of patents. The theoretical path that we follow is summarized in Figure 1. In there, is showed that technical change is driven by knowledge and innovation, while technical change is a determinant factor to push economic growth and international trade. Also it is assumed that knowl- edge and innovation have some characteristics (previ- ously commented) that make necessary the design of government policies favoring the technical change. Figure 1 also shows that accumulation of knowledge begins the mechanism that results in innovation, but in- novation itself reinforce the knowledge generating more knowledge and it in turn reinforces the innovative activity, and so on. However, knowledge–and innovation– is con- sidered to have the characteristics of a public good, which can then cause the market to fail in assigning the right amount of knowledge required to innovate. The government appears in the scene to facilitate the flow from knowledge and innovation towards technical change through implementing policies related to science and technology, industrial policies, higher education and very importantly, property rights protection via the patent sytem. In the final stage of the process, innovation and s 2Two examples of this type of policies are the direct financing of basic research and the enhancement of the intellectual property protection mechanism available in a lot of countries. 1[32] discusses some of the disadvantages in the use of R&D expendi- tures as an indicator of innovation performance. Copyright © 2013 SciRes. TI  V. GERMAN-SOTO, L. G. FLORES Copyright © 2013 SciRes. TI 4 Figure 1. An innovation and technical change scheme from a macro perspective. knowledge foster economic growth and enhances inter- national trade. 3. Data Availability and Econometric Specification 3.1. Description of Variables For the Mexican case, taking advance of the year-to-year patents disposition and for each federal entity we built an inventive coefficient through the accumulated average patents per 100,000 inhabitants (PAT). This way we as- sess how this index is evolving along the period by means of a regression equation. Data on patents and population of states were obtained from IMPI (Mexican Institute of Property Rights) and INEGI (National Insti- tute of Statistics). As explanatory variables we consider the population density (POPDEN) as a proxy of agglom- eration forces, measured through number of persons per square kilometer; also a couple of education variables is considered: the average schooling years (SCHOOL) and the average government subsidies to public universities (GSPU) by student in superior education measured at real prices of 1993; finally, a location quotient of the high-technology industries (LQHTI), as a measure of the industrial concentration, is assessed. This last index was built as the percentage state employment divided by per- centage national employment in high-tech industries. We contemplate patenting process as dynamic in the sense that one patenting occurring in the past years could have positive feedbacks in the future patenting. Also, the ac- cumulation of patents suggests that effects of invents can persist several years and they do not necessarily disap- pear at all. If this is so, then patents accumulation process should be taken into account. As is well known there are much more variables af- fecting the patenting activity, but we have decided to choose this set for at least two reasons. First, they are easily available for all economies, and second, we seek to measure the impact and magnitude of these set of vari- ables because often they are government targets to im- prove the well-being of the population. Sources of data are from official institutes as follows. POPDEN and SCHOOL are figures provided by INEGI, meanwhile GSPU is a factor published on year-to-year basis by ANUIES (council of Mexican public universities); fi- nally, LQHTI is an index of concentration calculated by us with data on employment for high-tech industries of the Mexican states also published by INEGI. 3.2. Econometric Specification The dynamic panel data is a widely used methodology when data are few in terms of time periods and individu- als. Our database includes 13 time series and 31 cross- sections (after excluding Distrito Federal),3 so we have in all 403 pooled observations on patents and their factors. Although estimations based in dynamic panel data method loose two observations because lagged variables, 3Some statistics are not available for Distrito Federal (for instance, the number of scientists is not published). Also, the statistics for this state are quite elevated in comparison to the rest of states, which means that Distrito Federal is a potential outlier biasing our estimations when employing regression equations.  V. GERMAN-SOTO, L. G. FLORES 5 so in this case the database contains a total of 341 obser- vations (31 × 11). The estimations are conducted following three alterna- tive regression equations: pooled regression, panel data with fixed effects and dynamic panel data. In short, the strategy to capture the impacts on patenting is as follows. We start from the general modeling for analyzing pooled regression: it it ' it yαxβ (1) where matrix it contains K regressors, it x is the patents accumulation per each 100,000 inhabitants, β is a vector of coefficients to be estimated and is a random error term. Taking into account the asymmetry and het- erogeneity problems expected from a set of individuals, regressions, obtained from a pooled viewing, can be po- tentially misleading. Therefore, a more realistic structure can be done by panel data modeling: iti it ' it yxβα (2) where i is a set of individual variables which may or not be observed. Existent heterogeneity among cross- sections is captured through this matrix of individual effects. If i may be observed for all cross-sections then it is possible to fit the model by least squares. In not few situations, like actual exercise, this is not the case, because some variables such as ‘ability’ and ‘experience’, among others, will be missing and unobservable vari- ables; also, there are factors and decisions from firms and individuals that are not possible to measure only from observed variables. So, the phenomenon can be best han- dled by panel data than other methods. α α On the other hand if i is reduced to the constant term, then ordinary least squares is enough to obtain con- sistent and efficient estimates of the common and the slope vector β. This case is equivalent to treat the model as pooled regression. However, unobserved variables and heterogeneity among cross-sections are expected from both theory and empirics behavior suggesting that esti- mators from least squares will be biased and inconsistent as a consequence of omitted variable. α To fix this problem panel data literature considers two ways, at least: fixed and random effects. The first one assumes that unobserved variables are correlated with regressors included in the model, meanwhile in the last structure an uncorrelated relationship is assumed. As consequence that patenting decisions –observed and un- observed– are expected to be correlated the fixed effects seems to be more convenient. Fixed effects method as- sumes an estimable conditional mean in the model (2). This formulation implies that differences across indi- viduals can be captured through differences in the con- stant term. The Equation (2) may be estimated to see the rela- tionship between patents accumulation and its factors. However, it does not take into account the potential ef- fects of the past patenting, in such a way that one econ- omy with more patents trends to increase its patent ac- tive- ity. Therefore, patenting would be better symbol- ized as an accumulative process. A dynamic structure of panel data suggests that one way to consider this possi- bility is modifying the equation (2) as follows: ,1iti tit ' it i yxβyα (3) where itt it u together with the assumption |0 it E ' it x. The lagged dependent variable in the right side of the equation converts the panel data struc- ture in dynamic one. A difficulty with equation (3) is the possible correlation of the lagged dependent variable with the error term even in the case it is serially un- correlated ([22] and [8]). It means that estimated coeffi- cients from ordinary least squares (OLS) are inconsistent in small samples. Fixed effects estimator, which is a mean of k estimators, also results unsuitable. Considers as one vector containing the estimated coefficients from equation (3), that is θβ,α. Then, [27] prove that OLS estimator is given as: 1 '' 11 1 '' 11 ˆkk ii ii ii kk ii iii ii xMDx xMDy xMDx xMDxb (4) where MD is the orthogonal projections matrix defined from the dummies variables. Simplifying the equation (4) we have, 1 ˆk ii i wb (5) From this representation it is possible to infer that es- timated coefficients of fixed effects are result of a mean of k estimators. It is equivalent to run a regression by OLS using transformed data, but even so the mean of k estimators is inconsistent. Particularly, when lagged dependent variable is pre- sent in the right side of the equation, fixed effects pro- duces biased estimations and this problem is more ac- centuated in the small T cases. [27] evaluate several techniques created to estimate dynamic models and they find great biases with fixed effects. An alternative to fixed effects is the Generalized Method of Moments (GMM) as [6]. This method re- quires no knowledge concerning the initial conditions or the distributions of the error term. In short, the GMM estimator basically differences the model to eliminate the individual specific effects. This also eliminates any pos- sible endogeneity due to correlation among individual Copyright © 2013 SciRes. TI  V. GERMAN-SOTO, L. G. FLORES 6 effects and the regressors. The moments consist in to use the orthogonally conditions between errors –in differ- ence– and lagged values of the dependent variable. The model assumes that the original disturbances are serially uncorrelated and for this reason it is supported in a set of diagnostics concerning to significance of instruments.4 With the end to obtain efficient estimations through GMM it will be necessary to include a set of instrumental variables and to apply a transformation to remove cross- section fixed effects. [7] suggest applying first differ- ences or orthogonal deviations to the dynamic panel data model. Orthogonal deviations strategy has the property that if the innovations are i.i.d., the transformed innova- tions are also i.i.d. Meanwhile, the set of instruments can be a combination of lags and levels of the dependent and predetermined variables. With those econometric details in mind, and after to give name to variables it and it , the empirical re- search specification is due as follows: y x ,1 2 ,, 34 , ,, ln ln ln ln it it it it it it ATPOPDEN SCHOOL GSPU LQHTI (6) for the case of pooled regression. Due to strong proper- ties of correlation and heterogeneity imposing by this equation in which all individual are taking as equal, a more convenient specification would be given by fixed effects method, ,1 2 ,, 34 , ,, ln ln ln ln it iit it tit it it PATPOPDEN SCHOOL GSPU LQHTI (7) where t denotes the dummies of time periods and ,it is the random error term. If we also are interested in cap- turing the past effects of patenting on the actual one then the lagged dependent variable can be used as regressor in the model. In this case we have a dynamic version of the panel data structure: ,0 ,11, 23 ,, 4, , ,,, , ln ln ln ln 1,,;1,,and it itit it it itit it itit itit PAT PATPOPDEN SCHOOL GSPU LQHTI iNtT 1 2 (8) where . ~... 0,,~... 0,1 iit iidN iidN , Equation (8) can be obtained as an approximation of the theoretical relationship between patenting with ag- glomeration, education, and industrial concentration, in which patenting in period t depends on patents in t-1. The degree of patenting in t is measured by β0, which will be positive if past patents effectively are influencing in pe- riod t –that is, exists feedback. Furthermore, the other βi coefficients should be positive due to convexity of the explicative variables. Equation (8) captures the fact that innovative activities behavior implies that past patenting increase current one, holding the current values for ex- plicative variables fixed. To treat with patents accumulation has the advantage that it is not a poor measure of the innovative activity –such as could be the case if only we consider count of patents–; however it is just to recognize some limitations as for instance we cannot observe the potential effect of other important domestic factors and our model considers that all inventions have the same effect on innovation. Nevertheless, we think that essay could be an acceptable indicator on how patenting activity is evolving and how the main factors are promoting. 4. Discussion of Results 4.1. An Exploratory Analysis The Table 1 exposes the relationship between all vari- ables. The correlations with patenting are all positive and the greater correlation is on average schooling years. This first approaching favors the existence of some rela- tionship between the set of variables. With the end to have a perspective of the variables behavior the Table 2 shows some of the most relevant descriptive statistics of data set. There is an average of 2.72 patents registered by the 31 federal entities along the period 1994-2006; there is a population density of 89.78 inhabitants by square kilometer; the average scholarly is 7.42 years and government subsidy has an average of 12,295 pesos (national money in real terms) by student. Taken together all the states have a mean of location quotient of 0.78 < 1, indicating that the average industrial concentration is minor to the national one. Ac- cumulated patents show maximum and minimum values of 18.78 and 0.055 with a standard deviation of 3.12 along the period. These same statistics for the rest of variables are: 636.39, 4.84 and 114.04 (population den- sity); 9.6, 5.0 and 0.92 (scholarly years); 41.38, 1.76 and 5.82 (government subsidy to public universities); and 2.32, 0.02 and 0.63 (industrial concentration index). 4.2. Results of the Regression Analysis Three methods of regression are estimated: pooled re- gression, data panel with fixed effects and dynamic panel data. For dynamic panel data method we apply orthogo- nal deviations transformation to remove cross-section fixed effects. Dynamic panel data models are estimated by GMM methods. [7] consider two alternatives: GMM 1-step and GMM 2-step. We use the last because we consider that errors have time series correlation structure that varies by cross-section. A number of instruments must be used with the end to obtain efficient GMM estimators. The discussion on GMM estimators can be found in [4,6,12]. In our present case some essays including it as instruments had not efficient estimations. [7] consider that explanatory x 4Formal details on this technique can be consulted in [5,7]. Copyright © 2013 SciRes. TI  V. GERMAN-SOTO, L. G. FLORES Copyright © 2013 SciRes. TI 7 Table 1. Correlation matrix table. Accumulated Patents Population Density Industrial Concentration Average Schooling Years University Expenditure Accumulated Patents 1 Population Density 0.226 1 Industrial Concentration 0.445 0.422 1 Average Schooling Years 0.577 0.128 0.348 1 University Expenditure 0.285 −0.280 −0.284 0.255 1 Source: own estimations with data from INEGI, Conapo, ANUIES and IMPI. Table 2. Global descriptive statistics of the database. mean Maximum value Minimum value Standard deviation Accumulated patents 2.72 18.78 0.05 3.12 Population density 89.78 636.39 4.84 114.04 Scholarly years 7.42 9.60 5.0 0.92 Government subsidy 12.29 41.38 1.76 5.82 Industrial concentration index 0.78 2.32 0.02 0.63 Source: own estimations with data from INEGI, Conapo, ANUIES and IMPI. variables must be strictly exogenous with respect to re- siduals for consistency. They also suggest using or- thogonal deviations to allow suitably lagged endogenous variables as instruments. Therefore, our estimates with dynamic panel data model employs from two to six lags of the dependent variable and it also combines levels of the explanatory variables as instruments. The estimates using cross-sec- tion effects were not sufficiently effi- cient; in contrast dummies of time periods yield the bet- ter results. All explanatory variables were measured in logarithm terms except the average schooling years. This variable yield best results when it was included in the equation as first differences. The Table 3 shows the main results with the three above commented methods. It is clear a miss-specification between patents and its factors in pool regression and fixed effects methods. All variables were statistically significant except average school years (SCHOOL), which also resulted with the inverse sign when the fixed effects method was imple- mented. Although adjustment was estimated in terms quite acceptable –31% and 38%, respectively– the Durbin-Watson index prevent us to take into account these results because quite low values of this measure, indicat- ing that a strong problem of autocorrelation is present in those estimates. Conversely, dynamic panel data seems to give best results according with the theoretical expec- tative. Now, all the explanatory variables are highly and statistically significant, moreover the list of instruments used is valid and the J-Statistic suggests that the null hy- pothesis of over-identifying restrictions is valid (see p-value of 0.9231). This means that GMM method and Table 3. Panel data estimates of the patenting factors (1994-2006). Method Variable Pool Fixed Effects Dynamic Panel Data Constant −5.7112*** −4.8365*** (1.0939)(1.1449 PATi,t-1 0.9491*** (0.0111) ln(POPDEN)i,t 0.5804*** 0.5421*** 3.0766* (0.1474)(0.1438) (1.8204) Δ(CHOOL)i,t 1.0302 −1.8391 0.8145*** (1.6739)(2.1863) (0.2925) ln(GSPU)i,t 2.8605*** 2.6893*** 0.7854** (0.3224)(0.3423) (0.3821) ln(LQHTI)i,t 1.0074*** 0.9936*** 1.0003** (0.1194)(0.1157) (0.4171) R-SQR 0.31 0.38 Durbin-Watson0.04 0.03 J-statistic 12.8749 Instrument rank 31.00 p-value 0.9231 observations 372 372 340 Notes: standard errors in parentheses. Fixed effects method was estimated with time dummy variables. Dynamic Panel Data was estimated by 2-step GMM using orthogonal deviations and dummy variables of period. The instruments are lags 2 at 6 of dependent variable and the levels of the ex- planatory variables. The J-Statistic is simply the Sargan statistic and it tests the null hypothesis that the over-identifying restrictions are valid. Super- scripts***, **, and *, indicate significant at 1%, 5% and 10%, respectively.  V. GERMAN-SOTO, L. G. FLORES 8 the mixture of lags and levels variables provide a best representation of the relationship among patents and do- mestic factors. It is observed from the Table 3 an estimated and highly significant coefficient of 0.9491, indicating that when index of patents increases in one patent per 100,000 inhabitants in the previous year then there is a probability that in the next year almost a new patent can be created. When subsidy of the government increases in 1% per student then the creation of patents arise to 0.78, which implies that three quarters of a patent are being created in average. However, the greatest effect came from population density –agglomeration force. Results highlight that if population density grows 1% then the creation of patents is equal to 3.07 per 100,000 inhabitants. This result is indicative that urbanization and the spillovers arising from positive externalities in the cities are becoming the most important forces to achieve major standards of patenting. A second best place is obtained by industrial concentration measured through the loca- tion quotient. In this case, when the employment in high-tech regional industries increases in 1% relative to the national one, then inventive coefficient is increased in approximately the same proportion. Scholarly also exerts a positive effect in the patenting process. In this case, the model estimates that this factor is highly and statistically significant. The estimated coefficient indicates that ab- solute variations of average scholarly years in the federal entities help to increase the patents. Each average school- arly year signify an increasing of almost four fifth parts of patents. Also we can explain than for each 10 per cent of increasing in the average scholarly years a total of 0.08 patents is being accumulated. The exercise can be useful to know how education, industrial concentration, population density and the ac- cumulation of patents are performing. We think that gen- eration of such estimates may be useful as a guide to im- prove the achievements on economic development, such a way that factors represent a technical change driving appropriately the economic performance of a set of economies. 5. Conclusions Summarizing, this paper relates knowledge to a set of “macro” level factors to characterize the patenting proc- ess in Mexico. Using a dynamic panel data empirical approach our results show that agglomeration, as meas- ured by population density, exerts the bigger influence on the accumulation of patents. This finding indicates that innovation activities tend to be localized in those regions where there are better market size related opportunities. Additionally, other forces connected to agglomeration, such as urbanization and spillovers must be interplaying in to explain the patenting performance. Another factor that resulted considerably important in explaining pat- enting intensity is the concentration of employment in high-tech industries. Public education is also found to be relevant in deter- mining innovation activities. When the federal subsidy on public universities increases, so does the inventive coefficient. Higher educational levels also imply higher patents accumulated. Aiming to improve Mexico’s inno- vation performance, we can state that a deeper effort in terms of higher education expenditure must be carried out. It should be complemented with schemes designated to seize the advantage of agglomeration economies that according to our study, are already present. If theoretical arguments are correct and knowledge based innovation is the key factor explaining economic growth in recent years, we should expect a more explicit effort by the national government in terms of enhancing the federal states capabilities of capitalizing better tech- nological opportunities. Nevertheless and making a quick assessment of the matter, this does not appear to be the case. Additionally, as economic growth has been ac- knowledged as a more regional or local process, state or local science and technology development programs should become more prevalent. And again, there is not a clear indication that this will be the path to follow in the near future. REFERENCES [1] J. Aboites, “Innovación, Patentes y Globalización”. In Jaime Aboites and Gabiela Dutrénit (Eds.), Innovación, Aprendizaje y Creación de Capacidades Tecnológicas, México: Universidad Autónoma Metropolitana-Porrúa, 2003, pp. 163-206. [2] Z. Acs, L. Anselin and A. Varga, “Patents and Innovation Counts as Measures of Regional Production of New Knowledge,” Research Policy, Vol. 31, 2002, pp. 1069-1085. doi:10.1016/S0048-7333(01)00184-6 [3] P. Aghion, C. Harris, P. Howitt and J. Vickers, “Competi- tion, Imitation and Growth with Step-by-Step Innova- tion,” Review of Economic Studies, Vol. 68, 1998, pp. 467-492. doi:10.1111/1467-937X.00177 [4] M. Arellano, “Modelling Optimal Instrumental Variables for Dynamic Panel Data Models,” Econometrics Invited Lecture, European Meeting of the Econometric Society, Venice, August 2002. CEMFI Working Paper no. 0310. [5] M. Arellano, Panel Data Econometrics. Advanced Texts in Econometrics, Oxford University Press, Oxford, 2003. doi:10.1093/0199245282.001.0001 [6] M. Arellano and S. Bond, “Some Tests of Specification for Panel Data: Monte Carlo Evidence and an Application to Employment Equations,” Review of Economic Studies, Vol. 58, No. 2, 1991, pp. 277-297. doi:10.2307/2297968 [7] M. Arellano and S. Bond, “Dynamic Panel Data Estima- tion Using DPD98 for Gauss: A Guide for Users,” Un- Copyright © 2013 SciRes. TI  V. GERMAN-SOTO, L. G. FLORES 9 published, 1998. [8] B. H. Baltagi, Econometrics, Springer-Verlag, New York, 2008. [9] R. Barro and X. Sala-i-Martin, 2004, Economic Growth. MA: The MIT Press, Cambridge, 2004. [10] R. L. Basmann, M. McAleer and D. Slottje, “Patent Ac- tivity and Technical Change,” Journal of Econometrics, Vol. 139, 2007, pp. 355-375. doi:10.1016/j.jeconom.2006.10.019 [11] P. Beneito, P. Coscollá-Girona, M. E. Ro- china-Barrachina and A. Sanchis-Llopis, “Competitive Pressure Determinants and Innovation at the Firm Level,” Ivie Working Paper Series 2011-02, InstitutoValenciano de Investigaciones Económicas, 2011, p. 40. [12] R. Blundell and S. Bond, “Initial Conditions and Moment Restrictions in Dynamic Panel Data Models,” Journal of Econometrics, Vol. 87, No. 1, 1998, pp. 115-143. doi:10.1016/S0304-4076(98)00009-8 [13] M. Capdevielle, Composición Tecnológica de la Industria Manufacturera Mexicana. In Aboites J. y Gabriela Dutrénit (Eds). Innovación, Aprendizaje y Creación de Capacidades Tecnológicas. México: Universidad Autónoma Metropolitana-Porrúa. 2003, pp. 249-284. [14] M. H. Fallah and S. Ibrahim “Knowledge Spillover and Innovation in Technological Clusters,” Mimeo, Interna- tional Association for Management of Technology, 2004, p. 16. [15] M. Feldman and D. Kogler, “The contribution of public entities to innovation and technological change”, In S. Shane (ed.) The Handbook of Technology and Innovation Management, Wiley Publishing, West Sussex, 2008, pp. 431-460. [16] M. Feldman and M. Kelley, “How States Augment the Capabilities of Technology-Pioneering Firms,” Growth and Change, Vol. 33, No. 2, 2002, pp. 173-195. [17] K. J. Gotvassli, “Community Knowledge - A Catalyst for Innovation,” The Journal of Regional Analysis and Policy Vol. 38, No. 2, 2008, pp. 145-158. [18] U. Grasjö, “Accesibility to R&D and Patent Production,” CESIS Electronic Working Paper Series, No. 37, 2005, p. 35 [19] V. German-Soto, L. Gutiérrez and S. H. Tovar Montiel, “Factores y relevancia geográfica del proceso de innovación regional en México, 1994-2006,” Estudios Económicos, Vol. 24, No. 2, 2009, pp. 225-248. [20] V. German-Soto and L. Gutiérrez, “Time Series Tests of Structural Change among Innovation and Trade Liberali- zation in Mexico”, Journal of the Knowledge Economy, Vol. 1, No. 3, 2010, pp. 219-237. doi:10.1007/s13132-010-0015-6 [21] V. German-Soto and L. Gutiérrez, “Measurement of the Agglomeration and the Geographic Concentration of the Innovation across Mexican States”. In F. Vargas, A. Ivanova, G. Meijer and B. Burgos (eds.), New Challenges, New methodologies. Proceedings of the XI ISINI Con- ference. Hermosillo: Pearson Education and Universidad de Sonora, 2011, pp. 118-134. [22] W. H. Greene, Econometric Analysis, New Jersey: Pear- son Prentice Hall, 2008. [23] G. M. Grossman and E. E. Helpman, “Endogenous Inno- vation in the Theory of Growth,” The Journal of Eco- nomic Perspectives, Vol. 8, No. 1, 1994, pp. 23-44. doi:10.1257/jep.8.1.23 [24] A. Jaffe, “Technological Opportunity and Spillovers of R&D: Evidence from Firms’ Patents, Profits and Market Value,” The American Economic Review, Vol. 7, No. 5, 1986, pp. 984-1001. [25] A. Jaffe, M. Trajtenberg and R. Henderson, “Geographic Localization of Knowledge Spillovers as Evidenced by Patent Citations,” Quarterly Journal of Economics, Vol. 108, No. 3, 1993, pp. 577-598. doi:10.2307/2118401 [26] C. Jones I., “The Shape of Production Functions and the Direction of Technical Change,” The Quarterly Journal of Economics, Vol. 120, No. 2, 2005, pp. 517-549. [27] R. A. Judson and A. L. Owen, “Estimating Dynamic Panel Data Models: A Guide for Macroeconomists,” Economics Letters, Vol. 65, 1999, pp. 9-15. doi:10.1016/S0165-1765(99)00130-5 [28] B. Karlsson and C. Johansson “Towards a Dynamic The- ory for the Spatial Knowledge Economy,” CESIS Elec- tronic Working Paper Series, No. 20, 2004, p. 31. [29] S. S. Kortum, “Research, Patenting, and Technological Change,” Econometrica, Vol. 65, 1997, pp. 1389-1419. http://dx.doi.org/10.2307/2171741 [30] O. Lehtoranta, “Innovation, Collaboration in Innovation and the Growth Performance of Finnish Firms,” VTT Publications 279, Technical Research Center of Finland, 2010, p. 136. [31] K. Meagher and M. Rogers, “Networks, spillovers and models of economic growth”, Discussion Papers, Sidney, The University of New South Wales, 1998, pp. 1-34. [32] M. Orlando, “On the importance of geographic and tech- nological proximity for R&D spillovers: An empirical investigation,” Mimeo, Department of Economic Investi- gation, Federal Reserve Bank of San Luis, 2000. [33] C. Ornaghi, “Spillovers in product and process innovation: Evidence from manufacturing firms,” International Journal of Industrial Organization, Vol. 24, 2006, pp. 349-380. doi:10.1016/j.ijindorg.2005.07.002. [34] A. Panagopoulos, “The Effect of IP Protection on Radical and Incremental Innovation,” Journal of the Knowledge Economy, Vol. 2, 2011, pp. 393-404. http://dx.doi.org/10.1007/s13132-011-0039-6 [35] M. P. Pérez, G. Dutrénit and F. Barceinas, “Actividad innovadora y desempeño económico de las empresas mexicanas,” document presented at the VI workshop of science and technology indicators, Buenos Aries, Sep- tember, 2004. [36] O. Raspe and F. van Oort, “Firm Growth and Localized Externalities,” The Journal of Regional Analysis and Policy, Vol. 38, No. 2, 2008, pp. 100-116. [37] A. J. Scott and M. Storper, “Regions, Globalization and Development,” Regional Studies, Vol. 37 No. 6&7, 2003, pp. 579-593. Copyright © 2013 SciRes. TI
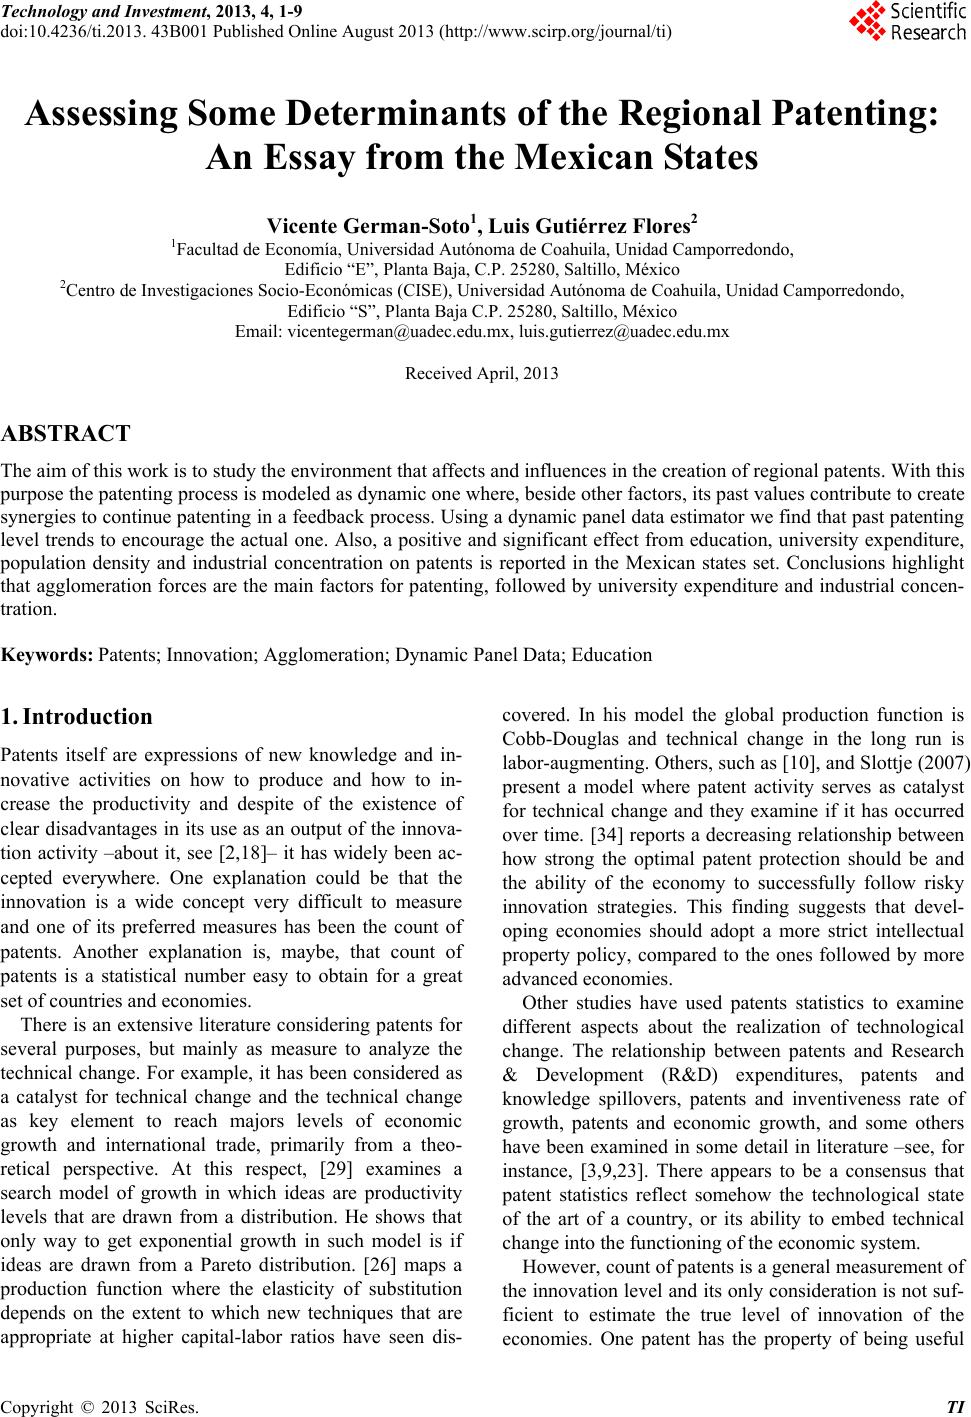
|