Paper Menu >>
Journal Menu >>
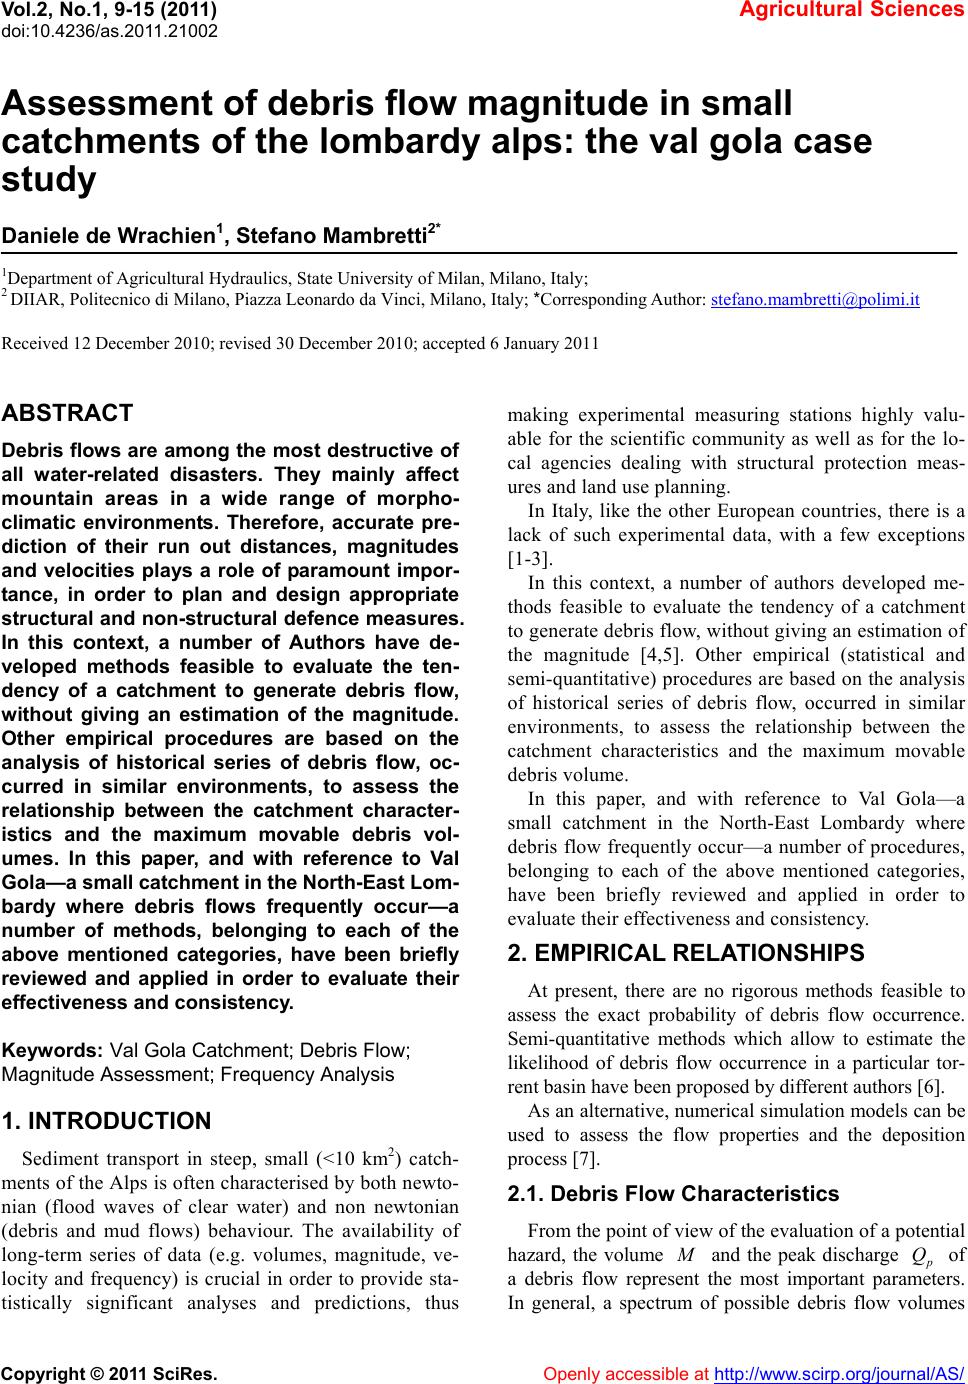 Vol.2, No.1, 9-15 (2011) Agricultural Sciences doi:10.4236/as.2011.21002 Copyright © 2011 SciRes. Openly accessible at http:// www.scirp.org/journal/AS/ Assessment of debris flow magnitude in small catchments of the lombardy alps: the val gola case study Daniele de Wrachien1, Stefano Mambretti2* 1Department of Agricultural Hydraulics, State University of Milan, Milano, Italy; 2 DIIAR, Politecnico di Milano, Piazza Leonardo da Vinci, Milano, I taly; *Corresponding Author: stefano.mambretti@polimi.it Received 12 December 2010; revised 30 December 2010; accepted 6 January 2011 ABSTRACT Debris flows are among the most destructive of all water-related disasters. They mainly affect mountain areas in a wide range of morpho- climatic environments. Therefore, accurate pre- diction of their run out distances, magnitudes and velocities plays a role of paramount impor- tance, in order to plan and design appropriate structural and non-structural defence measures. In this context, a number of Authors have de- veloped methods feasible to evaluate the ten- dency of a catchment to generate debris flow, without giving an estimation of the magnitude. Other empirical procedures are based on the analysis of historical series of debris flow, oc- curred in similar environments, to assess the relationship between the catchment character- istics and the maximum movable debris vol- umes. In this paper, and with reference to Val Gola—a small catchment in the North-East Lom- bardy where debris flows frequently occur—a number of methods, belonging to each of the above mentioned categories, have been briefly reviewed and applied in order to evaluate their effectiveness a nd c ons istency. Keywords: Val Gola Catchment; Debris Flow; Magnitude Assessment; Frequency Analysis 1. INTRODUCTION Sediment transport in steep, small (<10 km2) catch- ments of the Alps is often characterised by both newto- nian (flood waves of clear water) and non newtonian (debris and mud flows) behaviour. The availability of long-term series of data (e.g. volumes, magnitude, ve- locity and frequency) is crucial in order to provide sta- tistically significant analyses and predictions, thus making experimental measuring stations highly valu- able for the scientific community as well as for the lo- cal agencies dealing with structural protection meas- ures and land use planning. In Italy, like the other European countries, there is a lack of such experimental data, with a few exceptions [1-3]. In this context, a number of authors developed me- thods feasible to evaluate the tendency of a catchment to generate debris flow, without giving an estimation of the magnitude [4,5]. Other empirical (statistical and semi-quantitative) procedures are based on the analysis of historical series of debris flow, occurred in similar environments, to assess the relationship between the catchment characteristics and the maximum movable debris volume. In this paper, and with reference to Val Gola—a small catchment in the North-East Lombardy where debris flow frequently occur—a number of procedures, belonging to each of the above mentioned categories, have been briefly reviewed and applied in order to evaluate their effectiveness and consistency. 2. EMPIRICAL RELATIONSHIPS At present, there are no rigorous methods feasible to assess the exact probability of debris flow occurrence. Semi-quantitative methods which allow to estimate the likelihood of debris flow occurrence in a particular tor- rent basin have been proposed by different authors [6]. As an alternative, numerical simulation models can be used to assess the flow properties and the deposition process [7]. 2.1. Debris Flow Characteristics From the point of view of the evaluation of a potential hazard, the volume M and the peak discharge p Q of a debris flow represent the most important parameters. In general, a spectrum of possible debris flow volumes 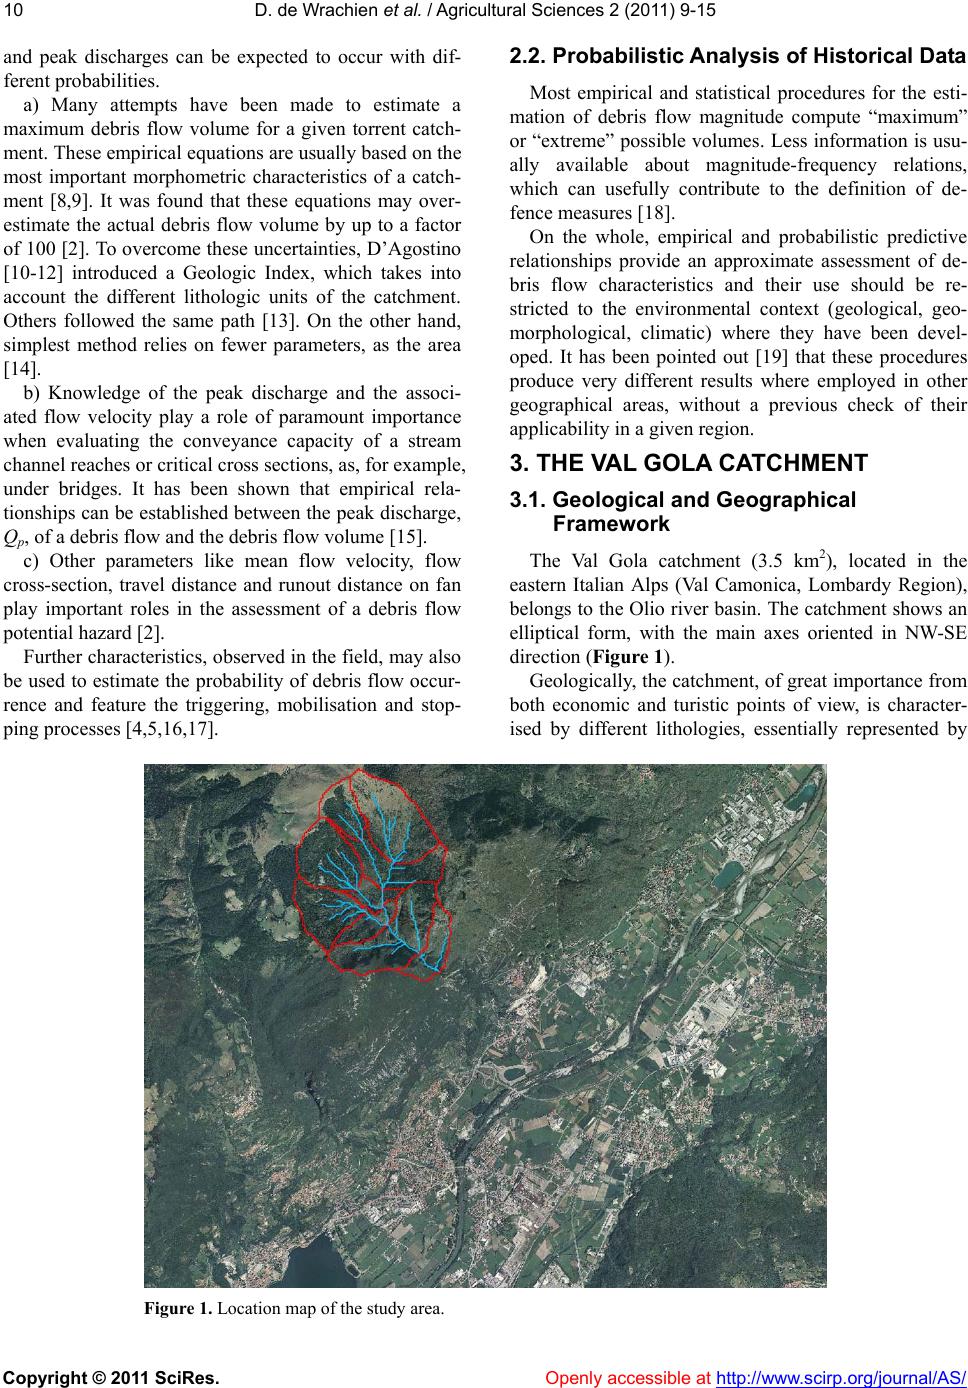 D. de Wrachien et al. / Agricultural Sci ences 2 (2011) 9-15 Copyright © 2011 SciRes. Openly accessible at http:// www.scirp.org/journal/AS/ 10 and peak discharges can be expected to occur with dif- ferent probabilities. a) Many attempts have been made to estimate a maximum debris flow volume for a given torrent catch- ment. These empirical equations are usually based on the most important morphometric characteristics of a catch- ment [8,9]. It was found that these equations may over- estimate the actual debris flow volume by up to a factor of 100 [2]. To overcome these uncertainties, D’Agostino [10-12] introduced a Geologic Index, which takes into account the different lithologic units of the catchment. Others followed the same path [13]. On the other hand, simplest method relies on fewer parameters, as the area [14]. b) Knowledge of the peak discharge and the associ- ated flow velocity play a role of paramount importance when evaluating the conveyance capacity of a stream channel reaches or critical cross sections, as, for example, under bridges. It has been shown that empirical rela- tionships can be established between the peak discharge, Qp, of a debris flow and the debris flow volume [15]. c) Other parameters like mean flow velocity, flow cross-section, travel distance and runout distance on fan play important roles in the assessment of a debris flow potential hazard [2]. Further characteristics, observed in the field, may also be used to estimate the probability of debris flow occu r- rence and feature the triggering, mobilisation and stop- ping processes [4 ,5 ,1 6,17]. 2.2. Probabilistic Analysis of Historical Data Most empirical and statistical procedures for the esti- mation of debris flow magnitude compute “maximum” or “extreme” possible volumes. Less information is usu- ally available about magnitude-frequency relations, which can usefully contribute to the definition of de- fence measures [18]. On the whole, empirical and probabilistic predictive relationships provide an approximate assessment of de- bris flow characteristics and their use should be re- stricted to the environmental context (geological, geo- morphological, climatic) where they have been devel- oped. It has been pointed out [19] that these procedures produce very different results where employed in other geographical areas, without a previous check of their applicability in a given region. 3. THE VAL GOLA CATCHMENT 3.1. Geological and Geographical Framework The Val Gola catchment (3.5 km2), located in the eastern Italian Alps (Val Camonica, Lombardy Region), belongs to the Olio river basin. The catchment shows an elliptical form, with the main axes oriented in NW-SE direction (Figure 1). Geologically, the catchment, of great importance from both economic and turistic points of view, is character- ised by different lithologies, essentially represented by Figure 1. Location map of the study area. 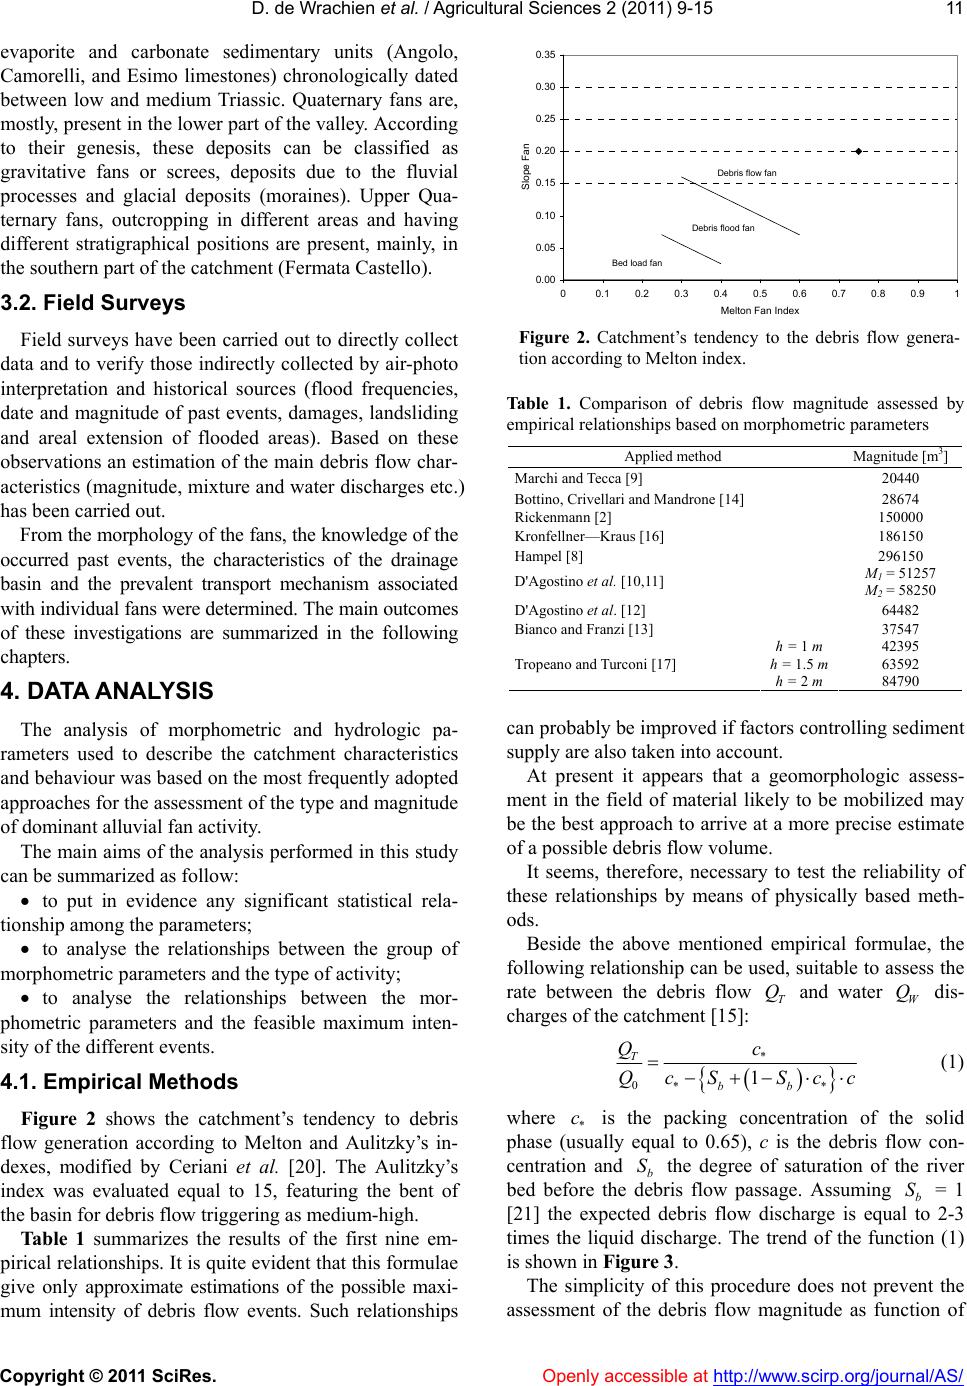 D. de Wrachien et al. / Agricultural Sci ences 2 (2011) 9-15 Copyright © 2011 SciRes. Openly accessible at http:// www.scirp.org/journal/AS/ 11 evaporite and carbonate sedimentary units (Angolo, Camorelli, and Esimo limestones) chronologically dated between low and medium Triassic. Quaternary fans are, mostly, present in the lower part of th e valley. According to their genesis, these deposits can be classified as gravitative fans or screes, deposits due to the fluvial processes and glacial deposits (moraines). Upper Qua- ternary fans, outcropping in different areas and having different stratigraphical positions are present, mainly, in the southern part of the catchment (Fermata Castello). 3.2. Field Surveys Field surveys have been carried out to directly collect data and to verify those indirectly collected by air-photo interpretation and historical sources (flood frequencies, date and magnitude of past events, damages, landsliding and areal extension of flooded areas). Based on these observations an estimatio n of the main debris flow char- acteristics (magnitude, mixture and water discharges etc.) has been carrie d out . From the morphology of the fans, the knowledge of the occurred past events, the characteristics of the drainage basin and the prevalent transport mechanism associated with individual fans were determined. The main outcomes of these investigations are summarized in the following chapters. 4. DATA ANALYSIS The analysis of morphometric and hydrologic pa- rameters used to describe the catchment characteristics and behaviour was based on the most frequently adopted approaches for the assessment of the type and magnitude of dominant alluvial fan activity. The main aims of the analysis performed in this study can be summarized as follow: to put in evidence any significant statistical rela- tionship among the parameters; to analyse the relationships between the group of morphometric parameters and the type of activity; to analyse the relationships between the mor- phometric parameters and the feasible maximum inten- sity of the different events. 4.1. Empirical Methods Figure 2 shows the catchment’s tendency to debris flow generation according to Melton and Aulitzky’s in- dexes, modified by Ceriani et al. [20]. The Aulitzky’s index was evaluated equal to 15, featuring the bent of the basin for debris flow triggering as medium-high. Table 1 summarizes the results of the first nine em- pirical relationships. It is quite evident that this formulae give only approximate estimations of the possible maxi- mum intensity of debris flow events. Such relationships 0.00 0.05 0.10 0.15 0.20 0.25 0.30 0.35 00.1 0.2 0.3 0.4 0.5 0.6 0.70.8 0.91 Melton Fan Index Slope Fan Bed load fan Debris flood fan Debris flow fan Figure 2. Catchment’s tendency to the debris flow genera- tion according to Melton index. Table 1. Comparison of debris flow magnitude assessed by empirical relationships based on morphometric parameters Applied method Magnitude [m3] Marchi and Tecca [9] 20440 Bottino, Crivellari and Mandrone [14] 28674 Rickenmann [2] 150000 Kronfellner—Kraus [16] 186150 Hampel [8] 296150 M1 = 51257 D'Agostino et al. [10,11] M2 = 58250 D'Agostino et al. [12] 64482 Bianco and Franzi [13] 37547 h = 1 m 42395 h = 1.5 m 63592 Tropeano and Turconi [17] h = 2 m 84790 can probably be improved if factors controlling sediment supply are also taken into account. At present it appears that a geomorphologic assess- ment in the field of material likely to be mobilized may be the best approach to arrive at a more precise estimate of a possible debris flo w v ol u m e . It seems, therefore, necessary to test the reliability of these relationships by means of physically based meth- ods. Beside the above mentioned empirical formulae, the following relationship can be used, suitable to assess the rate between the debris flow T Q and water W Q dis- charges of the catchment [15]: 01 T* *b b* Qc QcS Scc (1) where * c is the packing concentration of the solid phase (usually equal to 0.65), c is the debris flow con- centration and b S the degree of saturation of the river bed before the debris flow passage. Assuming b S = 1 [21] the expected debris flow discharge is equal to 2-3 times the liquid discharge. The trend of the function (1) is shown in Figure 3. The simplicity of this procedure does not prevent the assessment of the debris flow magnitude as function of  D. de Wrachien et al. / Agricultural Sci ences 2 (2011) 9-15 Copyright © 2011 SciRes. Openly accessible at http:// www.scirp.org/journal/AS/ 12 0.0 0.1 0.2 0.3 0.4 0.5 0.6 0.7 0.8 0.9 1.0 012345678910 Qt/Qw Concentration Sb = 0 Sb = 1 Figure 3. Ratio between the debris flow and liquid dis- charges Vs the debris flow concentration, with a variation of the ground saturation. the return period, which plays a role of great importance in the design of defensive measures. In the case of the Val Gola catchment, in order to per- form these computations, the estimation of the flood wave for different return times has been carried out. To do that, starting from Depth Duration Frequency (DDF) curves of different return times, a Chicago hyetograph has been built, which is critical for any duration shorter than its base time. On the basis of these hyetographs two infiltration methods have been used: Soil Conservation Service, with CN = 72; and Horton’s, considering a soil of type C [22]. Depression storages have been consid- ered equal to zero, being this assumption on the safe side, but without be exaggerated because of the very high slope of the catchment. The rainfall/runoff relationship is of the usual convo- lution type, where the instantaneous unit hydrograph is the derivative of the time-area curve, normalized with respect of the total area. The travel times have been computed considering the flow over a plane [23]: 35 332 5105 c s L t ksi (2) where L is the catchment length, s k its roughness, s the slope and i the rainfall intensity. The catchment rough- ness is a model parameter, tabled in [24], and assumed, in this work, equa l to 10. Generally speaking, not all the discharges produce solid transport, but with the simple application of the Schoklitsch’s relationship [25] it was easy to verify that, due to the very high slope, the hydrograph tails, which do not produce solid transport, are very limited. With the described methodology, the following results have been obtained: 5075900 3 wt T years,Wm,W 150000230000 3 m; 10088038 3 wt T years,Wm,W 3 170000 270000m; 3 200 100807 wt T years,Wm,W 3 200000 300000m. 4.2. Physically Based Methods Physically based approaches for assessing debris flow volumes are founded on the recognition of sediment sources, located along the channel network and feasible to be moved, in order to evaluate the probability of col- lapse. Some of these methods, known as geomor- phological methods [26], assume that all eroded material reaches the alluvial fan, whereas others consider the possibility of a partial redeposition within the basin. Generally speaking, differences in density amongst debris in source areas, flowing water-sediment mixture and debris flow deposits are usually neglected. In this work with the term “mass of sediment” is in- tended a debris volume made up of a single typology of prevalent material with homogeneous dimensions and materials, which represents an approximate hypothesis. The probability of collapse of a mass of sediment has been assessed on the basis of the typology of the mate- rial and the topographical and morphological character- istics of the catchment. For each single mass, the following parameters have been measured: area m A , length m L, average slope , average thickness H, porosity n, permeability k, internal friction angle and the upstream subcatchment char- acteristics, in particular the area b A , the runoff coeffi- cient and the slope S. The porosity and permeability values have been evaluated in a detailed study performed by Ghilardi et al. [27], assigning literature values checked with maps drawn up by the competent Authority (the Lombardy Region). On the basis of field surveys, the thickness of the sediments have been assessed within the range 1-3 m. Table 2 shows the debris volumes and the upstream catchment characteristics, while Ta b l e 3 gives the mov- able volumes, as function of the mean thickness. Different p roc edur es a re av ailab le , fe asib le to ev alu ate the probability of movement of a sediment mass [28]. According to Chen and Jan [28], the water depth that can move the mass is given by: 1 ss s s tantanGG nsn mtantans n ntan (3) where: s G specific weight of the solid divided by the specific weight of the liquid (Gs = γs/γw); s specific weight of the solid; w specific weight of the liquid (water); n porosity; 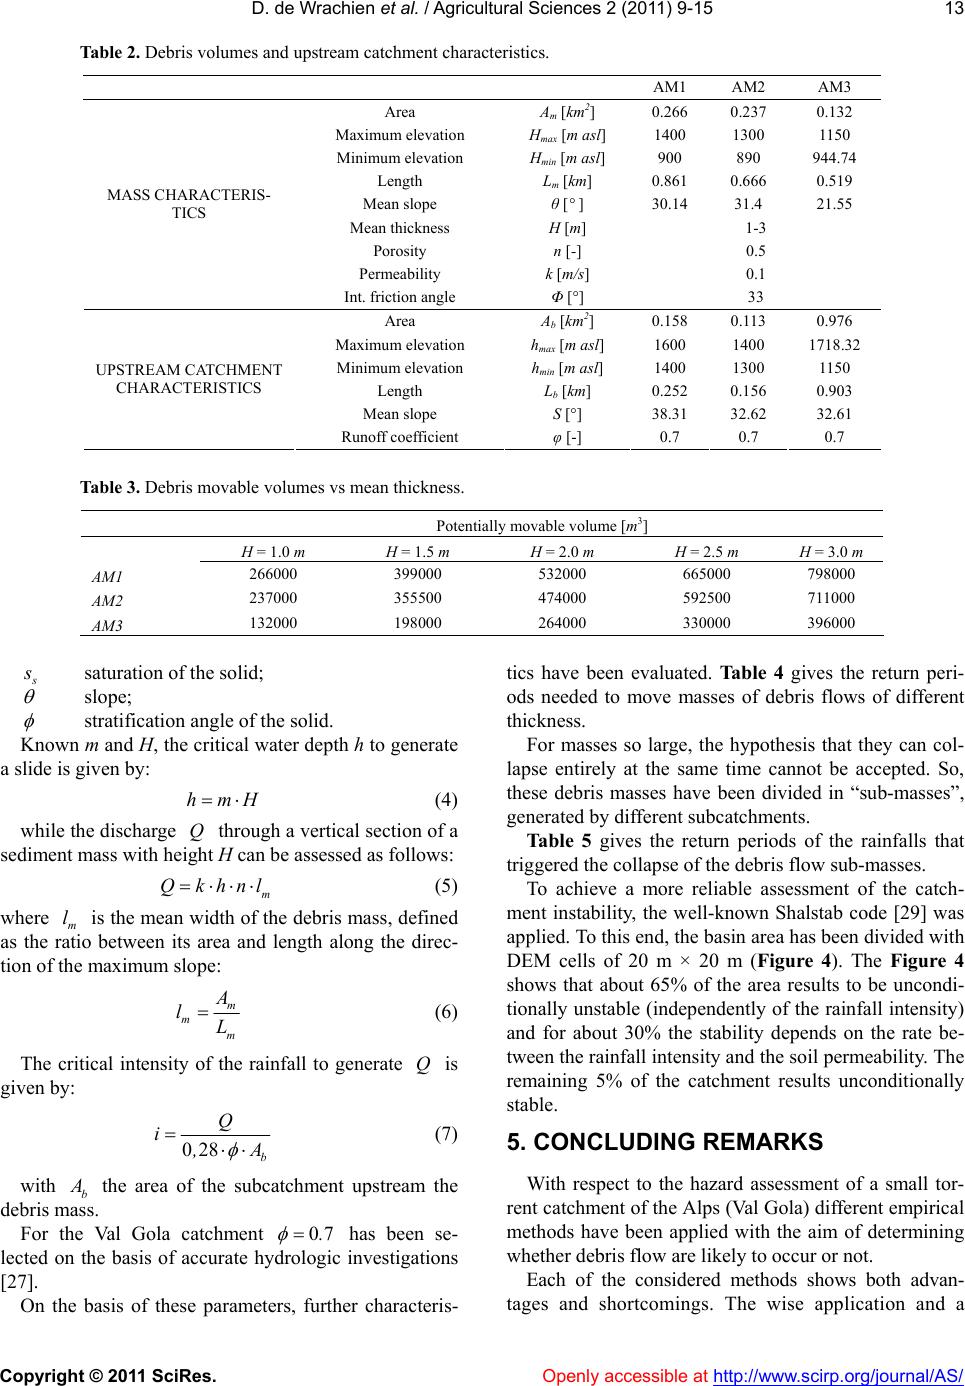 D. de Wrachien et al. / Agricultural Sci ences 2 (2011) 9-15 Copyright © 2011 SciRes. Openly accessible at http:// www.scirp.org/journal/AS/ 13 Table 2. Debris volumes and upstream catchment characteristics. AM1 AM2 AM3 Area Am [km2] 0.266 0.237 0.132 Maximum elevation Hmax [m asl] 1400 1300 1150 Minimum elevation Hmin [m asl] 900 890 944.74 Length Lm [km] 0.861 0.666 0.519 Mean slope θ [° ] 30.14 31.4 21.55 Mean thickness H [m] 1-3 Porosity n [-] 0.5 Permeability k [m/s] 0.1 MASS CHARACTERIS- TICS Int. friction angle Φ [°] 33 Area Ab [km2] 0.158 0.113 0.976 Maximum elevation hmax [m asl] 1600 1400 1718.32 Minimum elevation hmin [m asl] 1400 1300 1150 Length Lb [km] 0.252 0.156 0.903 Mean slope S [°] 38.31 32.62 32.61 UPSTREAM CATCHMENT CHARACTERISTICS Runoff coefficient φ [-] 0.7 0.7 0.7 Table 3. Debris movable volumes vs mean thickness. Potentially movable volume [m3] H = 1.0 m H = 1.5 m H = 2.0 m H = 2.5 m H = 3.0 m AM1 266000 399000 532000 665000 798000 AM2 237000 355500 474000 592500 711000 AM3 132000 198000 264000 330000 396000 s s saturation of the solid; slope; stratification angle of the solid. Known m and H, the critical water depth h to generate a slide is given by: hmH (4) while the discharge Q through a vertical section of a sediment mass with height H can be assessed as follows: m Qkhnl (5) where m l is the mean width of the debris mass, defined as the ratio between its area and length along the direc- tion of the maximum slope: m m m A lL (6) The critical intensity of the rainfall to generate Q is given by: 028b Q i,A (7) with b A the area of the subcatchment upstream the debris mass. For the Val Gola catchment 07. has been se- lected on the basis of accurate hydrologic investigations [27]. On the basis of these parameters, further characteris- tics have been evaluated. Ta bl e 4 gives the return peri- ods needed to move masses of debris flows of different thickness. For masses so large, the hypothesis that they can col- lapse entirely at the same time cannot be accepted. So, these debris masses have been divided in “sub-masses”, generated by different subcatchments. Table 5 gives the return periods of the rainfalls that triggered the collapse of the debris flow sub-masses. To achieve a more reliable assessment of the catch- ment instability, the well-known Shalstab code [29] was applied. To this end, the basin area has been divided with DEM cells of 20 m × 20 m (Figure 4). The Figure 4 shows that about 65% of the area results to be uncondi- tionally unstable (indep endently of the rainfall intensity) and for about 30% the stability depends on the rate be- tween the rainfall intensity and the soil p ermeability. The remaining 5% of the catchment results unconditionally stable. 5. CONCLUDING REMARKS With respect to the hazard assessment of a small tor- rent catchment of the Alps (Val Gola) different empirical methods have been applied with the aim of determining whether debris flow are likely to occur or not. Each of the considered methods shows both advan- tages and shortcomings. The wise application and a 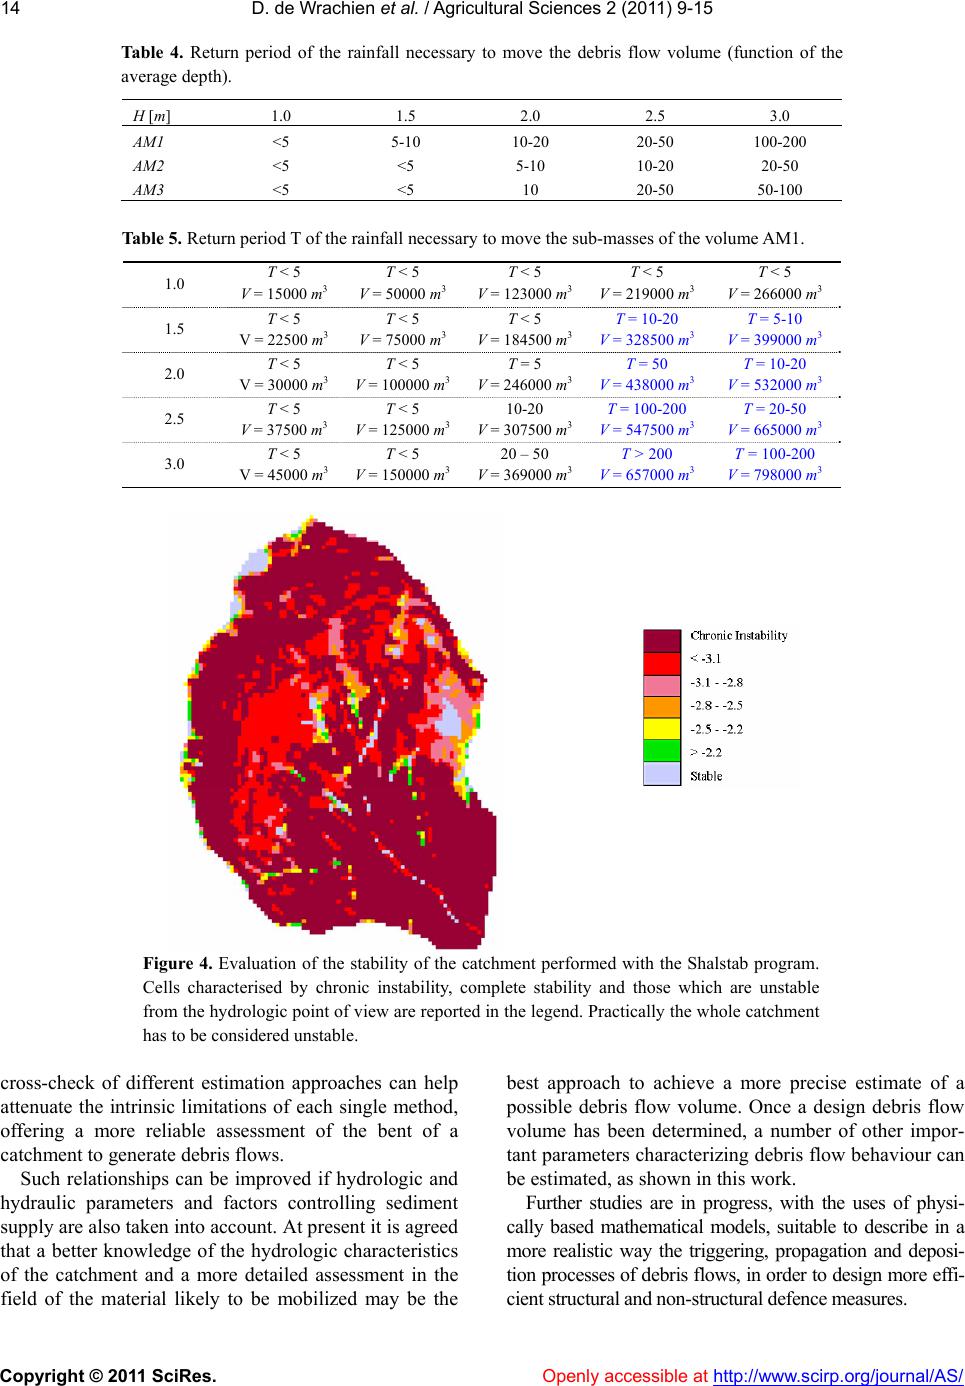 D. de Wrachien et al. / Agricultural Sci ences 2 (2011) 9-15 Copyright © 2011 SciRes. Openly accessible at http:// www.scirp.org/journal/AS/ 14 Table 4. Return period of the rainfall necessary to move the debris flow volume (function of the average depth). H [m] 1.0 1.5 2.0 2.5 3.0 AM1 <5 5-10 10-20 20-50 100-200 AM2 <5 <5 5-10 10-20 20-50 AM3 <5 <5 10 20-50 50-100 Table 5. Return period T of the rainfall necessary to move the sub-masses of the volume AM1. 1.0 T < 5 V = 15000 m3 T < 5 V = 50000 m3 T < 5 V = 123000 m3 T < 5 V = 219000 m3 T < 5 V = 266000 m3 1.5 T < 5 V = 22500 m3 T < 5 V = 75000 m3 T < 5 V = 184500 m3 T = 10-20 V = 328500 m3 T = 5-10 V = 399000 m3 2.0 T < 5 V = 30000 m3 T < 5 V = 100000 m3 T = 5 V = 246000 m3 T = 50 V = 438000 m3 T = 10-20 V = 532000 m3 2.5 T < 5 V = 37500 m3 T < 5 V = 125000 m310-20 V = 307500 m3 T = 100-200 V = 547500 m3 T = 20-50 V = 665000 m3 3.0 T < 5 V = 45000 m3 T < 5 V = 150000 m320 – 50 V = 369000 m3 T > 200 V = 657000 m3 T = 100-200 V = 798000 m3 Figure 4. Evaluation of the stability of the catchment performed with the Shalstab program. Cells characterised by chronic instability, complete stability and those which are unstable from the hydrologic point of view are reported in the legend. Practically the whole catchment has to be considered unstable. cross-check of different estimation approaches can help attenuate the intrinsic limitations of each single method, offering a more reliable assessment of the bent of a catchment to generate debris flows. Such relationships can be improved if hydrologic and hydraulic parameters and factors controlling sediment supply are also taken into accoun t. At present it is agreed that a better knowledge of the hydrologic characteristics of the catchment and a more detailed assessment in the field of the material likely to be mobilized may be the best approach to achieve a more precise estimate of a possible debris flow volume. Once a design debris flow volume has been determined, a number of other impor- tant parameters characterizing debris flow behaviour can be estimated, as shown in this work. Further studies are in progress, with the uses of physi- cally based mathematical models, suitable to describe in a more realistic way the triggering, propagation and deposi- tion processes of debris flows, in order to design more effi- cient structural and non-structural defence measures.  D. de Wrachien et al. / Agricultural Sci ences 2 (2011) 9-15 Copyright © 2011 SciRes. Openly accessible at http:// www.scirp.org/journal/AS/ 15 REFERENCES [1] Zimmerman, M., Mani, P. and Romang, H. (1997) Magnitude-frequency aspects of alpine debris flow. Eclogae Geologicae Helvetiae, 90, 415-420. [2] Rickenmann, D. (1999) Empirical relationships for debris flows. Natural Hazards, 19, 47-77. doi:10.1023/A:1008064220727 [3] Marchi, L., Arattano, M. and Deganutti, A.M. (2002) Ten years of debris-flow monitoring in the Moscardo Torrent (Italian Alps). Geomorphology, 46, 1-17. doi:10.1016/S0169-555X(01)00162-3 [4] Melton, M.A. (1965) The geomorphic and paleoclimatic significance of alluvial deposits in Southern Arizona. Journal of Geology, 73, 1-38. doi:10.1086/627044 [5] Aulitzky, H. (1980) Preliminary two—fold classification of torrents. Proceedings of International Symposium, Austria, 285-310. [6] Nakamura, J. (1980) Investigation manual on prediction of occurence od Dosekiryu [debris flow] delineation of sangerous zone affected by Dosekiryu and arrangement of warning and evacuation system in mountain torrents in Japan. Proceedings of International Symposium, Austria, 41-81. [7] Hungr, O. (1995) A model for the runout analysis of rapid flow slides. Canadian Geotechnical Journal, 32, 610-623. doi:10.1139/t95-063 [8] Hampel, R. (1977) Geschiebewirtschaft in Wildbächen [sediment budget of torrents]. Wildbach-und Lawinen- verbau, 41, 3-34 (in German). [9] Marchi, L. and Tecca, P.R. (1996) Magnitudo delle colate detritiche nelle Alpi Orientali. Italiane Geoin- gegneria Ambientale e Mineraria, 33, 79-86. (in Italian). [10] D’Agostino, V. (1996) Analisi quantitativa del trasporto solido torrentizio nei bacini montani del Trentino Orientale in “Scritti dedicati a Giovanni Tournon”. Associazione italiana di Ingegneria agraria—Associa- zione Idrotecnica Italiana, Novara (Italy), 111-123 (in Italian). [11] D’Agostino, V., Cerato, M. and Coali, R. (1996) Extreme events of sediment transport in the eastern Trentino torrents. Atti del Convegno Interpraevent, 1, 377-386. [12] D’Agostino, V. and Marchi, L. (2004) Estimation of debris-flow magnitude in the Eastern Italian Alps. Earth Surface Processes and Landforms, 29, 207-220. doi:10.1002/esp.1027 [13] Bianco, G. and Franzi, L. (2000) Estimation of debris flow volumes from storm events. Proceedings of Debris Flow Mitigation: Mechanics, Prediction and Assessment, Taipei, Taiwan, 441-448. [14] Bottino, G., Crivellari, R. and Mandrone, G. (1996) Eventi pluviometrici critici e dissesti: Individuazione delle soglie d’innesco di colate detritiche nell’anfiteatro morenico di Ivrea. Proceedings of La prevenzione delle catastrofi idrogeologiche: il contributo alla ricerca scien- tifica, Alba (Torino), 201-210. [15] Takahashi, T., Sawada, T., Suwa, H., Mizuyama, T., Mizuhara, K., Wu, J., Tang, B., Kang, Z., Zhou, B. (1994) Japan-China joint research on the prevention from debris flow hazards. Research Report, Japanese Ministry of Education, Science and Culture, International Scientific Research Program, No. 03044085. [16] Kronfellner-Kraus, G. (1984) Extreme feststofffrachten und grabenbildungen von wildbächen [extreme sediment loads and erosion of torrents]. Proceedings of International Symposium Interpraevent, Villach, Austria, 2, 109-118 (in German). [17] Tropeano, D. and Turconi, L. (1999) Valutazione del potenzial e d e tr iti co in p icc oli b a cini delle Alpi Occidentali e Centrali. CNR-IRPI/GNDCI, Pubbl. n. 2058 Linea 1, 151. [18] Johnson, P.A., McCuen, R.H. and Hromadka, T.V. (1990) Magnitude and frequency of debris flow. Journal of Hydrology, 123, 69-82. doi:10.1016/0022-1694(91)90069-T [19] Meunier, M., Rickenmann, D. and Rahuel, J.L. (2000) Workshop 3—torrential hazard—general in “risques naturel en montagne”. In: Gillet, F. and Zanolini, F., Eds., Cemagref Editions, France, 329-333. [20] Ceriani, M., Fossati, D. and Quattrini, S. (1998) Valutazione della pericolosità idrogeologica sulle conoidi alpine; esempio della metodologia di Aulitzky applicata alla conoide del torrente Re di Gianico-Valcamonica (Bs) —Alpi Centrali. Atti del XXVI Convegno di Idraulica e Costruzioni Idrauliche, Catania (in Italian). [21] Armanini, A. (1996) Colate di detrito. Rapporti di lavoro dell’Istituto Geologico della Repubblica Italiana e del Cantone del Ticino (in Italian). [22] Soil Conservation Service Hydrology National Eng i n ee r in g Handbook (1956) Section 4, Washington D.C., U.S.A. [23] Wooding, R.A. (1965) A hydraulic model for the catchment stream problem. Kinematic wave theory. Journal of Hydrology, 3, 254-267. doi:10.1016/0022-1694(65)90084-3 [24] Mignosa, P. (1989) Sui problemi di dimensionamento delle reti di drenaggio urbano. Dissertazione per il conseguimento del titolo di Dottore di Ricerca, Istituto di Idraulica, Politecnico di Milano (in Italian). [25] Schoklitsch, A. (1962) Handbuch des Wasserbaues, Springer, Wien (in German). [26] Marchi, L. and D’Agostino, V. (2004) Estimation of debris flow magnitude in the eastern Italian Alps. Earth Surface Processes and Landforms, 29, 207-220. doi:10.1002/esp.1027 [27] Ghilardi, F., Ghilardi, S. and Mambretti, S. (2006) Studio di dettaglio della conoide della Val Gola in comune di Costa Volpino Relazione Tecnica (in Italian). [28] Chen, J.C. and Jan, C.D. (2000) Debris flow occurrence probability on hillslopes. Proceedings of Debris Flow Mitigation: Mechanics, Prediction and Assessment, Balkema, Rotterdam. [29] Montgomery, D.R and Dietrich, W.E. (1994) A physically based model for the topographic control on shallow landsliding. Water Resources Research, 30, 1153-1171. doi:10.1029/93WR02979 |