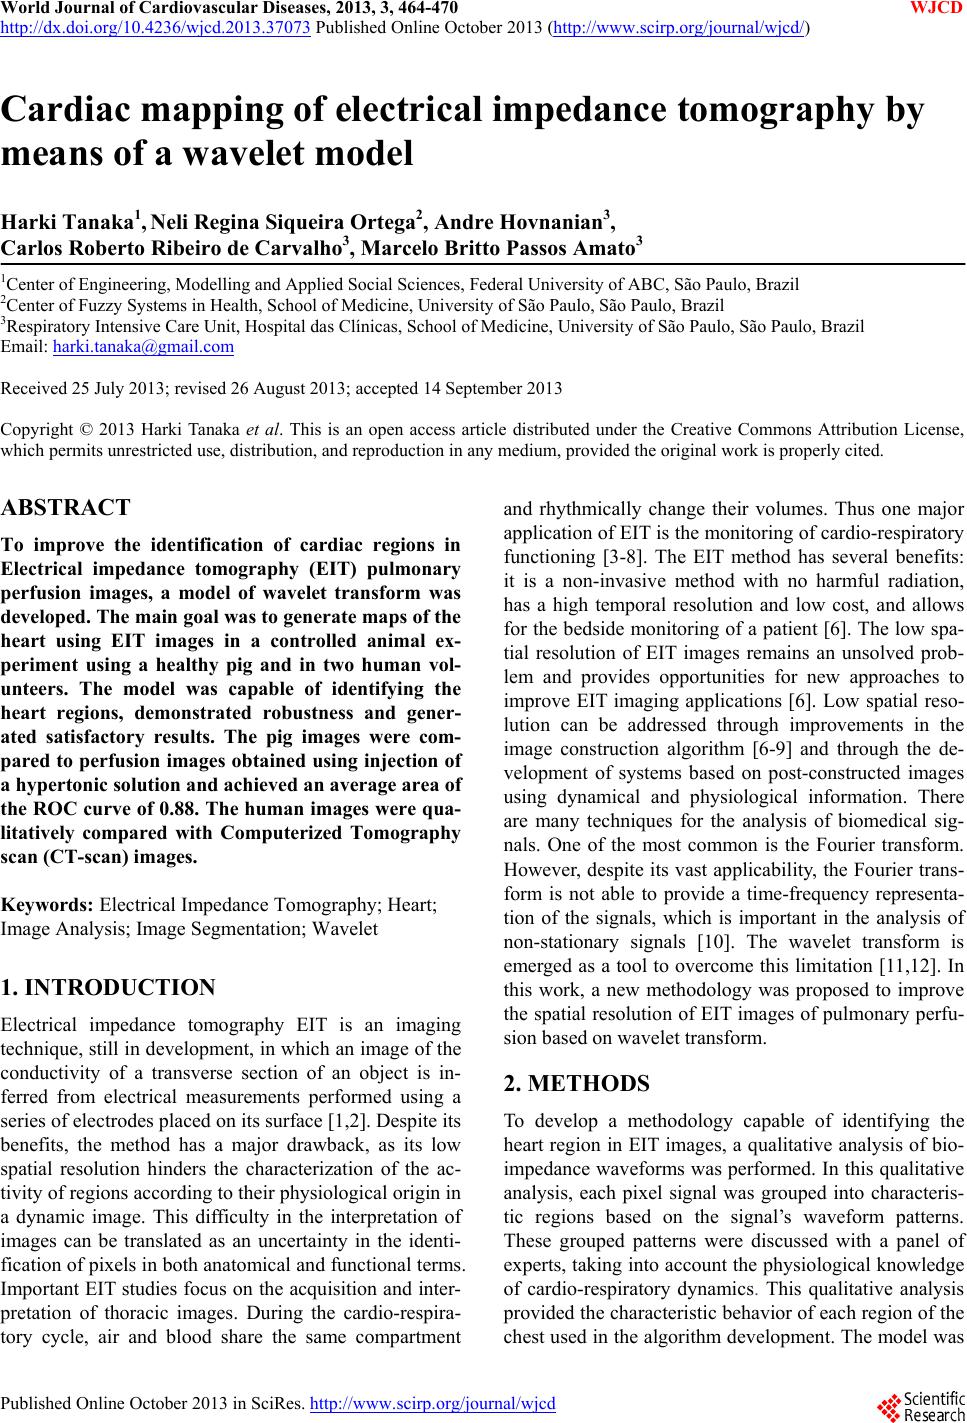
H. Tanaka et al. / World Journal of Cardiovascular Diseases 3 (2013) 464-470
466
of the EIT temporal signals of the pixels was performed
to identify macro regions according to the observed
variations in bio-impedance during the cardiac cycle. To
identify the regions with similar signals, a qualitative
evaluation of the signal patterns was performed. Fol-
lowing this qualitative analysis, the pixels were grouped
into regions based on similarities in their dynamic be-
haviors, and a characteristic pixel for each region was
chosen. After the identification of the regions and their
characteristic signals, each signal was analyzed by quail-
tatively comparing the variation of impedance with the
variation of blood flow during the cardiac cycle. Based
on the experience of experts in the respiratory ICU at the
Clinics Hospital of São Paulo, Brazil, in a consensus
method, we decided whether each pixel more likely be-
longed to the heart or lungs. This analysis required that
the beginning of each EIT signal was synchronized with
the peak of the R-wave of the ECG signal, marking the
beginning of systole, i.e., ventricular contraction.
2.2.2. Wavelet Methods for Identification of Cardiac
Regions
From the qualitative analysis, it was assumed that a ty-
pical pixel within the card iac region has a positive varia-
tion in impedance during the first half of the cardiac cy-
cle. Thus, for a set of images of a complete cardiac cycle,
the pixel with the highest increase in impedance was
selected. This pixel was considered to be the best repre-
sentation of the cardiac region, and the analysis of all
other pixels was conducted relative to the reference pixel.
A wavelet transform was applied to the impedance signal
of the reference pixel using as wavelet-mother the gaus4
to obtain the space of coefficients in the plane disloca-
tion-scale. The values of these coefficients were normal-
ized to the interv al [0,1 ]. After normalization , a thresho ld
of 0.70 was applied to define a region in the disloca-
tion-scale space that reflected typical cardiac behavior.
This region was used as a mask in the dislocation-scale
space to compare all pixels with the reference pixel. For
each pixel, the same processes of the wavelet transform
and the normalization of the space coefficients were per-
formed. The reference mask was applied to each of the
displacement-scale spaces and a set of coefficient values
was selected. This set of coefficients was used to deter-
mine whether each pixel belonged in the cardiac region.
Using these values, it was possible to create a map of
parameters representing all pixels. In this study, two pos-
sible parameters were analyzed: the average values of the
coefficients of the mask (method-1); and the maximum
value of the coefficients of the mask (method-2). The
cardiac images were generated from a z-score normaliza-
tion on the parameter map. In this normalized space, a
threshold value for a pixel belonging to the cardiac re-
gion can be heurist i cal l y establ i shed.
In this case, a threshold value of 0.5 was used.
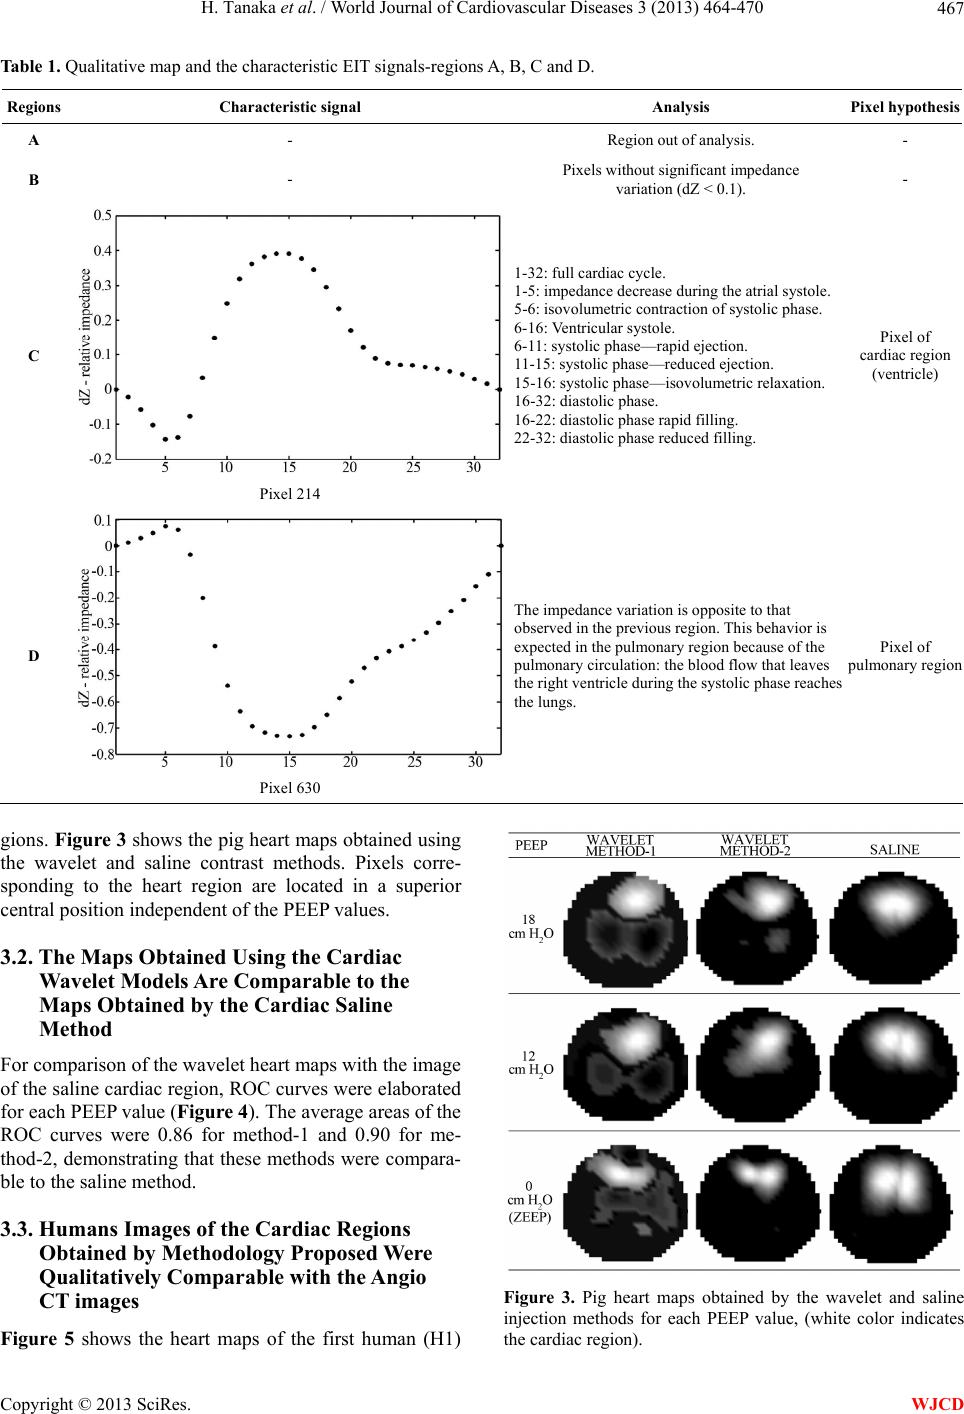
2.3. Model Evaluation
To evaluate its performance, the model was used to ana-
lyze EIT images from the animal experiment collected at
other values of PEEP. In this analysis, the cardiac regions
obtained by the saline injection method were used as a
reference for comparison, and the system performance
was evaluated using receiver operating characteristic
(ROC) curves. It is important to highlight that the saline
injection image is not the gold standard for imaging of
the heart region. When we compare the results of the
model with the saline data, we are only verifying how
well the model reproduces the contrast data. As saline
images are not feasible for human subjects, it was not
possible to evaluate the system using ROC curves.
Therefore, the EIT images of the heart region in humans
were qualitatively compared with X-ray CT images.
3. RESULTS
3.1. The Dynamics of the EIT Signal Carry
Information That Allows for Pixel
Characterization as Belonging to the
Cardiac Region
Through qualitative analysis of the EIT signal patterns, a
map was generated in which the pixels were grouped
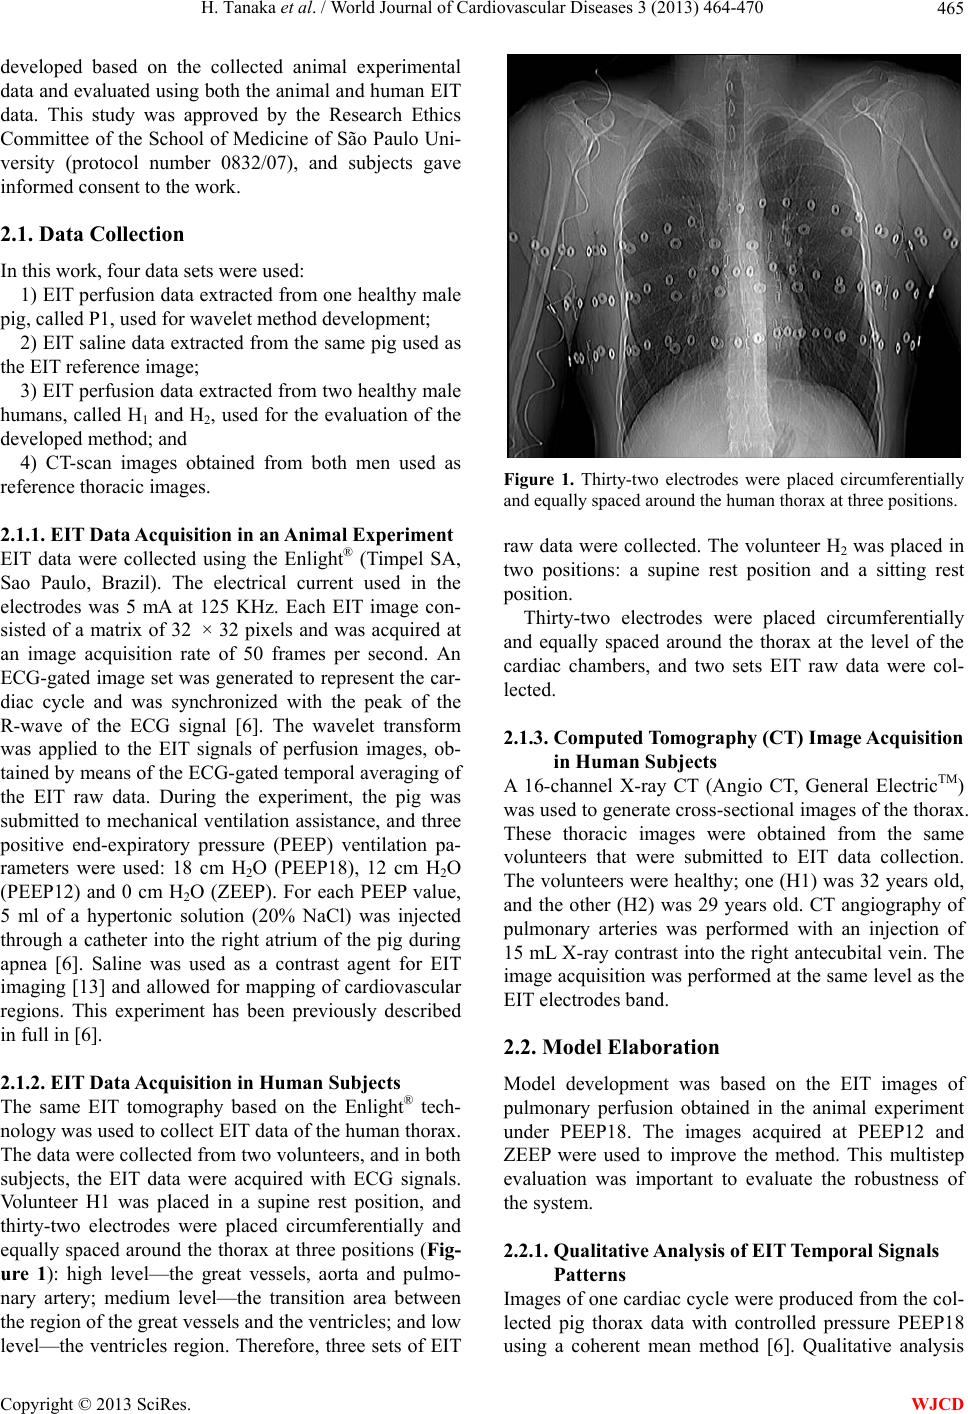
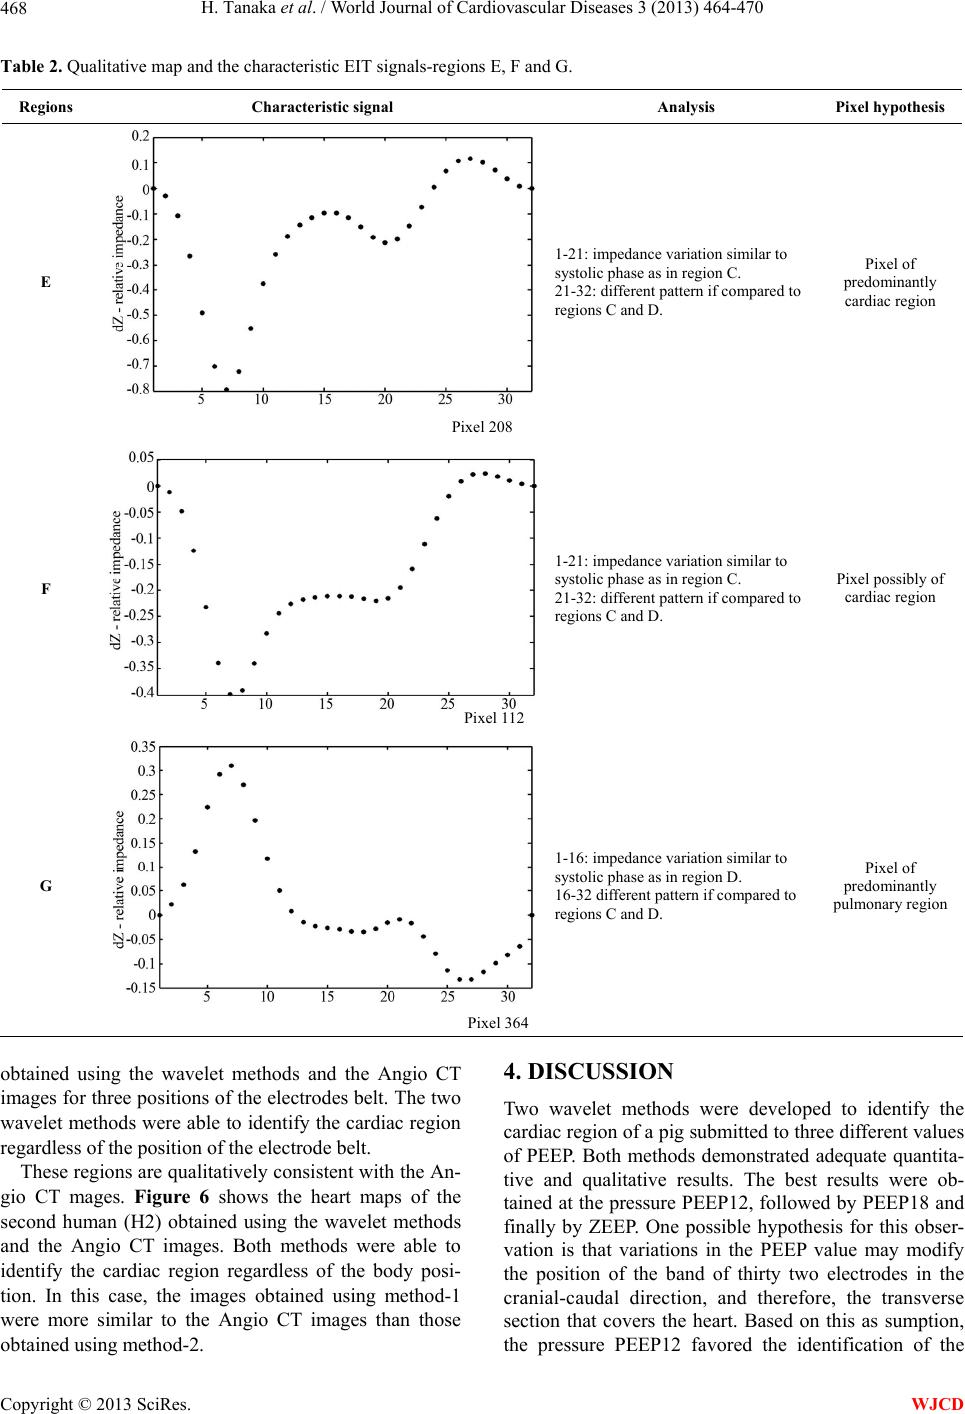
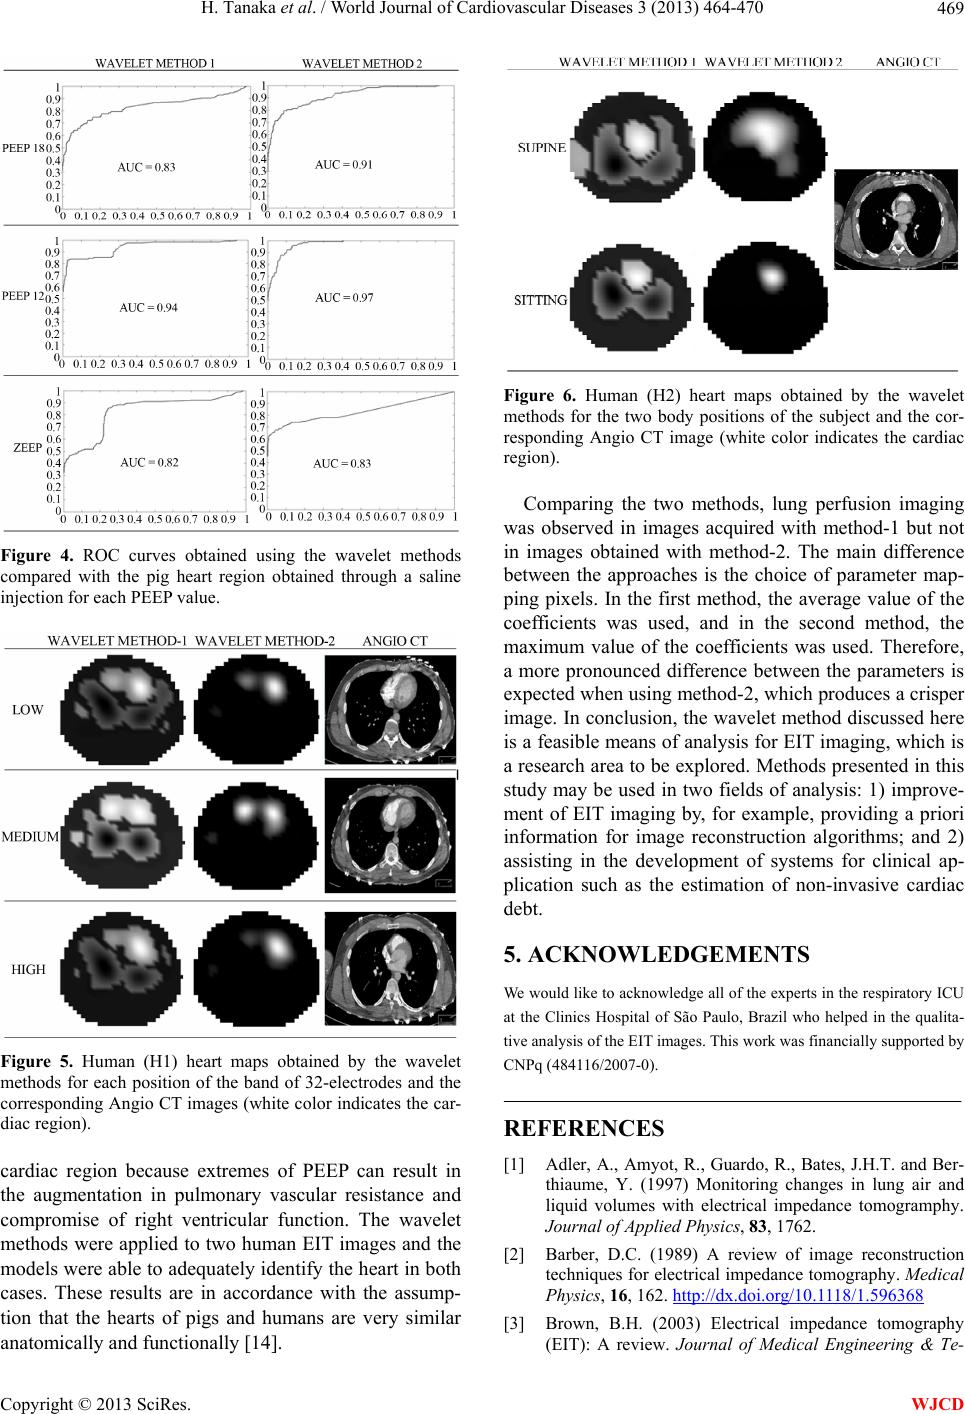
based on their similarities (Figure 2). Tables 1 and 2
show the qualitative analysis, describe the characteristics
of each region and link them to their possible anatomical
regions. In Ta ble 1, pixel 214 shows a typical variation
in impedance of the ventricular region during the cardiac
cycle, and pixel 630 shows a typical variation of imped-
ance of a pulm o nary region.
Table 2 presents examples of pixels where the imped-
ance variation is not typical of either heart or lung re-
Figure 2. EIT Map with the regions found by qualitative analy-
sis of the wave patterns of a pig’s EIT signals.
Copyright © 2013 SciRes. WJCD