Paper Menu >>
Journal Menu >>
 Vol.2, No.1, 1-8 (2011) Agricultural Sciences doi:10.4236/as.2011.21001 Copyright © 2011 SciRes. Openly accessible at http:// www.scirp.org/journal/AS/ Quantitative and qualitative changes of humus in whole soils and their particle size fractions as influenced by different levels of compost application Thu Ha Nguyen, Haruo Shindo* Faculty of Agriculture, Yamaguchi University, Yamaguchi, Japan; *Corresponding Author: shindo@yamaguchi-u.ac.jp Received 11 November 2010; revised 24 December 2010; accepted 7 January 2011 ABSTRACT Effect of long-term application (ca. 30 years) of compost at different levels on humus composi- tion of whole soils and their particle size frac- tions in a field subjected mainly to double cropping (barley and paddy rice) was investi- gated. Soil samples were collected from three plots of different types of management: (a) F plot, only chemical fertilizers containing N, P and K were applied; (b) F+LC plot, both chemi- cal fertilizers and a low level of compost were applied; (c) F+HC plot, both chemical fertilizers and a high level of compost were applied (the amount of compost applied in the F+HC plot was three times larger than that applied in the F+LC plot). Each soil sample was divided into coarse sand- (CSA), medium sand-(MSA) and fine sand-(FSA) sized aggregate, silt-sized ag- gregate (SIA) and clay-sized aggregate (CLA) fractions by wet-sieving and sedimentation. In addition, the CSA and MSA fractions were sub- divided into “mineral particles” (MP) and “de- cayed plants” (DP) by a density fractionation. Humus composition was influenced depending upon the level of compost applied. The applica- tion induced an increase in the amounts of total humus (TH), humic acid (HA) and fulvic acid (FA) in the whole soil and many size fractions, par- ticularly, SIA fraction. The increase was re- markable in the F+HC plot. In the CSA and MSA fractions, the amounts of TH, HA and FA were much larger in the CSA- and MSA-DP fractions than in the CSA- and MSA-MP fractions. The amounts of TH, HA and FA in the SIA fraction were larger than those in the CLA fraction for the F+HC and F+LC plots, and the reverse was true for the F plot. On the other hand, the de- grees of humification of humic acids in whole soils and many size fractions, particularly SIA fraction, decrease d by com post appli cation. The decrease w as markedly in the F+HC plot. These findings suggest that the SIA fraction play an important role in the quantitative and qualitative changes of humus, including HA and FA, as in- fluenced by a long-term compost application. Keywords: Paddy and Upland Fields; Straw-Cow Dung Compost; Humic and Fulvic Acids; Humification 1. INTRODUCTION A variety of organic amendments such as compost, farmyard manure, plant residues, food processing wastes and sewage sludge is applied to various agri- culture soils. Many researchers have reported beneficial effects of these amendments on the physical, chemical and biological properties, and fertility of soils in upland and paddy fields. However, the role of the amendments in the soils of double cropped fields (upland and paddy crops) has received little attention. Thus, the authors began to investigate the effect of continuous compost application on various properties of soils in a field subjected to long-term double cropping (paddy rice and barley). The results obtained are summarized as follows: Compost application increased (1) the activities of or- ganic C, N and P decomposing enzymes, (2) the micro- bial biomass N content and the hyphal length, (3) the degree of water-stable macroaggregation (>0.25 mm) and (4) the contents of total humus (TH) including hu- mic (HA) and fulvic (FA) acids, organic C, total N, hydrolysable carbohydrates and active Al [1-3]. Humus is one of the most important constituents of soils and it affects various soil properties as well as global C cycle. Regarding the effects of organic amend- ments on humus composition, we can find some papers. For examples, Roppongi et al. [4] reported that the in- 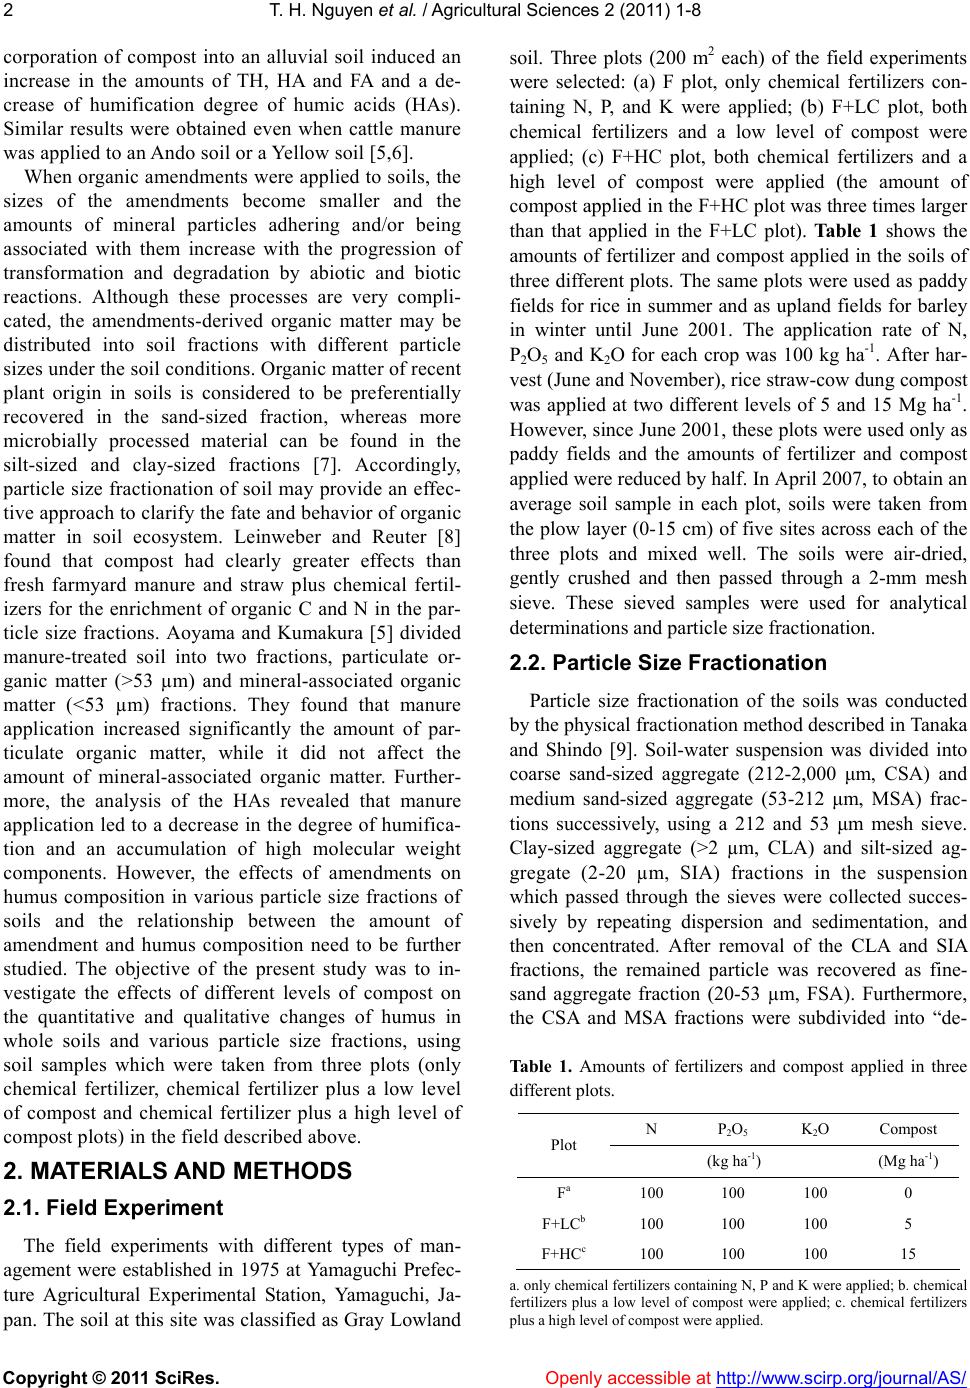 T. H. Nguyen et al. / Agricultural Sciences 2 (2011) 1-8 Copyright © 2011 SciRes. Openly accessible at http:// www.scirp.org/journal/AS/ 2 corporation of compost into an alluvial soil induced an increase in the amounts of TH, HA and FA and a de- crease of humification degree of humic acids (HAs). Similar results were obtained even when cattle manure was applied to an Ando soil or a Yellow soil [5,6]. When organic amendments were applied to soils, the sizes of the amendments become smaller and the amounts of mineral particles adhering and/or being associated with them increase with the progression of transformation and degradation by abiotic and biotic reactions. Although these processes are very compli- cated, the amendments-derived organic matter may be distributed into soil fractions with different particle sizes under the soil conditions. Organic matter of recent plant origin in soils is considered to be preferentially recovered in the sand-sized fraction, whereas more microbially processed material can be found in the silt-sized and clay-sized fractions [7]. Accordingly, particle size fractionation of soil may provide an effec- tive approach to clarify the fate and behavior of organic matter in soil ecosystem. Leinweber and Reuter [8] found that compost had clearly greater effects than fresh farmyard manure and straw plus chemical fertil- izers for the enrichment of organic C and N in the par- ticle size fractions. Aoyama and Kumakura [5] divided manure-treated soil into two fractions, particulate or- ganic matter (>53 µm) and mineral-associated organic matter (<53 µm) fractions. They found that manure application increased significantly the amount of par- ticulate organic matter, while it did not affect the amount of mineral-associated organic matter. Further- more, the analysis of the HAs revealed that manure application led to a decrease in the degree of humifica- tion and an accumulation of high molecular weight components. However, the effects of amendments on humus composition in various particle size fractions of soils and the relationship between the amount of amendment and humus composition need to be further studied. The objective of the present study was to in- vestigate the effects of different levels of compost on the quantitative and qualitative changes of humus in whole soils and various particle size fractions, using soil samples which were taken from three plots (only chemical fertilizer, chemical fertilizer plus a low level of compost and chemical fertilizer plus a high level of compost plots) in the field described above. 2. MATERIALS AND METHODS 2.1. Field Experiment The field experiments with different types of man- agement were established in 1975 at Yamaguchi Prefec- ture Agricultural Experimental Station, Yamaguchi, Ja- pan. The soil at this site was classified as Gray Lowland soil. Three plots (200 m2 each) of the field experiments were selected: (a) F plot, only chemical fertilizers con- taining N, P, and K were applied; (b) F+LC plot, both chemical fertilizers and a low level of compost were applied; (c) F+HC plot, both chemical fertilizers and a high level of compost were applied (the amount of compost applied in the F+HC plot was three times larger than that applied in the F+LC plot). Ta bl e 1 shows the amounts of fertilizer and compost applied in the soils of three different plots. The same plots were used as paddy fields for rice in summer and as upland fields for barley in winter until June 2001. The application rate of N, P2O5 and K2O for each crop was 100 kg ha-1. After har- vest (June and November), rice straw-cow dung compost was applied at two different levels of 5 and 15 Mg ha-1. However, since June 2001, these plots were used only as paddy fields and the amounts of fertilizer and compost applied were reduced by half. In April 2007, to obtain an average soil sample in each plot, soils were taken from the plow layer (0-15 cm) of five sites across each of the three plots and mixed well. The soils were air-dried, gently crushed and then passed through a 2-mm mesh sieve. These sieved samples were used for analytical determinations and particle size fractionation. 2.2. Particle Size Fractionation Particle size fractionation of the soils was conducted by the physical fractionation method described in Tanaka and Shindo [9]. Soil-water suspension was divided into coarse sand-sized aggregate (212-2,000 μm, CSA) and medium sand-sized aggregate (53-212 μm, MSA) frac- tions successively, using a 212 and 53 μm mesh sieve. Clay-sized aggregate (>2 µm, CLA) and silt-sized ag- gregate (2-20 µm, SIA) fractions in the suspension which passed through the sieves were collected succes- sively by repeating dispersion and sedimentation, and then concentrated. After removal of the CLA and SIA fractions, the remained particle was recovered as fine- sand aggregate fraction (20-53 µm, FSA). Furthermore, the CSA and MSA fractions were subdivided into “de- Table 1. Amounts of fertilizers and compost applied in three different plots. N P2O5 K 2O Compost Plot (kg ha-1) (Mg ha-1) Fa 100 100 100 0 F+LCb 100 100 100 5 F+HCc 100 100 100 15 a. only chemical fertilizers containing N, P and K were applied; b. chemical fertilizers plus a low level of compost were applied; c. chemical fertilizers plus a high level of compost were applied. 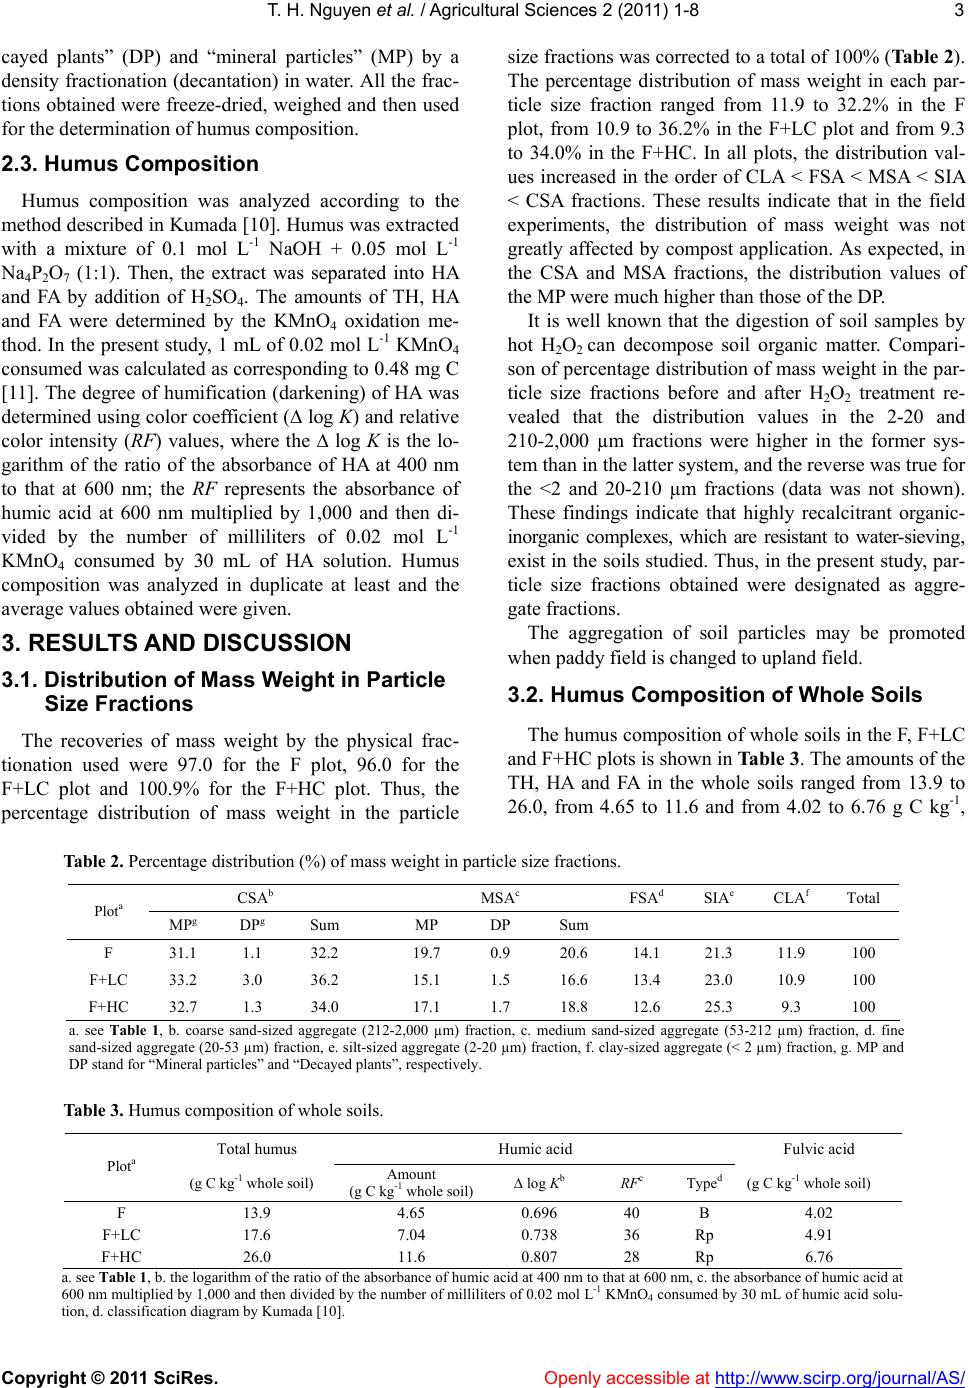 T. H. Nguyen et al. / Agricultural Sciences 2 (2011) 1-8 Copyright © 2011 SciRes. Openly accessible at http:// www.scirp.org/journal/AS/ 3 cayed plants” (DP) and “mineral particles” (MP) by a density fractionation (decantation) in water. All the frac- tions obtained were freeze-dried, weighed and then used for the determination of humus composition. 2.3. Humus Composition Humus composition was analyzed according to the method described in Kumada [10]. Humus was extracted with a mixture of 0.1 mol L-1 NaOH + 0.05 mol L-1 Na4P2O7 (1:1). Then, the extract was separated into HA and FA by addition of H2SO4. The amounts of TH, HA and FA were determined by the KMnO4 oxidation me- thod. In the present study, 1 mL of 0.02 mol L-1 KMnO4 consumed was calculated as corresponding to 0.48 mg C [11]. The degree of humification (darkening) of HA was determined using color coefficient (∆ log K) and relative color intensity (RF) values, where the ∆ log K is the lo- garithm of the ratio of the absorbance of HA at 400 nm to that at 600 nm; the RF represents the absorbance of humic acid at 600 nm multiplied by 1,000 and then di- vided by the number of milliliters of 0.02 mol L-1 KMnO4 consumed by 30 mL of HA solution. Humus composition was analyzed in duplicate at least and the average values obtained were given. 3. RESULTS AND DIS CUSSION 3.1. Distribution of Mass Weight in Particle Size Fractions The recoveries of mass weight by the physical frac- tionation used were 97.0 for the F plot, 96.0 for the F+LC plot and 100.9% for the F+HC plot. Thus, the percentage distribution of mass weight in the particle size fractions was corrected to a total of 100% (Table 2). The percentage distribution of mass weight in each par- ticle size fraction ranged from 11.9 to 32.2% in the F plot, from 10.9 to 36.2% in the F+LC plot and from 9.3 to 34.0% in the F+HC. In all plots, the distribution val- ues increased in the order of CLA < FSA < MSA < SIA < CSA fractions. These results indicate that in the field experiments, the distribution of mass weight was not greatly affected by compost application. As expected, in the CSA and MSA fractions, the distribution values of the MP were much higher than those of the DP. It is well known that the digestion of soil samples by hot H2O2 can decompose soil organic matter. Compari- son of percentage distribution of mass weight in the par- ticle size fractions before and after H2O2 treatment re- vealed that the distribution values in the 2-20 and 210-2,000 µm fractions were higher in the former sys- tem than in the latter system, and the reverse was true for the <2 and 20-210 µm fractions (data was not shown). These findings indicate that highly recalcitrant organic- inorganic complexes, which are resistant to water-sieving, exist in the soils studied. Thus, in the present study, par- ticle size fractions obtained were designated as aggre- gate fractions. The aggregation of soil particles may be promoted when paddy field is changed to upland field. 3.2. Humus Composition of Whole Soils The humus composition of whole soils in the F, F+LC and F+HC plots is shown in Table 3. The amounts of the TH, HA and FA in the whole soils ranged from 13.9 to 26.0, from 4.65 to 11.6 and from 4.02 to 6.76 g C kg-1, Table 2. Percentage distribution (%) of mass weight in particle size fractions. CSAb MSAc FSAd SIAe CLAf Total Plota MPg DPg Sum MP DP Sum F 31.1 1.1 32.2 19.7 0.9 20.6 14.1 21.3 11.9 100 F+LC 33.2 3.0 36.2 15.1 1.5 16.6 13.4 23.0 10.9 100 F+HC 32.7 1.3 34.0 17.1 1.7 18.8 12.6 25.3 9.3 100 a. see Table 1, b. coarse sand-sized aggregate (212-2,000 µm) fraction, c. medium sand-sized aggregate (53-212 µm) fraction, d. fine sand-sized aggregate (20-53 µm) fraction, e. silt-sized aggregate (2-20 µm) fraction, f. clay-sized aggregate (< 2 µm) fraction, g. MP and DP stand for “Mineral particles” and “Decayed plants”, respectively. Table 3. Humus composition of whole soils. Total humus Humic acid Fulvic acid Plota (g C kg-1 whole soil) Amount (g C kg-1 whole soil)∆ log Kb RFc Typed(g C kg-1 whole soil) F 13.9 4.65 0.696 40 B 4.02 F+LC 17.6 7.04 0.738 36 Rp 4.91 F+HC 26.0 11.6 0.807 28 Rp 6.76 a. see Tabl e 1, b. the logarithm of the ratio of the absorbance of humic acid at 400 nm to that at 600 nm, c. the absorbance of humic acid at 600 nm multiplied by 1,000 and then divided by the number of milliliters of 0.02 mol L-1 KMnO4 consumed by 30 mL of humic acid solu- tion, d. classification diagram by Kumada [10]. 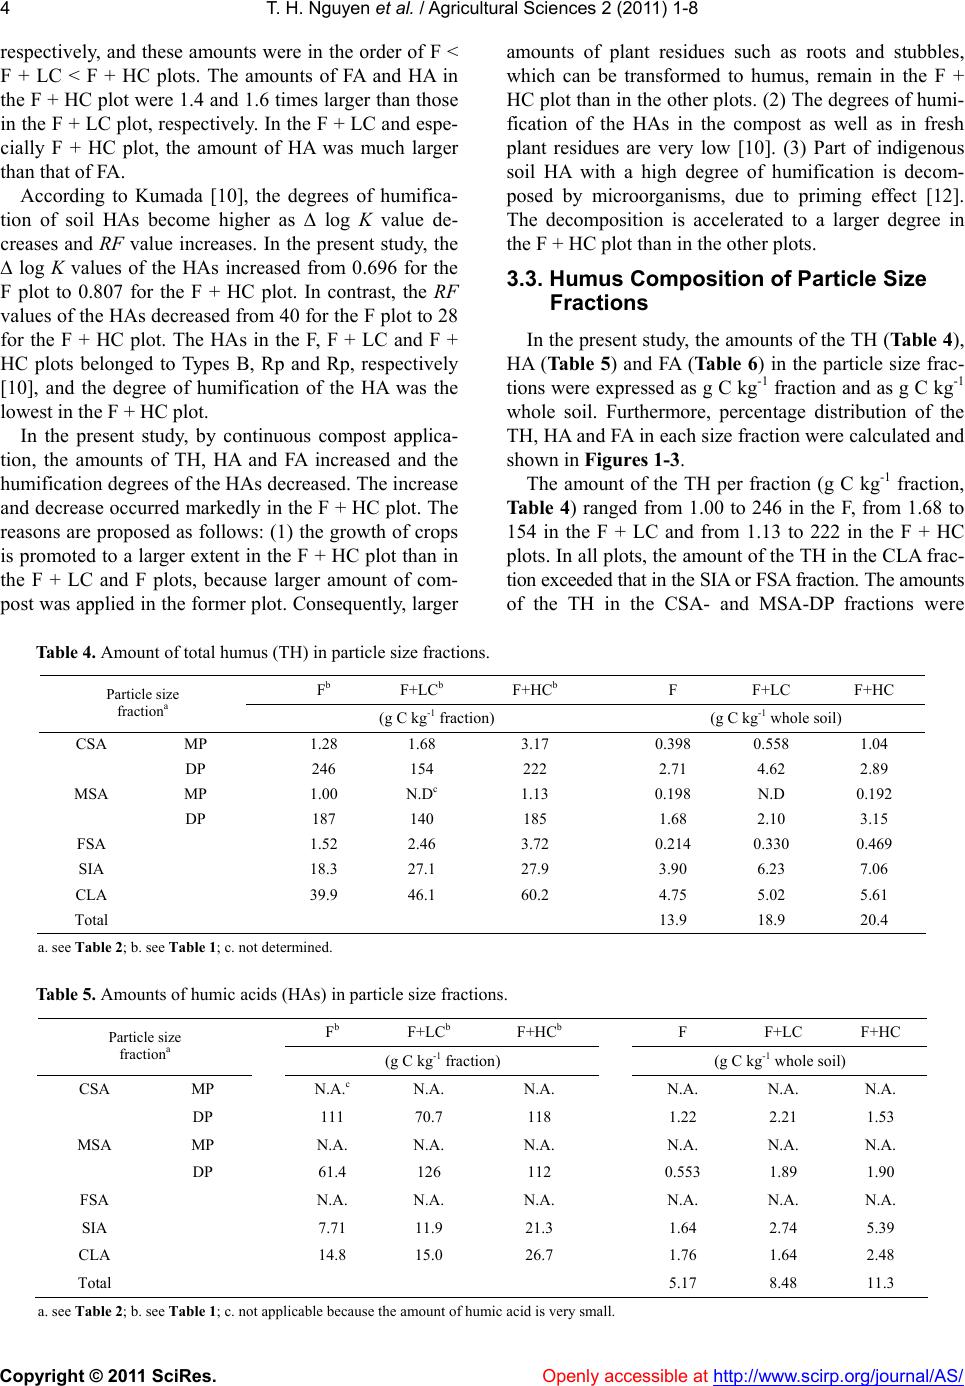 T. H. Nguyen et al. / Agricultural Sciences 2 (2011) 1-8 Copyright © 2011 SciRes. Openly accessi ble at http://www.scirp.org/journal/AS/ 4 respectively, and these amounts were in the order of F < F + LC < F + HC plots. The amounts of FA and HA in the F + HC plot were 1.4 and 1.6 times larger than those in the F + LC plot, respectively. In the F + LC and espe- cially F + HC plot, the amount of HA was much larger than that of FA. According to Kumada [10], the degrees of humifica- tion of soil HAs become higher as ∆ log K value de- creases and RF value increases. In the present study, the ∆ log K values of the HAs increased from 0.696 for the F plot to 0.807 for the F + HC plot. In contrast, the RF values of the HAs decreased from 40 for the F plot to 28 for the F + HC plot. The HAs in the F, F + LC and F + HC plots belonged to Types B, Rp and Rp, respectively [10], and the degree of humification of the HA was the lowest in the F + HC plot. In the present study, by continuous compost applica- tion, the amounts of TH, HA and FA increased and the humification degrees of the HAs decreased. The increase and decrease occurred markedly in the F + HC plot. The reasons are proposed as follows: (1) the growth of crops is promoted to a larger extent in the F + HC plot than in the F + LC and F plots, because larger amount of com- post was applied in the former plot. Consequently, larger amounts of plant residues such as roots and stubbles, which can be transformed to humus, remain in the F + HC plot than in the other plots. (2) The degrees of humi- fication of the HAs in the compost as well as in fresh plant residues are very low [10]. (3) Part of indigenous soil HA with a high degree of humification is decom- posed by microorganisms, due to priming effect [12]. The decomposition is accelerated to a larger degree in the F + HC plot than in the other plots. 3.3. Humus Composition of Particle Size Fractions In the present study, the amounts of the TH (Table 4), HA (Table 5) and FA (Table 6) in the particle size frac- tions were expressed as g C kg-1 fraction and as g C kg-1 whole soil. Furthermore, percentage distribution of the TH, HA and FA in each size fraction were calculated and shown in Figures 1-3. The amount of the TH per fraction (g C kg-1 fraction, Ta bl e 4 ) ranged from 1.00 to 246 in the F, from 1.68 to 154 in the F + LC and from 1.13 to 222 in the F + HC plots. In all plots, the amount of the TH in the CLA frac- tion exceeded that in the SIA or FSA fraction. The amounts of the TH in the CSA- and MSA-DP fractions were Table 4. Amount of total humus (TH) in particle size fractions. Fb F+LCb F+HCb F F+LC F+HC Particle size fractiona (g C kg-1 fraction) (g C kg-1 whole soil) CSA MP 1.28 1.68 3.17 0.398 0.558 1.04 DP 246 154 222 2.71 4.62 2.89 MSA MP 1.00 N.Dc 1.13 0.198 N.D 0.192 DP 187 140 185 1.68 2.10 3.15 FSA 1.52 2.46 3.72 0.214 0.330 0.469 SIA 18.3 27.1 27.9 3.90 6.23 7.06 CLA 39.9 46.1 60.2 4.75 5.02 5.61 Total 13.9 18.9 20.4 a. see Table 2; b. see Table 1; c. not determined. Table 5. Amounts of humic acids (HAs) in particle size fractions. Fb F+LCb F+HCb F F+LC F+HC Particle size fractiona (g C kg-1 fraction) (g C kg-1 whole soil) CSA MP N.A.c N.A. N.A. N.A. N.A. N.A. DP 111 70.7 118 1.22 2.21 1.53 MSA MP N.A. N.A. N.A. N.A. N.A. N.A. DP 61.4 126 112 0.553 1.89 1.90 FSA N.A. N.A. N.A. N.A. N.A. N.A. SIA 7.71 11.9 21.3 1.64 2.74 5.39 CLA 14.8 15.0 26.7 1.76 1.64 2.48 Total 5.17 8.48 11.3 a. see Table 2; b. see Table 1; c. not applicable because the amount of humic acid is very small. 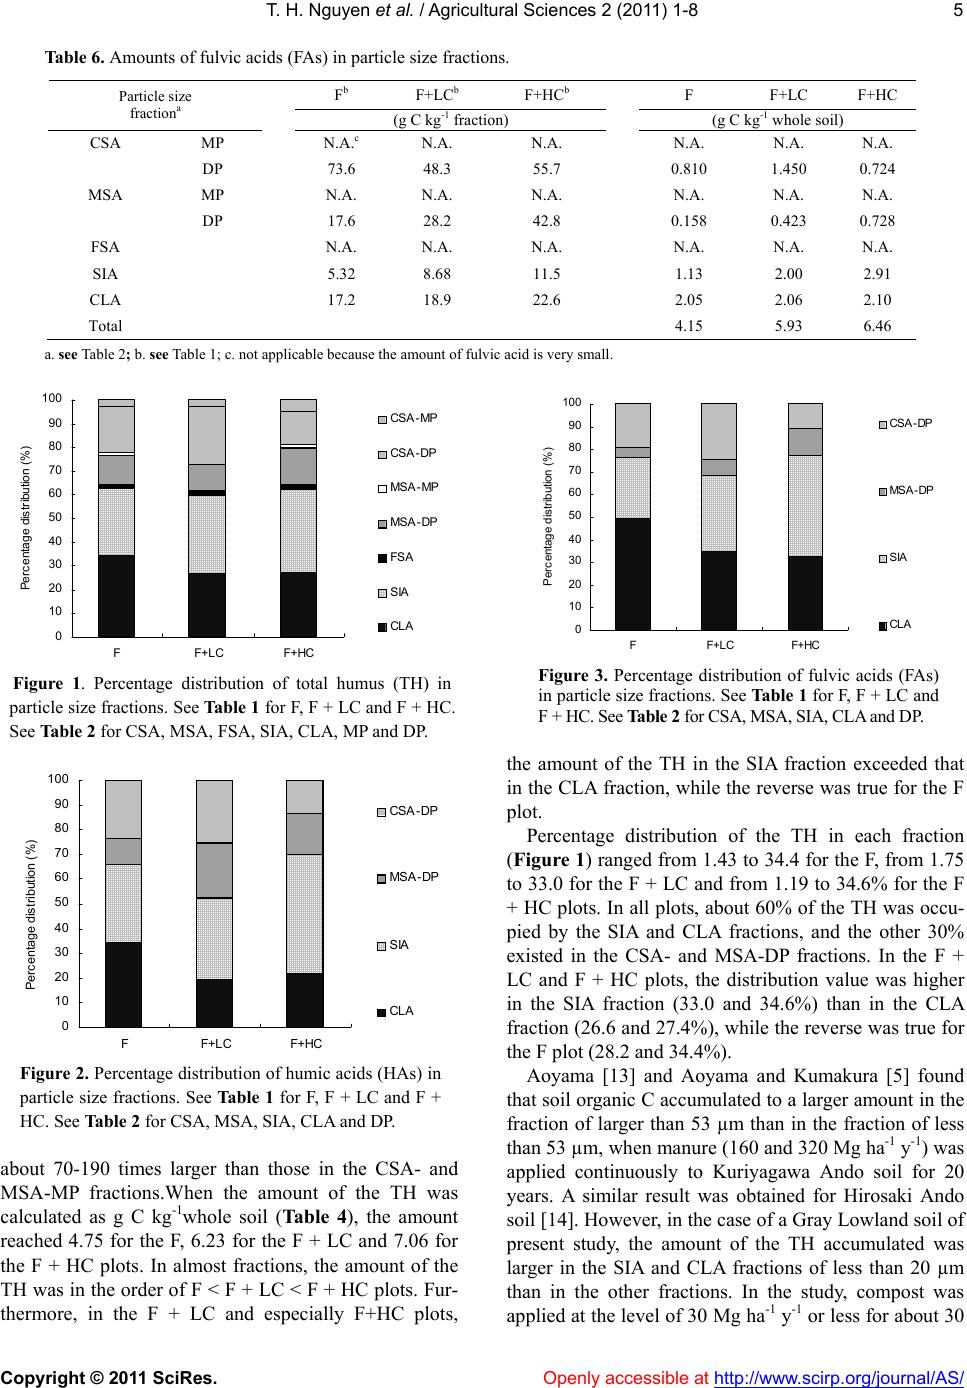 T. H. Nguyen et al. / Agricultural Sciences 2 (2011) 1-8 Copyright © 2011 SciRes. Openly accessi ble at http://www.scirp.org/journal/AS/ 5 Table 6. Amounts of fulvic acids (FAs) in particle size fractions. F b F+LCb F+HCb F F+LC F+HC Particle size fractiona (g C kg-1 fraction) (g C kg-1 whole soil) CSA MP N.A.c N.A. N.A. N.A. N.A. N.A. DP 73.6 48.3 55.7 0.810 1.450 0.724 MSA MP N.A. N.A. N.A. N.A. N.A. N.A. DP 17.6 28.2 42.8 0.158 0.423 0.728 FSA N.A. N.A. N.A. N.A. N.A. N.A. SIA 5.32 8.68 11.5 1.13 2.00 2.91 CLA 17.2 18.9 22.6 2.05 2.06 2.10 Total 4.15 5.93 6.46 a. see Table 2; b. see Table 1; c. not applicable because the amount of fulvic acid is very small. 0 10 20 30 40 50 60 70 80 90 100 FF+LC F+HC Percentage distributi on (%) CS A-MP CS A-DP MSA-MP MSA-DP FSA SIA CL A Figure 1. Percentage distribution of total humus (TH) in particle size fractions. See Table 1 for F, F + LC and F + HC. See Table 2 for CSA, MSA, FSA, SIA, CLA, MP and DP. 0 10 20 30 40 50 60 70 80 90 100 FF+LCF+HC Percentage distributi on (%) CS A-DP MSA-DP SIA CL A Figure 2. Percentage distribution of humic acids (HAs) in particle size fractions. See Table 1 for F, F + LC and F + HC. See Table 2 for CSA, MSA, SIA, CLA and DP. about 70-190 times larger than those in the CSA- and MSA-MP fractions.When the amount of the TH was calculated as g C kg-1whole soil (Tab le 4), the amount reached 4.75 for the F, 6.23 for the F + LC and 7.06 for the F + HC plots. In almost fractions, the amount of the TH was in the order of F < F + LC < F + HC plots. Fur- thermore, in the F + LC and especially F+HC plots, 0 10 20 30 40 50 60 70 80 90 100 FF+LCF+HC Percentage distribution (%) CSA-DP MSA-DP SIA CLA Figure 3. Percentage distribution of fulvic acids (FAs) in particle size fractions. See Table 1 for F, F + LC and F + HC. See Table 2 for CSA, MSA, SIA, CLA and DP. the amount of the TH in the SIA fraction exceeded that in the CLA fraction, while the reverse was true for the F plot. Percentage distribution of the TH in each fraction (Figure 1) ranged from 1.43 to 34.4 for the F, from 1.75 to 33.0 for the F + LC and from 1.19 to 34.6% for the F + HC plots. In all plots, about 60% of the TH was occu- pied by the SIA and CLA fractions, and the other 30% existed in the CSA- and MSA-DP fractions. In the F + LC and F + HC plots, the distribution value was higher in the SIA fraction (33.0 and 34.6%) than in the CLA fraction (26.6 and 27.4%), while the reverse was true for the F plot (28.2 and 34.4%). Aoyama [13] and Aoyama and Kumakura [5] found that soil organic C accumulated to a larger amount in the fraction of larger than 53 µm than in the fraction of less than 53 µm, when manure (160 and 320 Mg ha-1 y-1) was applied continuously to Kuriyagawa Ando soil for 20 years. A similar result was obtained for Hirosaki Ando soil [14]. However, in the case of a Gray Lowland soil of present study, the amount of the TH accumulated was larger in the SIA and CLA fractions of less than 20 µm than in the other fractions. In the study, compost was applied at the level of 30 Mg ha-1 y-1 or less for about 30 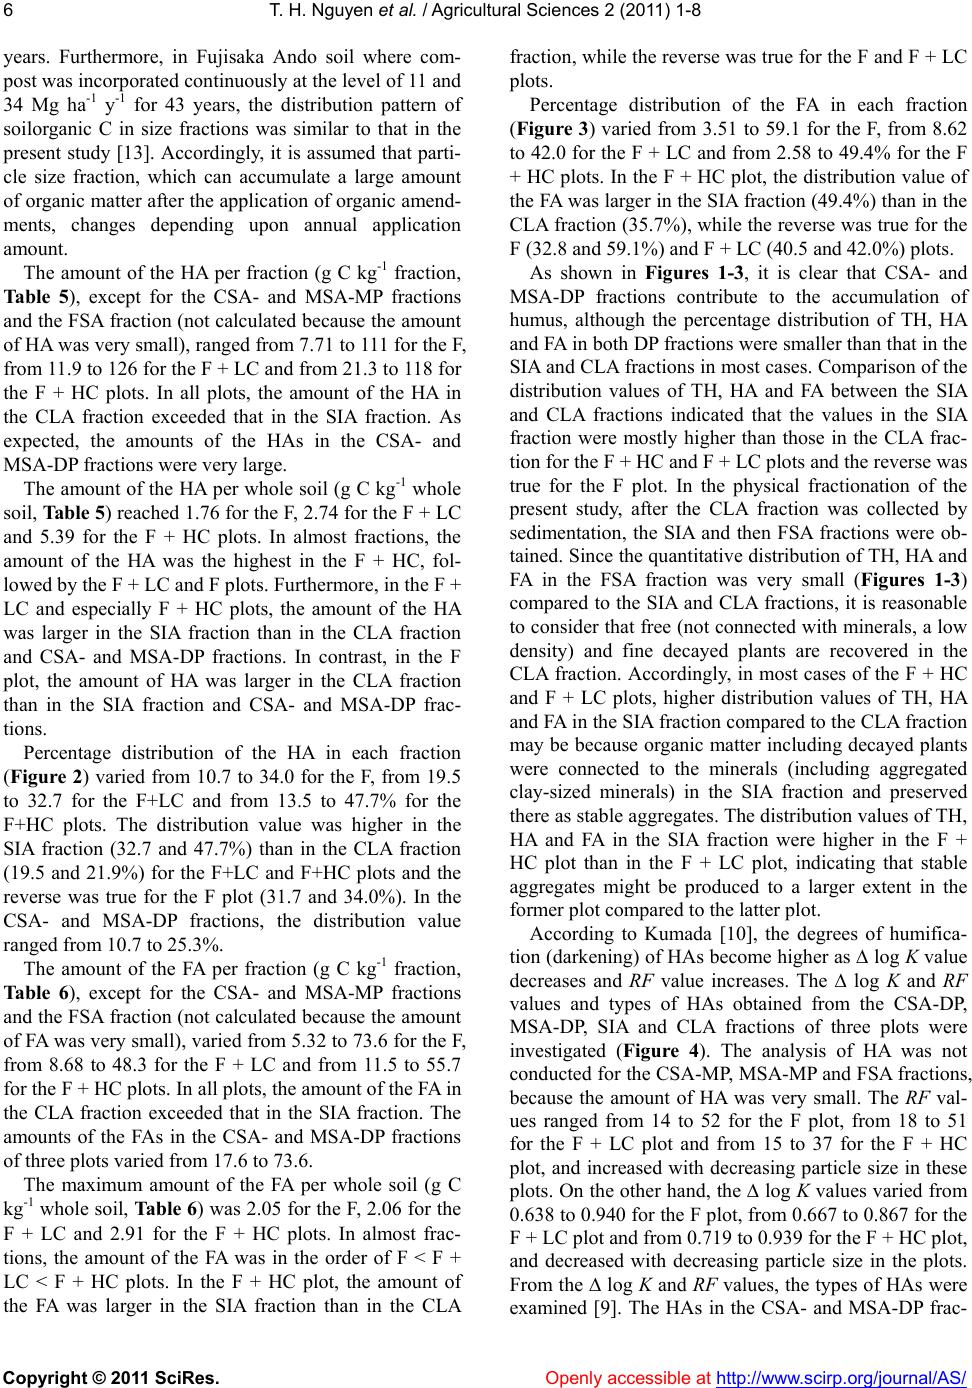 T. H. Nguyen et al. / Agricultural Sciences 2 (2011) 1-8 Copyright © 2011 SciRes. Openly accessi ble at http://www.scirp.org/journal/AS/ 6 years. Furthermore, in Fujisaka Ando soil where com- post was incorporated continuously at the level of 11 and 34 Mg ha-1 y -1 for 43 years, the distribution pattern of soilorganic C in size fractions was similar to that in the present study [13]. Accordingly, it is assumed that parti- cle size fraction, which can accumulate a large amount of organic matter after the application of organic amend- ments, changes depending upon annual application amount. The amount of the HA per fraction (g C kg-1 fraction, Table 5), except for the CSA- and MSA-MP fractions and the FSA fraction (not calculated because the amount of HA was very small), ranged from 7.71 to 111 for the F, from 11.9 to 126 for the F + LC and from 21.3 to 118 for the F + HC plots. In all plots, the amount of the HA in the CLA fraction exceeded that in the SIA fraction. As expected, the amounts of the HAs in the CSA- and MSA-DP fractions were very large. The amount of the HA per whole soil (g C kg-1 whole soil, Table 5) reached 1.76 for the F, 2.74 for the F + LC and 5.39 for the F + HC plots. In almost fractions, the amount of the HA was the highest in the F + HC, fol- lowed by the F + LC and F plots. Furthermore, in the F + LC and especially F + HC plots, the amount of the HA was larger in the SIA fraction than in the CLA fraction and CSA- and MSA-DP fractions. In contrast, in the F plot, the amount of HA was larger in the CLA fraction than in the SIA fraction and CSA- and MSA-DP frac- tions. Percentage distribution of the HA in each fraction (Figure 2) varied from 10.7 to 34.0 for the F, from 19.5 to 32.7 for the F+LC and from 13.5 to 47.7% for the F+HC plots. The distribution value was higher in the SIA fraction (32.7 and 47.7%) than in the CLA fraction (19.5 and 21.9%) for the F+LC and F+HC plots and the reverse was true for the F plot (31.7 and 34.0%). In the CSA- and MSA-DP fractions, the distribution value ranged from 10.7 to 25.3%. The amount of the FA per fraction (g C kg-1 fraction, Table 6), except for the CSA- and MSA-MP fractions and the FSA fraction (not calculated because the amount of FA was very small), varied from 5.32 to 73.6 for the F, from 8.68 to 48.3 for the F + LC and from 11.5 to 55.7 for the F + HC plots. In all plots, the amount of the FA in the CLA fraction exceeded that in the SIA fraction. The amounts of the FAs in the CSA- and MSA-DP fractions of three plots varied from 17.6 to 73.6. The maximum amount of the FA per whole soil (g C kg-1 whole soil, Table 6) was 2.05 for the F, 2.06 for the F + LC and 2.91 for the F + HC plots. In almost frac- tions, the amount of the FA was in the order of F < F + LC < F + HC plots. In the F + HC plot, the amount of the FA was larger in the SIA fraction than in the CLA fraction, while the reverse was true for the F and F + LC plots. Percentage distribution of the FA in each fraction (Figure 3) varied from 3.51 to 59.1 for the F, from 8.62 to 42.0 for the F + LC and from 2.58 to 49.4% for the F + HC plots. In the F + HC plot, the distribution value of the FA was larger in the SIA fraction (49.4%) than in the CLA fraction (35.7%), while the reverse was true for the F (32.8 and 59.1%) and F + LC (40.5 and 42.0%) plots. As shown in Figures 1-3, it is clear that CSA- and MSA-DP fractions contribute to the accumulation of humus, although the percentage distribution of TH, HA and FA in both DP fractions were smaller than that in the SIA and CLA fractions in most cases. Comparison of the distribution values of TH, HA and FA between the SIA and CLA fractions indicated that the values in the SIA fraction were mostly higher than those in the CLA frac- tion for the F + HC and F + LC plots and the reverse was true for the F plot. In the physical fractionation of the present study, after the CLA fraction was collected by sedimentation, the SIA and then FSA fractions were ob- tained. Since the quantitative distribution of TH, HA and FA in the FSA fraction was very small (Figures 1-3) compared to the SIA and CLA fractions, it is reasonable to consider that free (not connected with minerals, a low density) and fine decayed plants are recovered in the CLA fraction. Accordingly, in most cases of the F + HC and F + LC plots, higher distribution values of TH, HA and FA in the SIA fraction compared to the CLA fraction may be because organic matter including decayed plants were connected to the minerals (including aggregated clay-sized minerals) in the SIA fraction and preserved there as stable aggregates. The distribution values of TH, HA and FA in the SIA fraction were higher in the F + HC plot than in the F + LC plot, indicating that stable aggregates might be produced to a larger extent in the former plot compared to the latter plot. According to Kumada [10], the degrees of humifica- tion (darkening) of HAs become higher as ∆ log K value decreases and RF value increases. The ∆ log K and RF values and types of HAs obtained from the CSA-DP, MSA-DP, SIA and CLA fractions of three plots were investigated (Figure 4). The analysis of HA was not conducted for the CSA-MP, MSA-MP and FSA fractions, because the amount of HA was very small. The RF val- ues ranged from 14 to 52 for the F plot, from 18 to 51 for the F + LC plot and from 15 to 37 for the F + HC plot, and increased with decreasing particle size in these plots. On the other hand, the ∆ log K values varied from 0.638 to 0.940 for the F plot, from 0.667 to 0.867 for the F + LC plot and from 0.719 to 0.939 for the F + HC plot, and decreased with decreasing particle size in the plots. From the ∆ log K and RF values, the types of HAs were examined [9]. The HAs in the CSA- and MSA-DP frac- 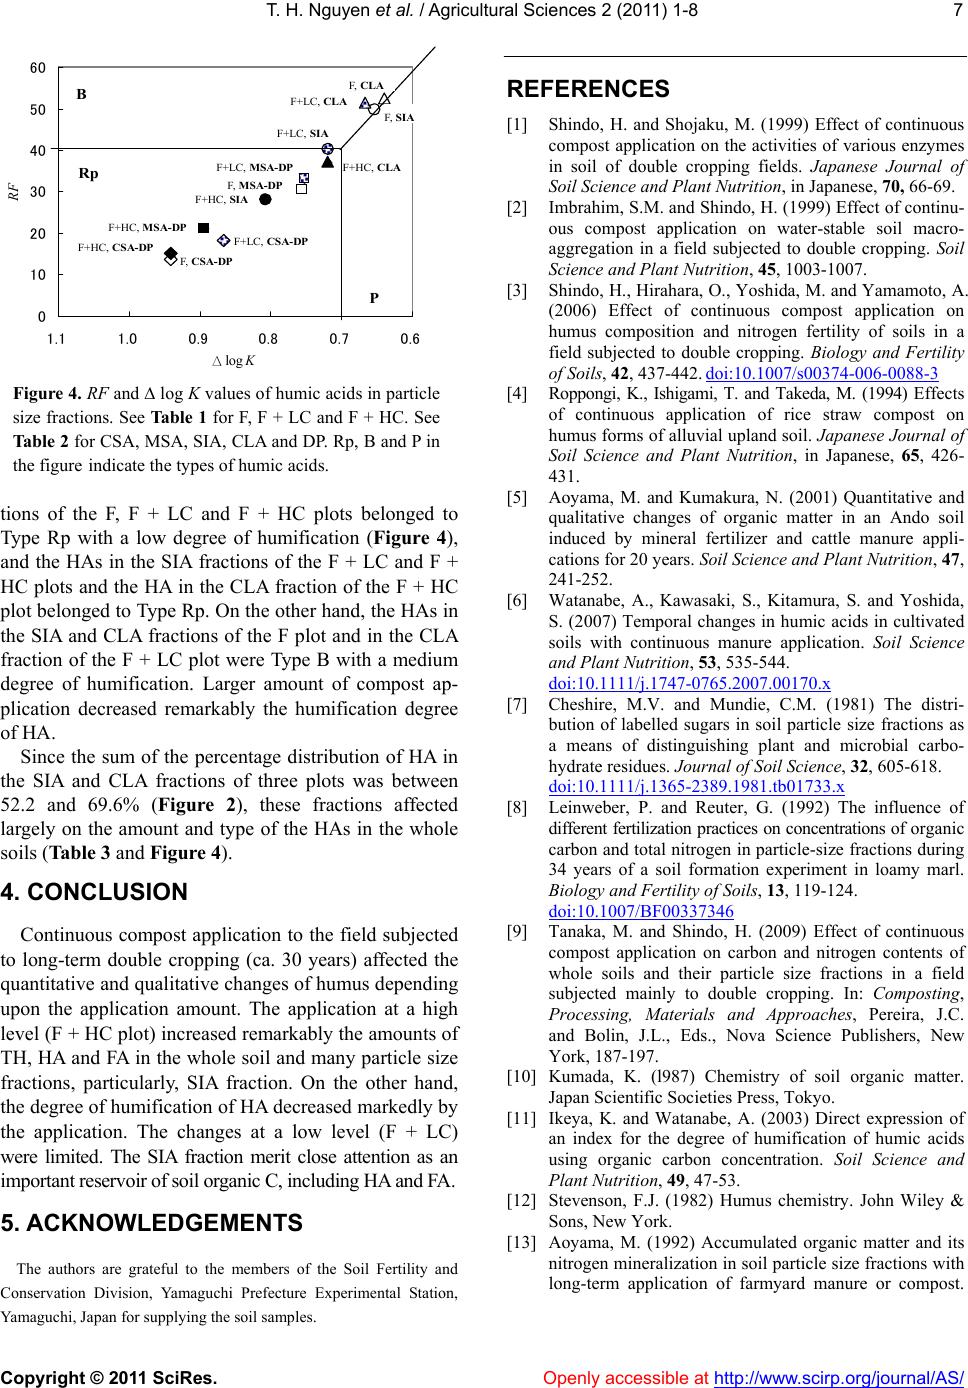 T. H. Nguyen et al. / Agricultural Sciences 2 (2011) 1-8 Copyright © 2011 SciRes. Openly accessi ble at http://www.scirp.org/journal/AS/ 7 0 10 20 30 40 50 60 0.60.70.80.91.01.1 ∆ log K RF B P Rp F+HC , CLA F+HC , SIA F+HC , MSA-DP F+HC , CSA-DP F+LC, CLA F+LC , SIA F+LC , MSA-DP F+LC , CSA-DP F , MS A-DP F, SI A F , CLA F , CSA-DP Figure 4. RF and ∆ log K values of humic acids in particle size fractions. See Table 1 for F, F + LC and F + HC. See Table 2 for CSA, MSA, SIA, CLA and DP. Rp, B and P in the figure indicate the types of humic acids. tions of the F, F + LC and F + HC plots belonged to Type Rp with a low degree of humification (Figure 4), and the HAs in the SIA fractions of the F + LC and F + HC plots and the HA in the CLA fraction of the F + HC plot belonged to Type Rp. On the other hand, the HAs in the SIA and CLA fractions of the F plot and in the CLA fraction of the F + LC plot were Type B with a medium degree of humification. Larger amount of compost ap- plication decreased remarkably the humification degree of HA. Since the sum of the percentage distribution of HA in the SIA and CLA fractions of three plots was between 52.2 and 69.6% (Figure 2), these fractions affected largely on the amount and type of the HAs in the whole soils (Table 3 and Figure 4). 4. CONCLUSION Continuous compost application to the field subjected to long-term double cropping (ca. 30 years) affected the quantitative and qualitative changes of humus depending upon the application amount. The application at a high level (F + HC plot) increased remarkably the amounts of TH, HA and FA in the whole soil and many particle size fractions, particularly, SIA fraction. On the other hand, the degree of humification of HA decreased markedly by the application. The changes at a low level (F + LC) were limited. The SIA fraction merit close attention as an important reservoir of soil organic C, including HA and FA. 5. ACKNOWLEDGEMENTS The authors are grateful to the members of the Soil Fertility and Conservation Division, Yamaguchi Prefecture Experimental Station, Yamaguchi, Japan for supplying the soil samples. REFERENCES [1] Shindo, H. and Shojaku, M. (1999) Effect of continuous compost application on the activities of various enzymes in soil of double cropping fields. Japanese Journal of Soil Science and Plant Nutrition, in Japanese, 70, 66-69. [2] Imbrahim, S.M. and Shindo, H. (1999) Effect of continu- ous compost application on water-stable soil macro- aggregation in a field subjected to double cropping. Soil Science and Plant Nutrition, 45, 1003-1007. [3] Shindo, H., Hirahara, O., Yoshida, M. and Yamamoto, A. (2006) Effect of continuous compost application on humus composition and nitrogen fertility of soils in a field subjected to double cropping. Biology and Fertility of Soils, 42, 437-442. doi:10.1007/s00374-006-0088-3 [4] Roppongi, K., Ishigami, T. and Takeda, M. (1994) Effects of continuous application of rice straw compost on humus forms of alluvial upland soil. Japanese Journal of Soil Science and Plant Nutrition, in Japanese, 65, 426- 431. [5] Aoyama, M. and Kumakura, N. (2001) Quantitative and qualitative changes of organic matter in an Ando soil induced by mineral fertilizer and cattle manure appli- cations for 20 years. Soil Science and Plant Nutrition, 47, 241-252. [6] Watanabe, A., Kawasaki, S., Kitamura, S. and Yoshida, S. (2007) Temporal changes in humic acids in cultivated soils with continuous manure application. Soil Science and Plant Nutrition, 53, 535-544. doi:10.1111/j.1747-0765.2007.00170.x [7] Cheshire, M.V. and Mundie, C.M. (1981) The distri- bution of labelled sugars in soil particle size fractions as a means of distinguishing plant and microbial carbo- hydrate residues. Journal of Soil Science, 32, 605-618. doi:10.1111/j.1365-2389.1981.tb01733.x [8] Leinweber, P. and Reuter, G. (1992) The influence of different fertilization practices on concentrations of organic carbon and total nitrogen in particle-size fractions during 34 years of a soil formation experiment in loamy marl. Biology and Fertility of Soils, 13, 119-124. doi:10.1007/BF00337346 [9] Tanaka, M. and Shindo, H. (2009) Effect of continuous compost application on carbon and nitrogen contents of whole soils and their particle size fractions in a field subjected mainly to double cropping. In: Composting, Processing, Materials and Approaches, Pereira, J.C. and Bolin, J.L., Eds., Nova Science Publishers, New York, 187-197. [10] Kumada, K. (l987) Chemistry of soil organic matter. Japan Scientific Societies Press, Tokyo. [11] Ikeya, K. and Watanabe, A. (2003) Direct expression of an index for the degree of humification of humic acids using organic carbon concentration. Soil Science and Plant Nutrition, 49, 47-53. [12] Stevenson, F.J. (1982) Humus chemistry. John Wiley & Sons, New York. [13] Aoyama, M. (1992) Accumulated organic matter and its nitrogen mineralization in soil particle size fractions with long-term application of farmyard manure or compost.  T. H. Nguyen et al. / Agricultural Sciences 2 (2011) 1-8 Copyright © 2011 SciRes. Openly accessi ble at http://www.scirp.org/journal/AS/ 8 Japanese Journal of Soil Science and Plant Nutrition, in Japanese, 63, 161-168. [14] Aoyama, M. and Taninai, Y. (1992) Organic matter and its mineralization in particle size and aggregate size fractions of soils with four-year application of farmyard manure. Japanese Journal of Soil Science and Plant Nutrition, in Japanese, 63, 571-580. |

