T. K. SEN, C. KHOO
2
ion concentration, adsorbent dosages and temperature
changes on adsorption characteristics of natural bentonite
and kaolin. It is also essential to understand the mecha-
nism and kinetics of adsorption, because the studies of
adsorption kinetics and mechanism are ultimately a pre-
requisite for designing an adsorption column [3]. An-
other reason for this study is the importance of adsorp-
tion on solid surfaces in many industrial applications in
order to improve efficiency and economy. The kinetic
adsorption results have been analysed using both pseudo-
first-order and pseudo-second-order kinetics models. The
mechanism of the adsorption process has been explained
based on intra-particle diffusion model. The isotherm
equilibrium results are better fitted with Langmuir model.
Finally thermodynamic parameters are determined at
three different temperatures and it has been found that
the adsorption process is exothermic due to negative ∆H0
accompanied by decrease in entropy change and Gibbs
free energy change (∆G0).
2. Materials and Methods
2.1. Chemicals
All chemicals used were of analytical grade. Stock
standard solution of Zn2+ has been prepared by dissolving
the appropriate amount of its nitrate salt in deionised
water, acidified with small amount of nitric acid. This
stock solution was then diluting to specified concen-
trations. Kaolin BET surface area of 15.72 m2/g, mean
particle size of 17.94 μm) was obtained from Chem-
Supply pty Ltd, Perth WA. Bentonite (BET surface area
of 238.47 m2/g and mean particle size of 7.49 μm) was
obtained from Bronson & Jacobs Pty Ltd Australia. All
plastic sample bottles and glassware were cleaned, then
rinsed with deionised water and dried at 60˚C in a tem-
perature controlled oven. All measurements were con-
ducted at the room temperature (28 2, ℃). The con-
centration of Zn2+ was measured using a double beam
flame atomic absorption spectrophotometer. Sizes of
particles were measured by Malvern Master Seizer, Ver
1.2, UK. The pH was measured by Orion pH meter.
2.2. Adsorption Procedure
Adsorption measurements were determined by batch
experiments of known amount of the sample with 40 mL
of aqueous Zn2+ solutions as per Aries & Sen [3] in a
series of 60 ml plastic bottles. The mixture were shaken
in a constant temperature orbital shaker at 120 rpm at 30
℃ for a given time and then the suspensions were fil-
tered through a What man glass micro filter and the fil-
trates were analyzed using flame atomic absorption spec-
trophotometer with an air-acetylene flame. The experi-
ments were carried out by varying concentration of initial
Zn2+ solution, contact time, amount of adsorbent and
temperature of the system. Adsorption mechanisms were
studied according to predefined procedure with the Zn2+
concentration ranging from 1.0 to 40 mg /L. The Zn2+
concentration retained in the adsorbent phase was calcu-
lated according to Equation (1)
()
0
CCV
t
qtm
(1)
where C0 (mg/L) and Ct (mg/L) are the concentration in
the solution at time t = 0 and at time t, V is the volume of
solution (L) and m is the amount of adsorbent (g) added.
The kinetics of adsorption of Zn (II) was carried out at
low and high initial metal ion concentration using the
same adsorption procedure started above. The only diffe-
rence was that samples were collected and analyzed at
regular time intervals during the adsorption process.
The transient behavior of the Zn (II) adsorption proc-
ess was analyzed using two adsorption kinetic models;
pseudo first and pseudo-second-order rate models. The
rate constant of adsorption was determined from the
pseudo-first-order rate model [10] as
1
log ()log2.303
et e
K
qq qt (2)
where qt and qe represents the amount of metal ion ad-
sorbed (mg/g) at any time t and at equilibrium time re-
spectively and K1 represents the adsorption first-order
rate constant (min−1). Plot of Log (qe − qt) versus t gives
a straight line for pseudo first-order adsorption kinetics
which allow computation of the rate constant K1.
The pseudo-second-order model [3,10] based on equi-
librium adsorption is expressed as:
11
2
2
tt
qq
Kq e
te
(3)
A plot between t/qt versus t gives the value of the con-
stants K2 (g/mg h) and also qe (mg/g) can be calculated.
The Constant K2 is used to calculate the initial sorption
rate h, at t → 0, as follows
2
2e
hKq (4)
Thus the rate constant K2, initial adsorption rate h and
predicted qe can be calculated from the plot of t/q versus
time t using Equation (3).
According to Weber & Morris (1963) [11] the intra-
particle diffusion model for most the uptake varies al-
most proportionately with t1/2 rather than with the contact
time and can be represented as follows:
0.5
tid
qK t (5)
where qt is the amount adsorbed at time t and t0.5 is the
square root of the time and Kid (mg/g.min0.5) is the rate
constant of intraparticle diffusion. When intra-particle
diffusion plays a significant role in controlling the kinet-
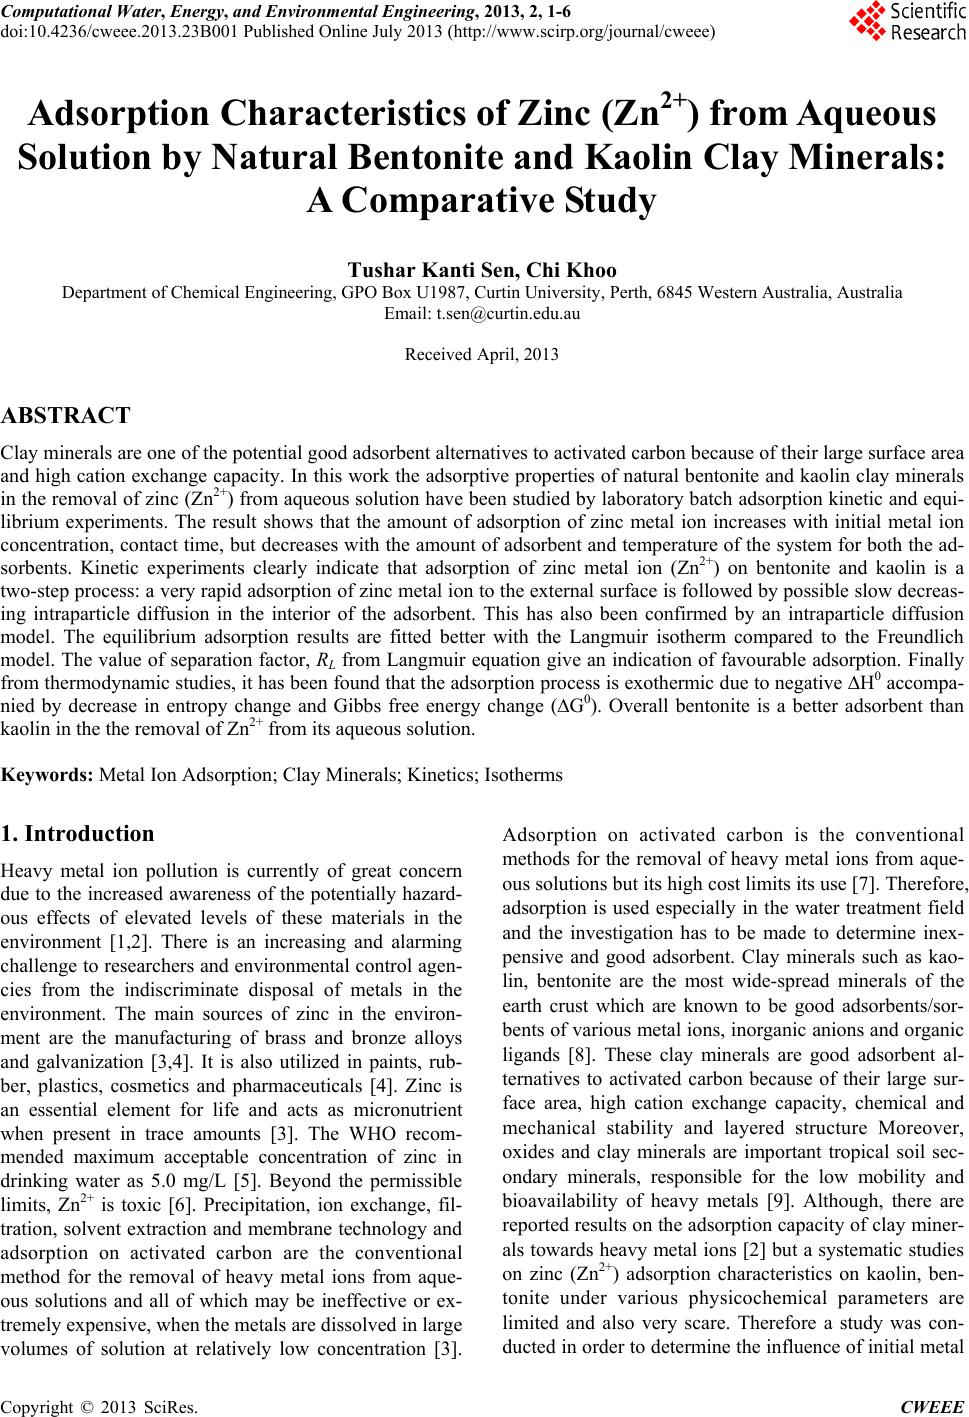
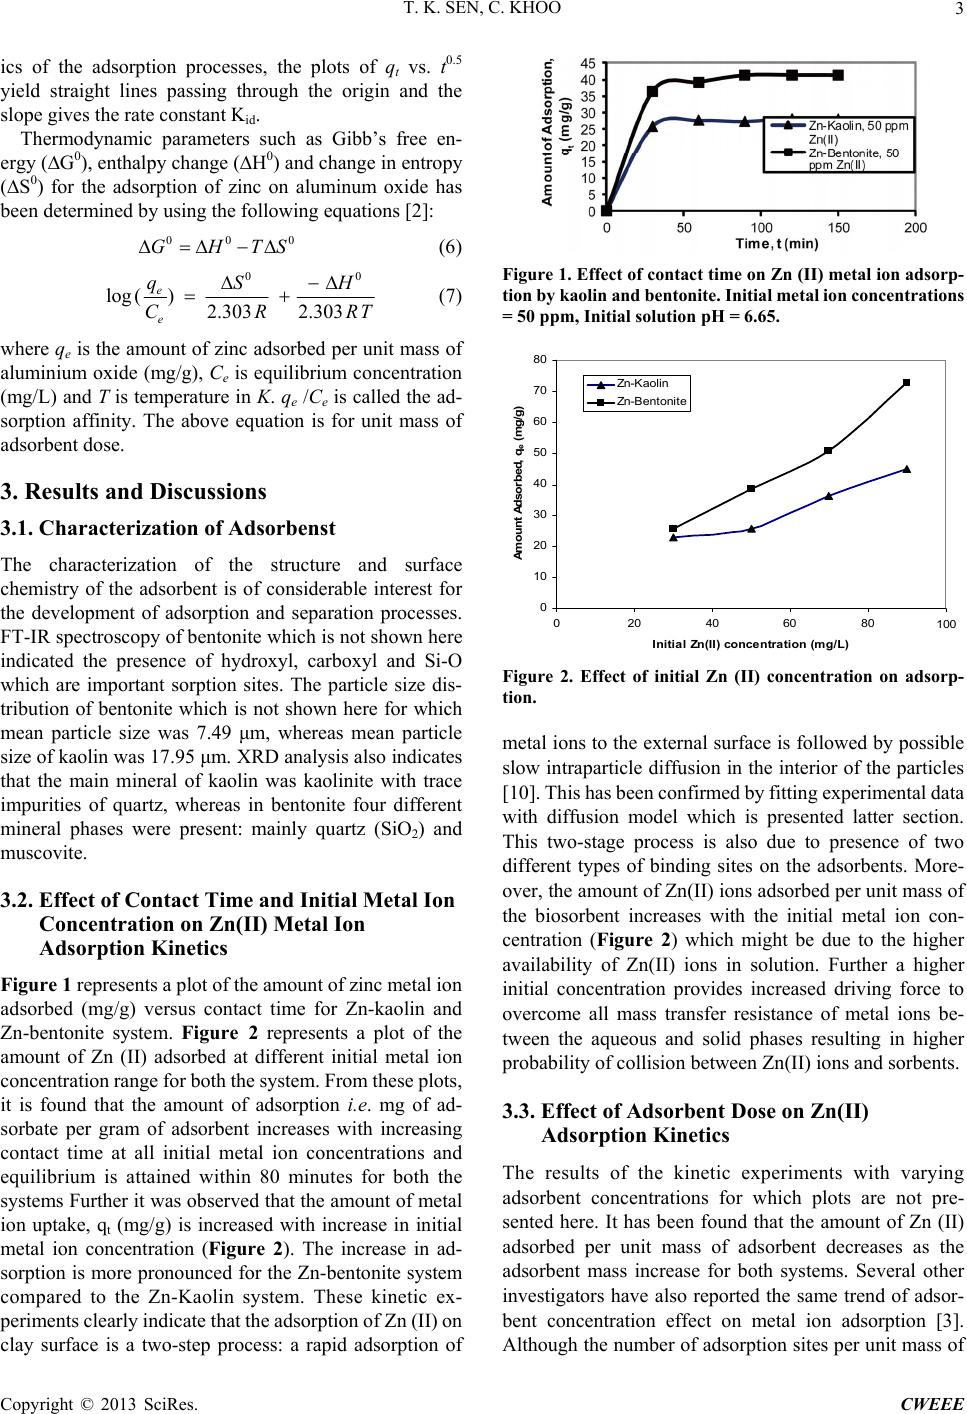
Copyright © 2013 SciRes. CWEEE