Engineering, 2013, 5, 42-46
http://dx.doi.org/10.4236/eng.2013.510B009 Published Online October 2013 (http://www.scirp.org/journal/eng)
Copyright © 2013 SciRes. ENG
Indoor Air Quality Study on Fiber Glass Industry
Amir Alhaddad, Baderiya Al-Abdulmohsin
Chemical Engineering Department, Kuwait University, Kuwait City, Kuwait
Email: a mir.alhaddad@ku.e du.kw, bsalah@alghanim.com
Received October 2012
ABSTRACT
The most hazardous chemical used in fiber glass industry are: formaldehyde, ph enol and ammonia. The chemicals were
monitored in an industry in Kuwait to investigate the indoor air quality of the facility. It was found that all these chemi-
cals were within the OSHA standards but formaldehyde exceeded KEPA standards (0.1 ppm) in the curing area. It was
found that lower density of fiber glass product leads to higher concentration of pollutants in the atmosphere and vise
versa. Moreover, higher thickness causes higher concentration of pollutants in the atmosphere.
Keywords: Indoor Air Quality; Fiber Gl a ss In d us t ry; Hazardous Pollutants
1. Introduction
Indoor air quality (IAQ) is defined as the nature of air
that affects the health and well-being of occupants. It
differs from industrial ind icators of acceptability, such as
threshold limit values, as the latter primarily reflect con-
cern for control of potential hazards. A more technical
definition of IAQ is related to how well indoor air satis-
fies the three basic requirements for human occupancy
which are thermal acceptability, maintenance of normal
concentrations of respiratory gases; and dilution and re-
moval of contaminants to levels below health or odour
discomfort thresholds. The following is a brief review of
recent studies related to indoor air quality conducted in
Kuwait and around the world. Yassin et al. [4] meas-
ured concentrations of PM2.5 at indoor settings in several
houses with various residential mediums in Kuwait. Data
were collected by using a Dust-Trak personal sampler
over 24 hours. The places included kitchen, living room,
and bedrooms in all studied houses. It was found that the
concentrations of PM2.5 were higher than the EPA daily
NAAQS in the kitchen and living rooms where the lower
concentrations were recorded in the bedrooms. These
results reflect bad effect on human health in Kuwait in
compared with houses in the United States, the United
Kingdom and Greece. Al-Rashidi et al. [2] investigated
the impact of ventilation modes on carbon dioxide con-
centrations in Kuwait classrooms. The levels of CO2
were measured during natural and air conditioned venti-
lation modes. The study conducted inside 10 elementary-
level classrooms for children in the 6 - 10 years age in
three schools. The obtained data showed that the concen-
trations of CO2 with air conditioned operation were
higher than concentrations during natural ventilation. The
concentrations of CO2 exceeded the recommended stan-
dards that some strategies and arrangements should be
taken to reduce the CO2 levels to allowable limits. Boh-
landt et al. [1] measured concentrations of the trace met-
als cerium (Ce), anthanum (La) and cadmium (Cd) in
indoor air with high Environmental tobacco smoke load.
The samples were collected in 3 smokers and 7 nonsmo-
kers’ households in addition to 28 hospitals in Southern
Germany. Data was conducted continuously for seven
days in every season in th e houses and for 4 hours during
the main visiting hours in the hospitals. Analysis of all
measured values showed that high concentrations of Ce
and La were found in smokers’ households and hospitals
which were above the international indoor air quality
standards. Fiedoruk [3] examined indoor air quality in-
side the cabin of an airplane occupied 150 passengers on
board. The concentration of CO2, air temperature, pres-
sure and humidity were measured during the flight that
lasted three hours. Results showed that the concentration
of CO 2 was higher than international standards. Penpatra
et al. [5] studied the effects of exposure to glass microfi-
bers on respiratory and skin symptoms, asthma and lung
functions. The study included 102 workers from four
microfiber factories in Thailand. The workers answered
questionnaire on respiratory health, occupational expo-
sures and life style factors and performed spirometry.
The dust concentrations were monitored in the air of
factories during 2004 and 2005 by the gravimetric analy-
sis method (NIOSH method 0600). Results showed that
exposure to glass microfibers increase the risk of the res-
piratory and skin symptoms. On the other hand, exposure
to sensitizing chemicals increased the risk of cough and
nasal symptoms. Sait et al. [6] assessed health risks of
A. ALHADDAD, B. AL-ABDULMOHSIN
Copyright © 2013 SciRes. ENG
43
volatile organic compounds in three primary schools in
Izmi r, Turkey. Primary schools accommodate children
aged 7 - 14 for about 5 - 8 hours daily. Concentrations of
VOCs were measured in spring, winter, and fall terms. A
thermal desorptionGC-MS system was used to analyze
VOCs where Formaldehyde analysis was performed us-
ing an HPLC instrument. A health risk assessment was
performed to detect odours, sensory irritation, chronic
toxic effects and cancer. Results showed that Formalde-
hyde appears to be the pollutant of greatest concern with
high chronic toxic and carcinogenic risk based on the
health assessment followed by naphthalene, benzene,
toluene because of their chronic effects.
Due to the nature of the fiber glass industry; involving
the use of hazardous materials, it is essential to undergo
an indoor air quality study to monitor the surrounding
pollutants. In the present study the primary objective of
IAQ is to ensure that the potential env ironmental impacts
of the industry are identified, and considered during the
running process. This is done by first studying the over
overall process and identifying the major areas of con-
cern. These areas are monitored and the environmental
impacts studied and analyzed to formulate a suitable and
effective solution for any problems if identified. As well
as provide well-documented information to Kuwait’s
EPA for evaluation and approval for environmental com-
pliance. Finally, this study concentrated on chemical pol-
lutants rather than particulate matters because PM stu-
died extensively in a previous study.
2. Data Collection
Data were collected in this study by using UV Sentry
equipment. It consists of an ultra violet light generated
from a source, usually deuterium or xenon lamp. The
light is emitted through the area to a receiver where it is
collected and concentrated using standard telescope op-
tics. Once inside the spectrometer, the light is broken out
into its various wavelengths by sending it through a ho-
lographic grating. The light then hits the CCD array
which in turn charges the capacitor. The capacitors are
discharged at a sample rate set by the user and the light
signal at each light frequency is proportional to the total
charge of each capacitor. The concentrated light is then
passed through an input lens into the spectrometer via a
fiber optic coupling.
The data were measured over a period of three months
and divided into two periods, the first period was from
1/Jan/2012 to 16/Feb/2012 and the second period was
from 17/Feb/2012 to end of March. The pollutants that
have been monitored were Ammonia, Formaldehyde, and
Phenol. The device was placed in 5 different areas
throughout the process line and in each area data were
collected for 5 days, this was done twice (two rounds),
which accumulated to a total of three months. The va-
riables that remained constant during the experiment
were the height and the duration of time which was 5
days. The height was maintained at 1.75 m from plat-
form/ground level which is equivalent of the height of
the average adult male. The distance between the sender
and the emitter are shown within the Table 1.
Once the raw data has b een collected, all records were
compiled into one file with special coding for each loca-
tion to distinguish between records. The raw data was
then transferred to SPSS software for statistical analysis
and proce s sed throu gh 3 steps .
3. Statistical Analysis
This part is about introducing and summarizing the col-
lected data using some statistical tools such as mean,
median, variance, skewness, upper quartile, lower quar-
tile. Tables 2 and 3 describe the overall statistics for the
collected data in general. A total of 8024 data points
were collected for each pollu tant. Data p oints that d id no t
“pass” a statistical were eliminated from the study.
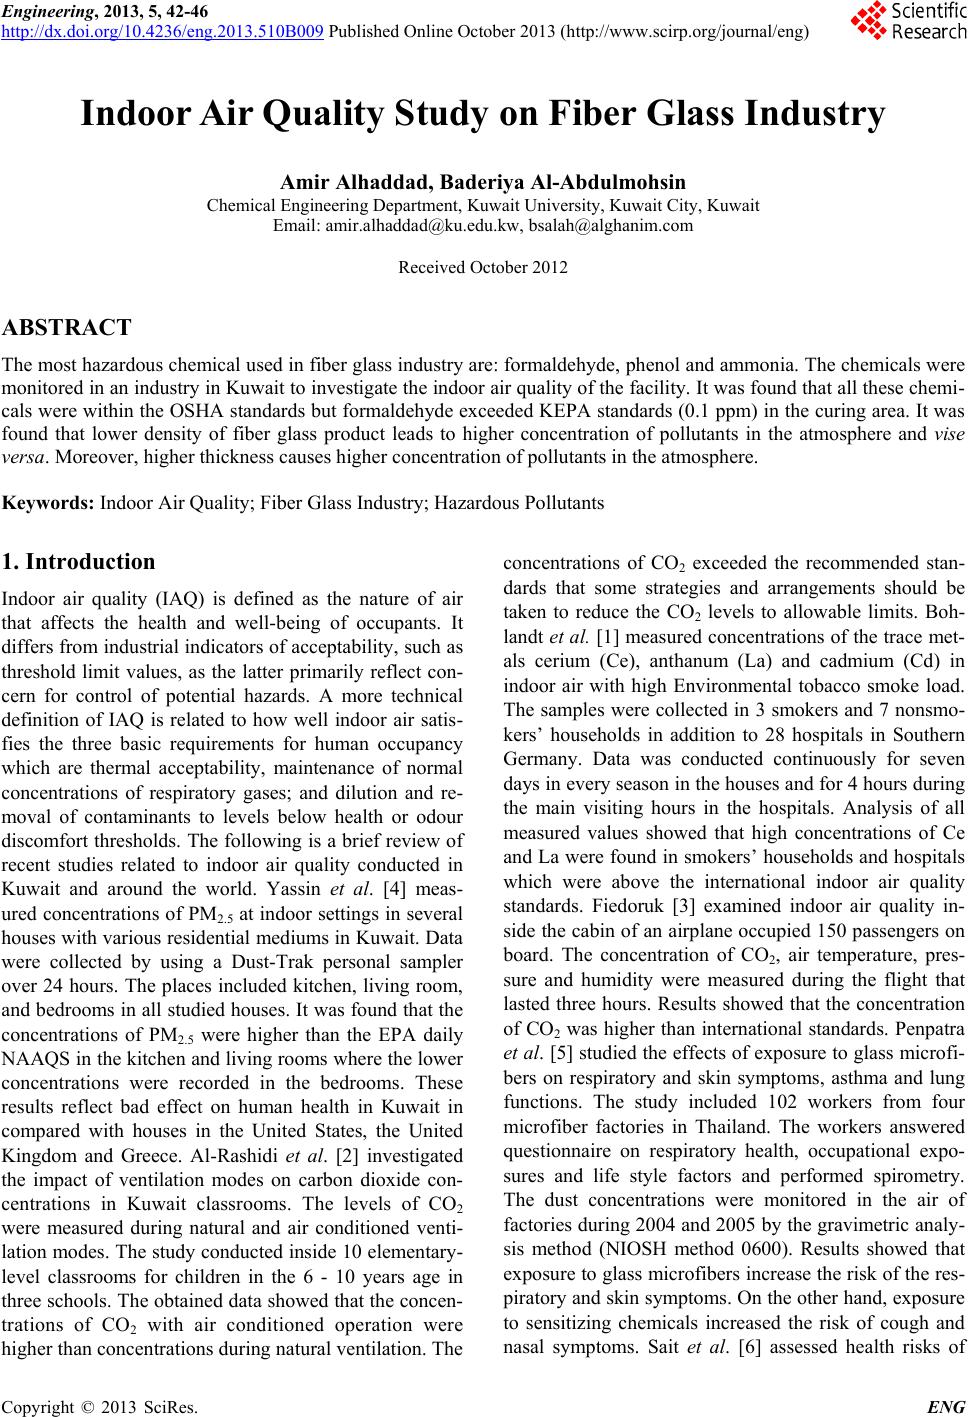
As it is clear from the Figure 1, the more density sizes
the less concentration of Ammonia values. Also, the fig-
ure shows that the variation of the data is decreasing
when the density size is increasing as indicated by the
length of the whisker of the box-plot. So, the figure as-
sures that the more density size the less concentration of
Ammonia.
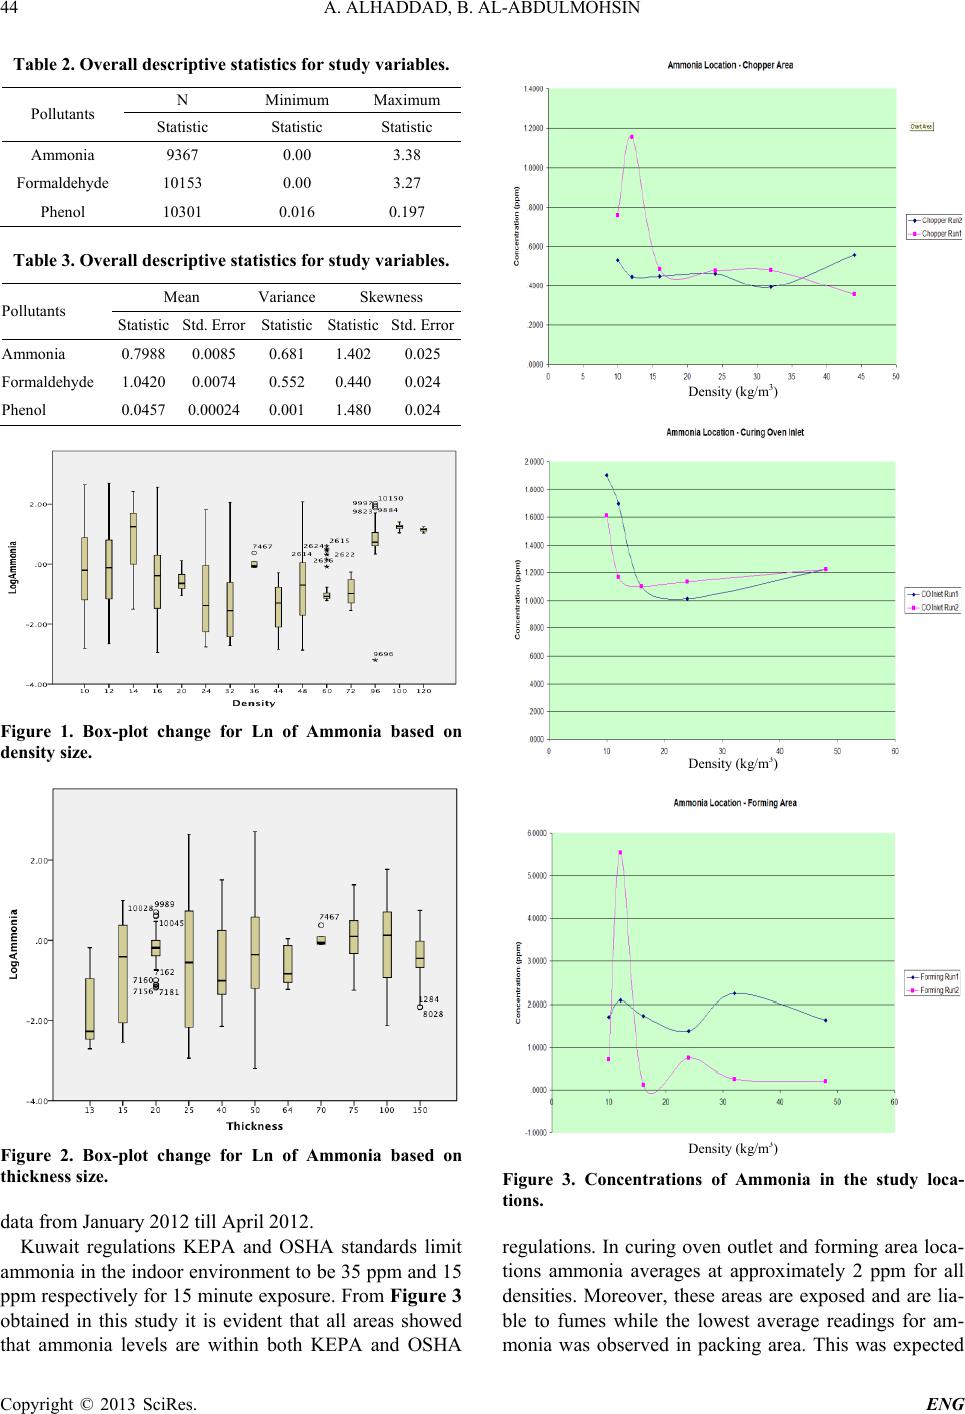
As it is clear from Figure 2, the more thickness sizes
the more concentration of Ammonia values. Also, the
figure shows that the variation of the data is decreasing
when the thickness is increasing as indicated by the
length of the whisker of the box-plot. So, the figure as-
sures that the more thick sizes the more concentration of
Ammonia.
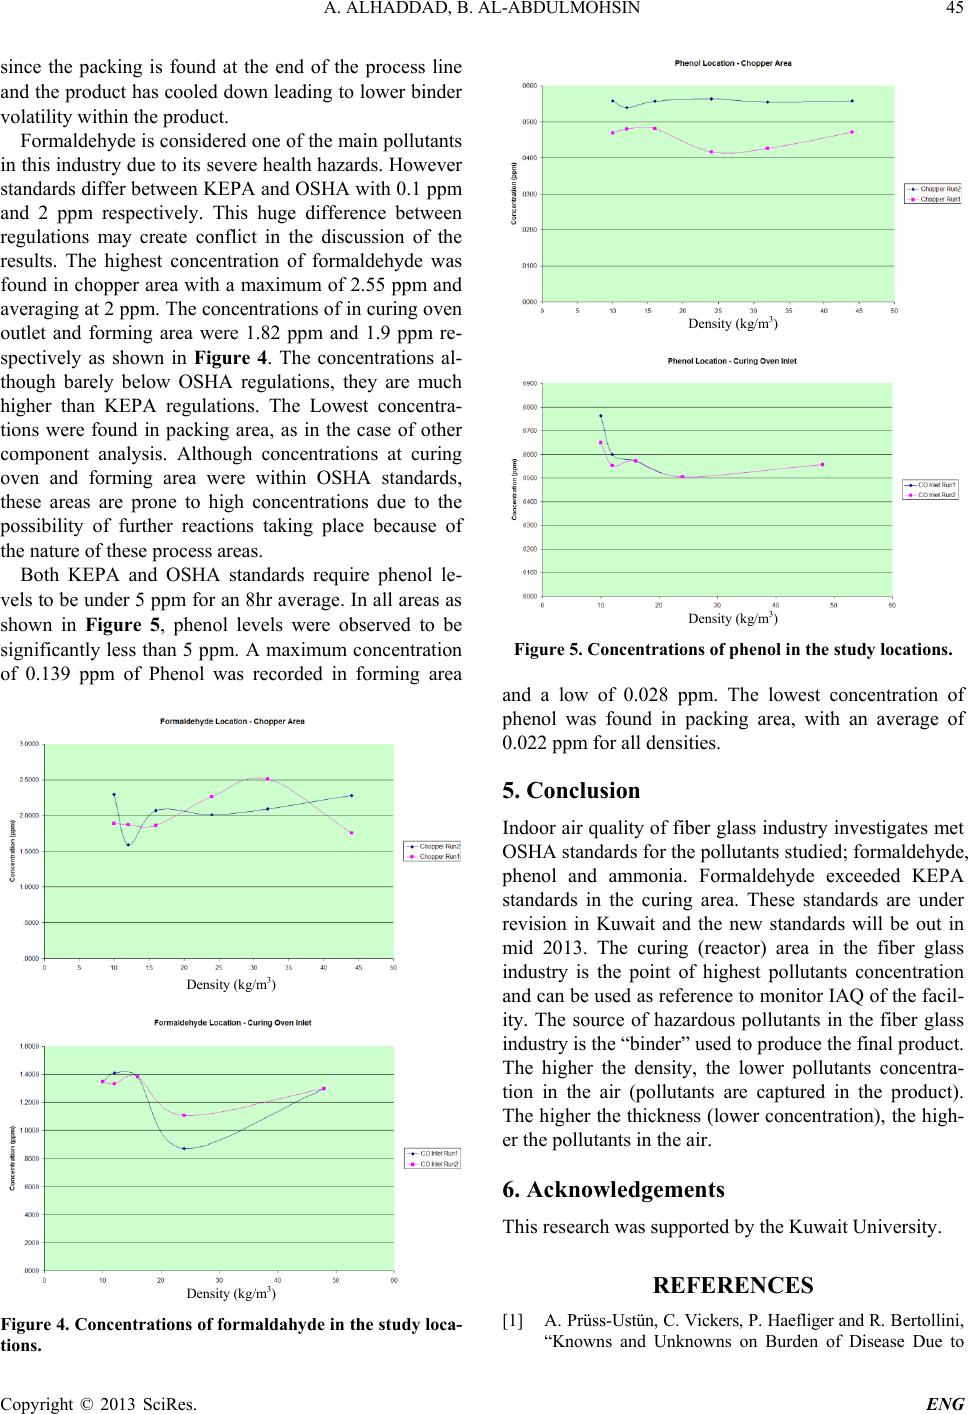
4. Comparison against KEPA and OSHA
Standards
To assess the indoor air quality the concentrations of
ammoni a, a formaldehyde and phenol pollutants were
compared against local and international standards (KEPA
and OSHA). The comparison was made for the measured
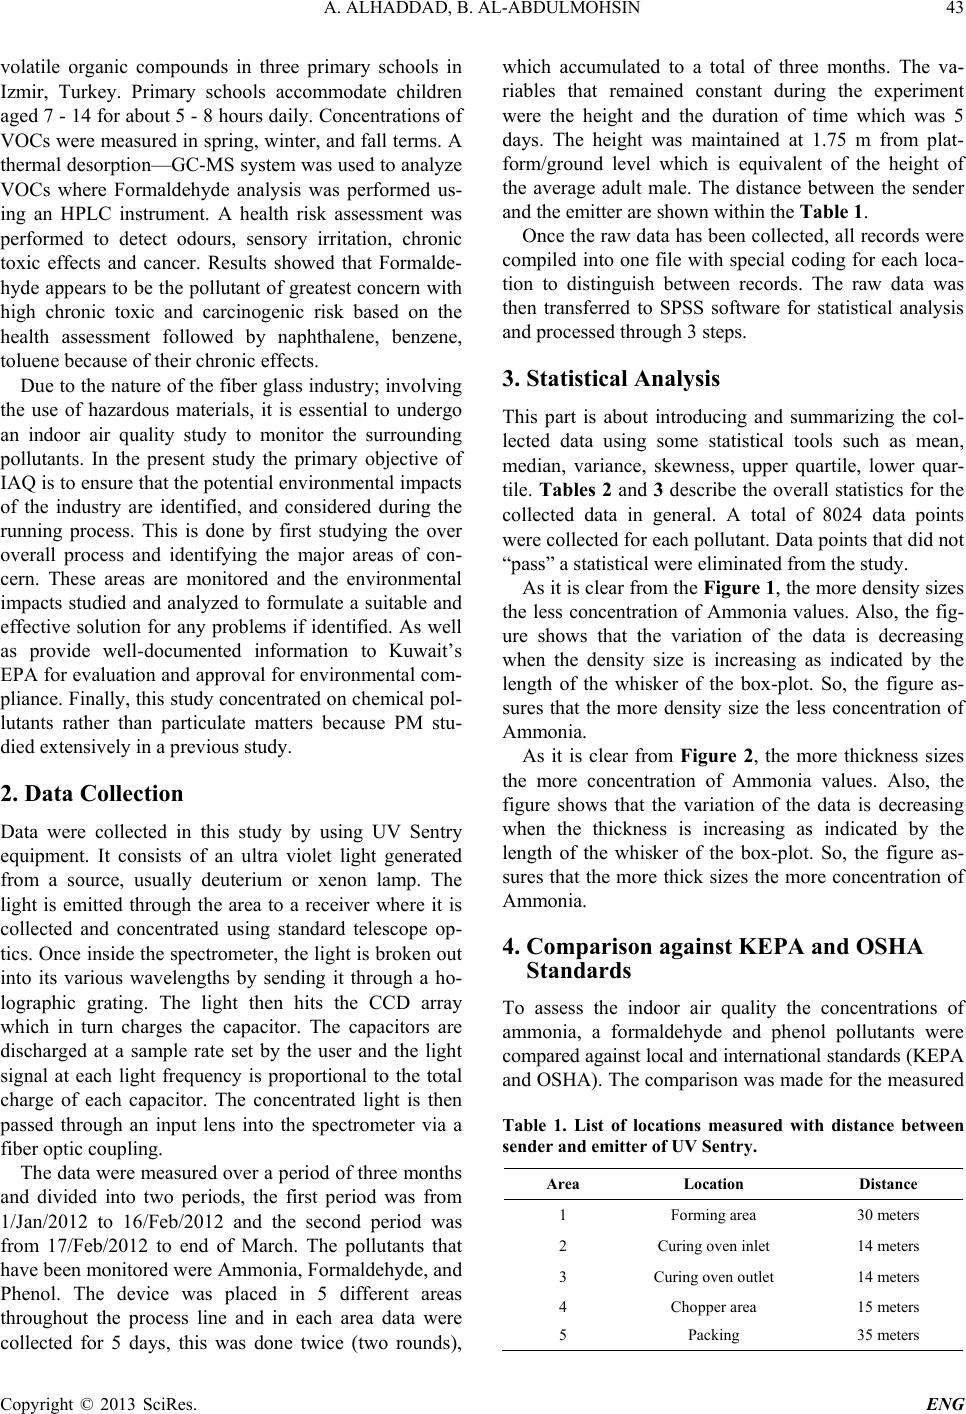
Table 1. List of locations measured with distance between
sender and emitter of UV Sentry.
Area Location Distance
1 Forming area 30 meters
2 Curing oven inlet 14 meters
3 Curing oven outlet 14 meters
4 Chopper area 15 meters
5 Packing 35 meters
A. ALHADDAD, B. AL-ABDULMOHSIN
Copyright © 2013 SciRes. ENG
44
Table 2. Overall descriptive statistics for study variables.
Pollutants N Min i mu m M ax i mum
Statistic Statistic Statistic
Ammonia 9367 0.00 3.38
Formaldehyde 10153 0.00 3.27
Phenol 10301 0.016 0.197
Table 3. Overall descriptive statistics for study variables.
Pollutants Mean Variance Skewness
Statistic Std. Error Statistic Statistic Std. Error
Ammonia 0.7988 0.0085 0.681 1.402 0.025
Formaldehyde 1.0420 0.0074 0.552 0.440 0.024
Phenol 0.0457 0.00024 0.001 1.480 0.024
Figure 1. Box-plot change for Ln of Ammonia based on
density size.
Figure 2. Box-plot change for Ln of Ammonia based on
thickness size.
data from January 201 2 till April 2012.
Kuwait regulations KEPA and OSHA standards limit
ammonia in the indoor environment to be 35 ppm and 15
ppm respectively for 15 minute exposure. From Figure 3
obtained in this study it is evident that all areas showed
that ammonia levels are within both KEPA and OSHA
Density (kg/m3)
Density (kg/m3)
Density (kg/m3)
Figure 3. Concentrations of Ammonia in the study loca-
tions.
regulations. In curing oven outlet and forming area loca-
tions ammonia averages at approximately 2 ppm for all
densities. Moreover, these areas are exposed and are lia-
ble to fumes while the lowest average readings for am-
monia was observed in packing area. This was expected
A. ALHADDAD, B. AL-ABDULMOHSIN
Copyright © 2013 SciRes. ENG
45
since the packing is found at the end of the process line
and the product has cooled do wn leading to lower binder
volatility within the product.
Formaldehyde is considered one of the main pollutants
in this industry due to its severe health hazards. However
standards differ between KEPA and OSHA with 0.1 ppm
and 2 ppm respectively. This huge difference between
regulations may create conflict in the discussion of the
results. The highest concentration of formaldehyde was
found in chopper area with a maximum of 2.55 ppm and
averaging at 2 ppm. The concentrations of in curing oven
outlet and forming area were 1.82 ppm and 1.9 ppm re-
spectively as shown in Figure 4. The concentrations al-
though barely below OSHA regulations, they are much
higher than KEPA regulations. The Lowest concentra-
tions were found in packing area, as in the case of other
component analysis. Although concentrations at curing
oven and forming area were within OSHA standards,
these areas are prone to high concentrations due to the
possibility of further reactions taking place because of
the nature of these process areas.
Both KEPA and OSHA standards require phenol le-
vels to be under 5 ppm for an 8hr average. In all ar eas as
shown in Figure 5, phenol levels were observed to be
significantly less than 5 ppm. A maximum concentration
of 0.139 ppm of Phenol was recorded in forming area
Density (kg/m3)
Density (kg/m3)
Figure 4. Concentrations of formaldahyde in the study loca-
tions.
Density (kg/m3)
Density (kg/m3)
Figure 5. Concentrations of phenol in the study locations.
and a low of 0.028 ppm. The lowest concentration of
phenol was found in packing area, with an average of
0.022 ppm for all densities.
5. Conclusion
Indoor air quality of fiber glass industry investig ates met
OSHA standards for the pollutants studied; formaldehyde,
phenol and ammonia. Formaldehyde exceeded KEPA
standards in the curing area. These standards are under
revision in Kuwait and the new standards will be out in
mid 2013. The curing (reactor) area in the fiber glass
industry is the point of highest pollutants concentration
and can be used as reference to monitor IAQ of the facil-
ity. The source of hazardous pollutants in the fiber glass
industry is the “binder” used to produce the final product.
The higher the density, the lower pollutants concentra-
tion in the air (pollutants are captured in the product).
The higher the thickness (lower concentration), the high-
er the pollutants in the air.
6. Acknowledgements
This rese a rch was supported by the Kuwait Universit y.
REFERENCES
[1] A. Prüss-Ustün, C. Vickers, P. Haefliger and R. Bertollini,
Knowns and Unknowns on Burden of Disease Due to
A. ALHADDAD, B. AL-ABDULMOHSIN
Copyright © 2013 SciRes. ENG
46
Chemicals: A Systematic Review,Environmental Health,
Vol. 10, 2011, p. 9.
http://dx.doi.org/10.1016/j.scitotenv.2011.11.017
[2] A. Bohlandt, R. Schierl, J. Diemer, C. Koch, G. Bolte, M.
Kiranoglu, H. Fromme and D. Nowa k , “High Concentra-
tions of Cadmium, Cerium and Lanthanum in Indoor Air
Due to Environmental Tobacco Smoke,” Science of the
Total Environment, Vol. 414, 2012, pp. 738-741.
http://dx.doi.org/10.1016/j.scitotenv.2011.11.017
[3] E. Gallego, X. Roca, J. F. Perales and X. Guardino, “De-
termining Indoor Air Quality and Identifying the Origin
of Odour Episodes in Indoor Environments,” Journal of
Environmental Sciences, Vol. 21, 2009, pp. 33-339.
http://dx.doi.org/10.1016/S1001-0742(08)62273-1
[4] K. G1adyszewska-Fiedoruk, “Indoor Air Quality in the
Cabin of an Airliner,” Journal of Air Transport Manage-
ment, Vol. 20, 2012, pp. 28-30.
[5] K. Al-Rashidia, D. Lovedaya and N. Al-Mutawab, “Im-
pact of Ventilation Modes on Carbon Dioxide Concentra-
tion Levels in Kuwait Classrooms,” Energy and Buildings,
Vol. 47, 2012, pp. 540-549.
http://dx.doi.org/10.1016/j.enbuild.2011.12.030
[6] M. Yassin, B. AlThaqeb and E. Al-Mutiri, “Assessment
of Indoor PM2.5 in Different Residential Environments,”
Atmospheric Environment, Vol. 56, 2012, pp. 65-68.
http://dx.doi.org/10.1016/j.atmosenv.2012.03.051
[7] P. Sripaiboonkij, N. Sripaiboonkij, W. Phanprasit and M.
S. Jaakkola, Respiratory and Skin Health among Glass
Microfiber Production Workers: A Cross-Sectional Stu-
dy,Environmental Health, Vol. 8, 2009, p. 36.
http://dx.doi.org/10.1186/1476-069X-8-36
[8] S. C. Sofuoglua, G. Aslanb, F. Inal and A. Sofuoglua,
“An Assessment of Indoor Air Concentrations and Health
Risks of Volatile Organic Compounds in Three Primary
Schools,” International Journal of Hygiene and Envi-
ronmental Health, Vol. 214, 2001, pp. 36-46.
http://dx.doi.org/10.1016/j.ijheh.2010.08.008