Paper Menu >>
Journal Menu >>
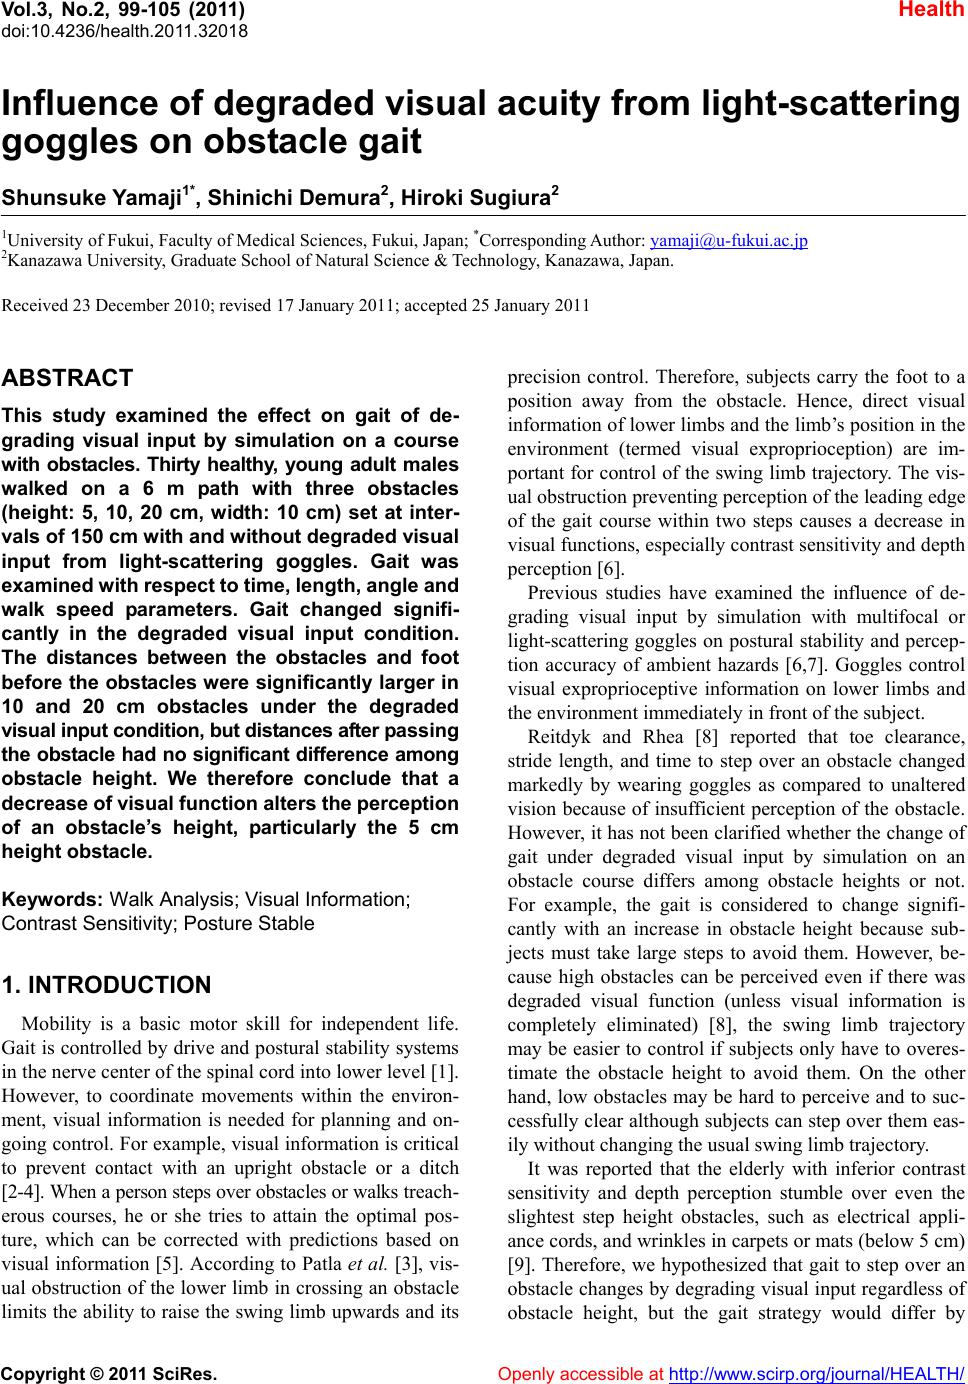 Vol.3, No.2, 99-105 (2011) Health doi:10.4236/health.2011.32018 Copyright © 2011 SciRes. Openly accessible at http://www.scirp.org/journal/HEALTH/ Influence of degraded visual acuity from light-scattering goggles on obstacle gait Shunsuke Yamaji1*, Shinichi Demura2, Hiroki Sugiura2 1University of Fukui, Faculty of Medical Sciences, Fukui, Japan; *Corresponding Author: yamaji@u-fukui.ac.jp 2Kanazawa University, Graduate School of Natural Science & Technology, Kanazawa, Japan. Received 23 December 2010; revised 17 January 2011; accepted 25 January 2011 ABSTRACT This study examined the effect on gait of de- grading visual input by simulation on a course with obstacles. Thirty healthy, young adult males walked on a 6 m path with three obstacles (height: 5, 10, 20 cm, width: 10 cm) set at inter- vals of 150 cm with and without degraded visual input from light-scattering goggles. Gait was examined with respec t to time, length, angle and walk speed parameters. Gait changed signifi- cantly in the degraded visual input condition. The distances between the obstacles and foot before the obstacles were significantly larger in 10 and 20 cm obstacles under the degraded v i s ua l i n p u t c o n d i t i on, b u t d i s tan c e s a fte r p assing the obstacle had no significant d ifference among obstacle height. We therefore conclude that a decrease of vi sual function alter s the percep tion of an obstacle’s height, particularly the 5 cm height obstacle. Keywords: Walk Analysis; Visual Information; Contrast Sensitivity; Posture Stable 1. INTRODUCTION Mobility is a basic motor skill for independent life. Gait is controlled by drive and postural stability systems in the nerve center of the spinal cord into lower level [1]. However, to coordinate movements within the environ- ment, visual information is needed for planning and on- going control. For example, visual information is critical to prevent contact with an upright obstacle or a ditch [2-4]. When a person steps over obstacles or walks treach- erous courses, he or she tries to attain the optimal pos- ture, which can be corrected with predictions based on visual information [5]. According to Patla et al. [3], vis- ual obstruction of the lower limb in crossing an obstacle limits the ability to raise the swing limb upwards and its precision control. Therefore, subjects carry the foot to a position away from the obstacle. Hence, direct visual information of lower limbs and the limb’s position in the environment (termed visual exproprioception) are im- portant for control of the swing limb trajectory. The vis- ual obstruction preventing perception of the leading edge of the gait course within two steps causes a decrease in visual functions, especially contrast sensitivity and depth perception [6]. Previous studies have examined the influence of de- grading visual input by simulation with multifocal or light-scattering goggles on postural stability and percep- tion accuracy of ambient hazards [6,7]. Goggles control visual exproprioceptive information on lower limbs and the environment immediately in front of the subject. Reitdyk and Rhea [8] reported that toe clearance, stride length, and time to step over an obstacle changed markedly by wearing goggles as compared to unaltered vision because of insufficient perception of the obstacle. However, it has not been clarified whether the change of gait under degraded visual input by simulation on an obstacle course differs among obstacle heights or not. For example, the gait is considered to change signifi- cantly with an increase in obstacle height because sub- jects must take large steps to avoid them. However, be- cause high obstacles can be perceived even if there was degraded visual function (unless visual information is completely eliminated) [8], the swing limb trajectory may be easier to control if subjects only have to overes- timate the obstacle height to avoid them. On the other hand, low obstacles may be hard to perceive and to suc- cessfully clear although subjects can step over them eas- ily without changing the usual swing limb trajectory. It was reported that the elderly with inferior contrast sensitivity and depth perception stumble over even the slightest step height obstacles, such as electrical appli- ance cords, and wrinkles in carpets or mats (below 5 cm) [9]. Therefore, we hypothesized that gait to step over an obstacle changes by degrading visual input regardless of obstacle height, but the gait strategy would differ by 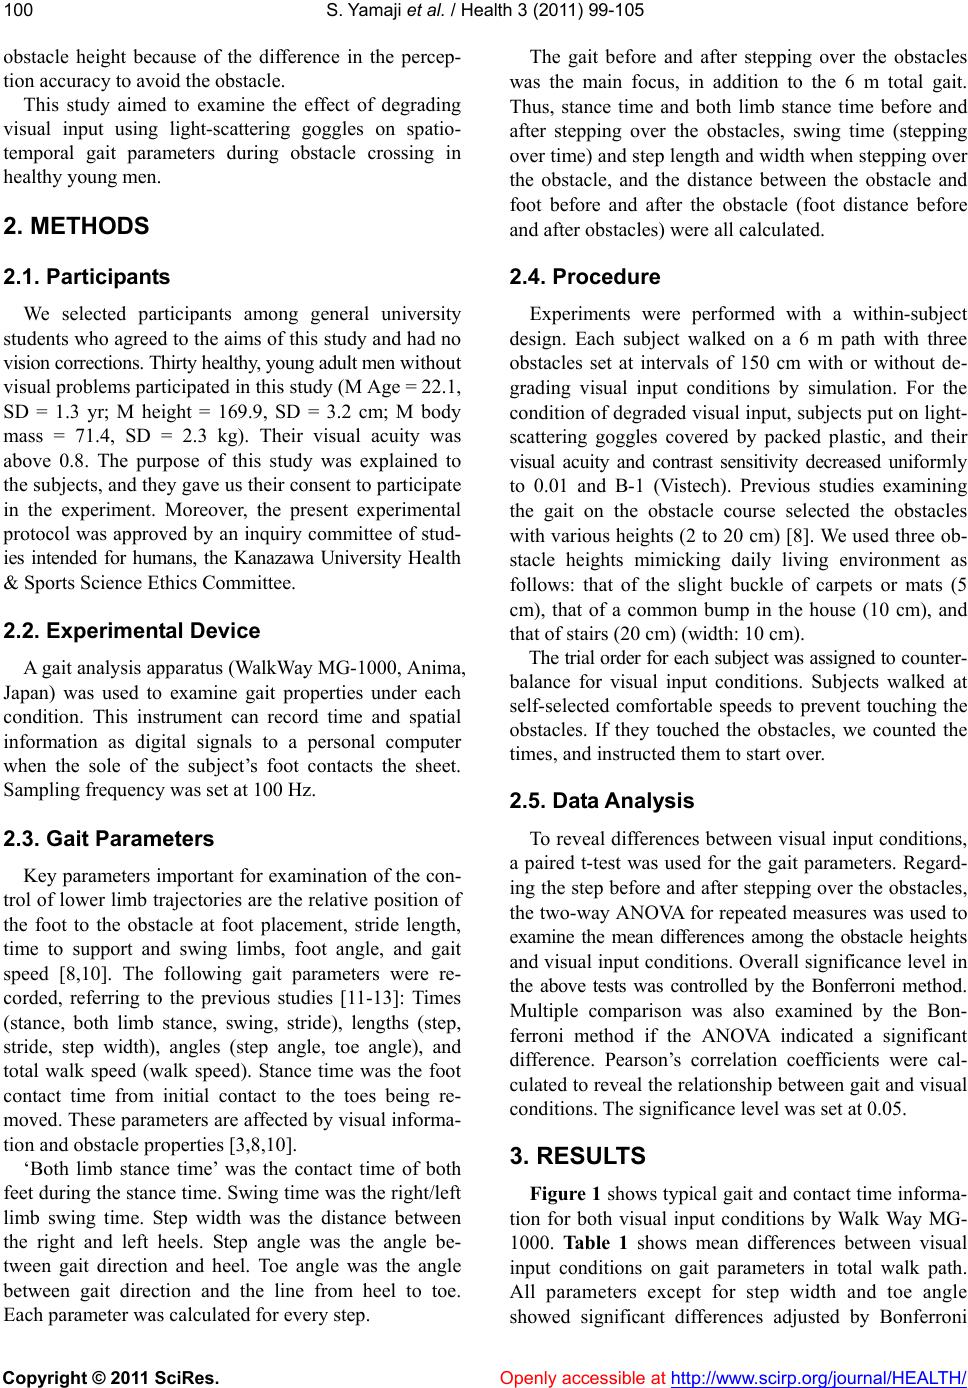 S. Yamaji et al. / Health 3 (2011) 99-105 Copyright © 2011 SciRes. Openly accessible at http://www.scirp.org/journal/HEALTH/ 100 obstacle height because of the difference in the percep- tion accuracy to avoid the obstacle. This study aimed to examine the effect of degrading visual input using light-scattering goggles on spatio- temporal gait parameters during obstacle crossing in healthy young men. 2. METHODS 2.1. Participants We selected participants among general university students who agreed to the aims of this study and had no vision corrections. Thirty healthy, young adult men without visual problems participated in this study (M Age = 22.1, SD = 1.3 yr; M height = 169.9, SD = 3.2 cm; M body mass = 71.4, SD = 2.3 kg). Their visual acuity was above 0.8. The purpose of this study was explained to the subjects, and they gave us their consent to participate in the experiment. Moreover, the present experimental protocol was approved by an inquiry committee of stud- ies intended for humans, the Kanazawa University Health & Sports Science Ethics Committee. 2.2. Experimental Device A gait analysis apparatus (WalkWay MG-1000, Anima, Japan) was used to examine gait properties under each condition. This instrument can record time and spatial information as digital signals to a personal computer when the sole of the subject’s foot contacts the sheet. Sampling frequency was set at 100 Hz. 2.3. Gait Parameters Key parameters important for examination of the con- trol of lower limb trajectories are the relative position of the foot to the obstacle at foot placement, stride length, time to support and swing limbs, foot angle, and gait speed [8,10]. The following gait parameters were re- corded, referring to the previous studies [11-13]: Times (stance, both limb stance, swing, stride), lengths (step, stride, step width), angles (step angle, toe angle), and total walk speed (walk speed). Stance time was the foot contact time from initial contact to the toes being re- moved. These parameters are affected by visual informa- tion and obstacle properties [3,8,10]. ‘Both limb stance time’ was the contact time of both feet during the stance time. Swing time was the right/left limb swing time. Step width was the distance between the right and left heels. Step angle was the angle be- tween gait direction and heel. Toe angle was the angle between gait direction and the line from heel to toe. Each parameter was calculated for every step. The gait before and after stepping over the obstacles was the main focus, in addition to the 6 m total gait. Thus, stance time and both limb stance time before and after stepping over the obstacles, swing time (stepping over time) and step length and width when stepping over the obstacle, and the distance between the obstacle and foot before and after the obstacle (foot distance before and after obstacles) were all calculated. 2.4. Procedure Experiments were performed with a within-subject design. Each subject walked on a 6 m path with three obstacles set at intervals of 150 cm with or without de- grading visual input conditions by simulation. For the condition of degraded visual input, subjects put on light- scattering goggles covered by packed plastic, and their visual acuity and contrast sensitivity decreased uniformly to 0.01 and B-1 (Vistech). Previous studies examining the gait on the obstacle course selected the obstacles with various heights (2 to 20 cm) [8]. We used three ob- stacle heights mimicking daily living environment as follows: that of the slight buckle of carpets or mats (5 cm), that of a common bump in the house (10 cm), and that of stairs (20 cm) (width: 10 cm). The trial order for each subject was assigned to counter- balance for visual input conditions. Subjects walked at self-selected comfortable speeds to prevent touching the obstacles. If they touched the obstacles, we counted the times, and instructed them to start over. 2.5. Data Analysis To reveal differences between visual input conditions, a paired t-test was used for the gait parameters. Regard- ing the step before and after stepping over the obstacles, the two-way ANOVA for repeated measures was used to examine the mean differences among the obstacle heights and visual input conditions. Overall significance level in the above tests was controlled by the Bonferroni method. Multiple comparison was also examined by the Bon- ferroni method if the ANOVA indicated a significant difference. Pearson’s correlation coefficients were cal- culated to reveal the relationship between gait and visual conditions. The significance level was set at 0.05. 3. RESULTS Figure 1 shows typical gait and contact time informa- tion for both visual input conditions by Walk Way MG- 1000. Table 1 shows mean differences between visual input conditions on gait parameters in total walk path. All parameters except for step width and toe angle showed significant differences adjusted by Bonferroni 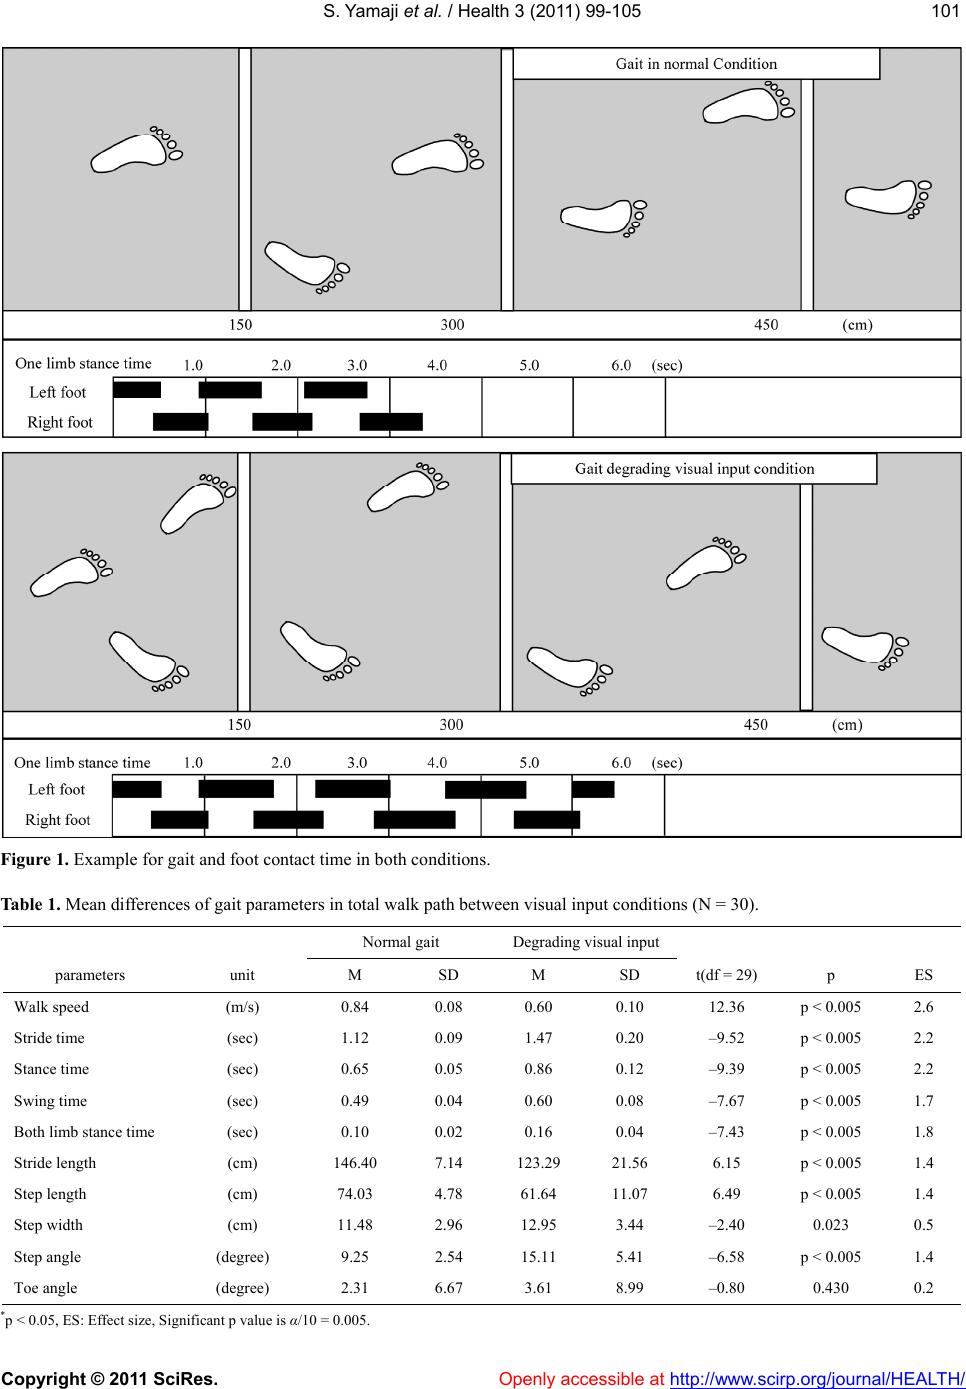 S. Yamaji et al. / Health 3 (2011) 99-105 Copyright © 2011 SciRes. Openly accessible at http://www.scirp.org/journal/HEALTH/ 101101 Figure 1. Example for gait and foot contact time in both conditions. Table 1. Mean differences of gait parameters in total walk path between visual input conditions (N = 30). Normal gait Degrading visual input parameters unit M SD M SD t(df = 29) p ES Walk speed (m/s) 0.84 0.08 0.60 0.10 12.36 p < 0.005 2.6 Stride time (sec) 1.12 0.09 1.47 0.20 –9.52 p < 0.005 2.2 Stance time (sec) 0.65 0.05 0.86 0.12 –9.39 p < 0.005 2.2 Swing time (sec) 0.49 0.04 0.60 0.08 –7.67 p < 0.005 1.7 Both limb stance time (sec) 0.10 0.02 0.16 0.04 –7.43 p < 0.005 1.8 Stride length (cm) 146.40 7.14 123.29 21.56 6.15 p < 0.005 1.4 Step length (cm) 74.03 4.78 61.64 11.07 6.49 p < 0.005 1.4 Step width (cm) 11.48 2.96 12.95 3.44 –2.40 0.023 0.5 Step angle (degree) 9.25 2.54 15.11 5.41 –6.58 p < 0.005 1.4 Toe angle (degree) 2.31 6.67 3.61 8.99 –0.80 0.430 0.2 *p < 0.05, ES: Effect size, Significant p value is α/10 = 0.005.  S. Yamaji et al. / Health 3 (2011) 99-105 Copyright © 2011 SciRes. Openly accessible at http://www.scirp.org/journal/HEALTH/ 102 method for each of the visual input conditions (p < 0.005, ES > 1.4). Under the degraded visual input condition, walk speed decreased, and time to contact with the floor such as stance and both limb stance, and swing became longer. As expected, stride and step lengths shortened and the step angles increased. Table 2 shows the results of two-way ANOVA (visual input conditions × obstacle heights) for each parameter before and after stepping over the obstacles. There were significant main factors in stance time, stepping over time, both limb stance time, and foot distance after ob- stacle (p < 0.007). As the results of multiple comparisons, in the degrading visual input condition, times to stance and both limb stance before stepping over obstacle, and time to stepping over were longer in all obstacle heights. These parameters were significantly longer with higher obstacle heights in the normal condition, but not in the degraded visual input condition. A significant difference between the visual input conditions was found in the step length for 20 cm obstacle heights and in the step width for 5 cm and 10 cm obstacle heights. The dis- tances between the obstacle and foot before the obstacle were significantly longer in degraded visual input condi- tions. On the other hand the distances between the foot and obstacle after the obstacle had been passed had no significant difference for the two different visual condi- tions. Ta bl e 3 shows the correlations of gait parameters be- fore and after stepping over the obstacles between visual input conditions. Many parameters indicate no signifi- cant correlation. Figure 2 shows the scatter diagram of the distances between the feet before and after the obstacles. The cor- relations under the normal condition (-.78 - -.84) tended Table 2. Two-way ANOVA (visual input conditions × obstacle heights) for each gait parameter before and after stepping over the obstacles (N = 30). Normal gait Degrading visual inputANOVA Multiple comparison M SD M SD Effect F P partial η2 Visual input Obstacle Height 5 cm 0.61 0.08 0.960.19Visiual input90.30p < 0.007.76 10 cm0.69 0.06 1.020.17Obstacle height16.86p < 0.007.37 Stance time (sec) 20 cm0.75 0.07 1.050.29Interaction 0.890.415 .03 N < D N: 5 < 10 < 20 5 cm 0.49 0.09 0.760.16Visiual input84.21p < 0.007.74 10 cm0.58 0.05 0.830.13Obstacle height21.13p < 0.007.42 Stepping over time (sec) 20 cm0.64 0.06 0.870.25Interaction 0.480.624 .16 N < D N: 5 < 10 < 20 5 cm 0.10 0.02 0.190.06Visiual input57.82p < 0.007.67 10 cm0.10 0.02 0.190.06Obstacle height1.030.364 .03 Both limb stance time (sec) 20 cm0.11 0.02 0.180.06Interaction 7.880.001 .21 N < D N: 10 < 20 5 cm 77.7 6.2 75.110.4Visiual input1.74 0.198 .06 10 cm75.1 3.6 78.0 8.9 Obstacle height1.360.266 .05 Step length (cm) 20 cm75.6 5.0 80.5 9.5 Interaction 4.92 0.011 .15 5 cm 5.5 3.4 9.3 5.7 Visiual input15.340.001 .35 10 cm7.7 3.4 10.87.7 Obstacle height3.190.049 .10 Step width (cm) 20 cm6.7 4.1 8.8 6.4 Interaction 0.570.571 .02 5, 10: N < D 5 cm 26.9 11.0 24.8 12.6 Visiual input 6.370.017 .18 10 cm26.5 5.9 32.4 8.9 Obstacle height7.930.001 .00 Foot distance before obstacle (cm) 20 cm27.2 8.4 36.111.5Interaction 8.330.001 .00 10, 20: N < D D: 5 < 10, 20 5 cm 25.9 7.2 25.8 9.6 Visiual input2.500.124 .08 10 cm23.4 5.7 20.35.8 Obstacle height12.52p < 0.007.30 Foot distance after obstacle (cm) 20 cm22.8 5.1 19.8 7.8 Interaction 0.16 0.221 .05 N: 10 < 5 D: 10, 20 < 5 Note: partial η2: Effect size, N: Normal gait condition, D: Degrading visual input condition, 5, 10, 20; obstacle height. Significant p value is α/7 = 0.007.  S. Yamaji et al. / Health 3 (2011) 99-105 Copyright © 2011 SciRes. Openly accessible at http://www.scirp.org/journal/HEALTH/ 103103 Table 3. Correlation coefficients of gait parameters before/ after stepping over the obstacles between visual input condi- tions. obstacle height 5 cm 10 cm20 cm Stance time (sec) .14 .15 .07 Stepping over time (sec) .01 .06 .05 Both limb stance time (sec) .13 .26 .11 Step length (cm) .23 .11 -.14 Step width (cm) .40* .59* .13 Foot distance before obstacle (cm) .25 -.04 .29 Foot distance after obstacle (cm) .05 -.01 .39* Note: *: P < 0.05. to be higher than those under the degraded visual input conditions (-.55 - -.63). Figure 3 shows the scatter diagram between both limb stance time and time to stepping over. In the degrading visual input conditions, these parameters had larger in- dividual differences and higher correlations (.59 - .64). 4. DISCUSSION Degraded visual input simulated by light-scattering goggles produced a slower gait, decreased walking speed, and shorter stride length. As correlations between gait parameters of the visual input conditions were low, the influence may be uneven for each individual. The pre- sent degrading visual input was not the complete shield. Hence, although subjects could perceive the obstacles under their legs, their visual line during walking had to direct their feet. It is concluded that perception of the obstacles resulted in delay, step and stride length de- crease, and foot contact times of stance, both limb stance, and swing limb stance were increased. An increase of swing time causes an increase of the one limb stance time, and this leads to an unstable gait. A subject’s leg may swing or elevate upward because one limb stance phase is extended, regardless of a decrease in step and stride lengths. In addition, an increase of step width and angle means an increase of lateral body sway during one limb stance phase, and an increase of toe angle suggests the possibility of a trunk rotation during that phase. Pos- tural sway during one limb stance phase due to degraded visual input is considered to become greater by the ex- tension of one limb stance time. Relationships between gait parameters of visual input conditions were low. A modification of the gait program with the degrading visual input may differ greatly in individuals. Although the gait program is prepared in advance, the degrading visual input may interfere with smooth gait motion because of modification of feedback during motion [7,14]. In a step before and after stepping over the obstacles, time to stance and stepping over, and both limb stance time became longer with higher obstacles in the normal condition. In contrast, there were no significant differ- ences in the degrading visual input conditions. These parameters were longer in the degrading visual input conditions compared with the normal conditions for all obstacles. Visual function consists of static, dynamic, and kinetic visual acuities, contrast sensitivity, and depth perception. Lord and Menz [14] suggested that the decrease of the latter two visual functions is correlated with the prob- ability of falling. This study examined decreased visual acuity and contrast sensitivity with wearing light-scattering goggles. Although depth perception could not be meas- ured, it is considered to decrease similarly under the de- creasing conditions of visual acuity and contrast sensi- tivity [4]. Because the influence of these functions on the gait was hard to examine individually, the contribution of each visual function to the gait can not be judged by a decrease of any visual function under the present ex- perimental conditions. However, it is possible that from the present results, subjects could not perceive a differ- ence in obstacle height for visual acuities up to 0.01 and contrast sensitivity until B-1 decrease. When a person steps over an obstacle in the normal visual input condition, the visual feedback system pro- vides immediately optimal modification of the gait to assess the foot elevation height for stepping over, based on the exact perception of the obstacle height during walking motion [15]. In the degrading visual input con- dition, the time to stepping over increased, in addition to the stance and both limb stance times. However, a per- son may roughly assess the foot elevation height because they find it difficult to exactly assess the height, even while perceiving the presence of the obstacles before- hand. In addition, there were significant differences in the foot distances before or after obstacles between obsta- cles of heights 5 cm and over 10 cm under the degraded visual input condition. That is, it is possible that subjects recognized obstacle heights over 10 cm when they tried to step over the obstacle. However, it is inferred that they stepped over the obstacles without recognizing what exactly their height was because the foot distances from obstacles before stepping over were longer and those after stepping over were shorter as compared with those in the normal condition. Subjects could step care- fully over the obstacles despite the degrading visual in- put, because they recognized the existence of the obstacles  S. Yamaji et al. / Health 3 (2011) 99-105 Copyright © 2011 SciRes. Openly accessible at http://www.scirp.org/journal/HEALTH/ 104 Figure 2. Scatter diagram between both the distances of foot before and after the obstacles. Figure 3. Scatter diagram between both limb stance time and stepping over time. beforehand within certain intervals. However, a person with impaired visual function may stumble because they cannot know an obstacle’s position in advance in daily life. Moreover, the present results suggest that degrading visual input makes time to step over and one limb stance phase increase. The above could lead to an increase in posture instability during movement. In conclusion, degrading visual input makes it hard to exactly perceive an obstacle’s height, and extends the one limb stance phase. Even obstacles with a slight step height may increase the probability of stumbling and postural instability when stepping over them. REFERENCES [1] Masani, K. (1999) Walking and vision. Japanese Journal of Biomechanics in Sports and Exercise, 3, 300-307. [2] Diez, V. (1992) Human neuronal control of automatic functional movements: Interaction between central pro- grams and afferent input. Physiological Reviews, 72, 33- 69. [3] Patla, A.E., Tomescu, S.S. and Ishac, M.G. (2004) What visual information is used for navigation around obsta- cles in a cluttered environment? Canadian Journal of Physiology and Pharmacology, 82, 682-692. [4] Black, A. and Wood, J. (2005) Vision and falls. Clinical  S. Yamaji et al. / Health 3 (2011) 99-105 Copyright © 2011 SciRes. Openly accessible at http://www.scirp.org/journal/HEALTH/ 105105 and Experimental Optometry, 88, 212-222. [5] Rubenstein, L.Z., Josephson, K.R., Trueblood, P.R., Ye- ung, K. and Harker, J.O. (1997) The reliability and valid- ity of an obstacle course as a measure of gait and balance in older adults. Aging, 9, 127-135. [6] Anand, V., Buckley, J.G., Scally, A. and Elliott, D.B. (2003) Postural stability changes in the elderly with cataract simulation and refractive blur. Investigative Ophthalmology and Visual Science, 44, 4670-4675. [7] Lord, S.R. (2006) Visual risk factors for falls in older people. Age and Ageing, 35, 42-45. [8] Rietdyk, S. and Rhea, C.K. (2006) Control of adaptive locomotion: Effect of visual obstruction and visual cues in the environment. Experimental Brain Research, 169, 272-278. [9] Suzuki, T. (2003) Epidemiology and implications of fal- ling among the elderly. Nippon Ronen Igakkai Zasshi, 40, 85-94. [10] Mohagheghi, A.A., Moraes, R. and Patla, A.E. (2004) The effects of distant and on-line visual information on the control of approach phase and step over an obstacle during locomotion. Experimental Brain Research, 155, 459-468. [11] Ferrandez, A.M., Pailhous, J. and Durup, M. (1990) Slowness in elderly gait. Experimental Aging Research, 16, 79-89. [12] Jensen, J., Nyberg, L., Rosendahl, E., Gustafson, Y. and Lundin-Olsson, L. (2004) Effects of a fall prevention program including exercise on mobility and falls in frail older people living in residential care facilities. Aging Clinical and Experimental Research, 16, 283-292. [13] Murray, M.P., Kory, R.C. and Clarkson, B.H. (1969) Walking patterns in healthy old men. Journal of Geron- tology, 24, 169-178. [14] Lord, S.R. and Menz, H.B. (2000) Visual contributions to postural stability in older adults. Gerontology, 46, 306- 310. [15] Means, K.M. and O'Sullivan, P.S. (2000) Modifying a functional obstacle course to test balance and mobility in the community. Journal of Rehabilitation Research and Development, 37, 621-632. |