A. M. N. MOUSTAFA ET AL.
Copyright © 2013 SciRes. ENG
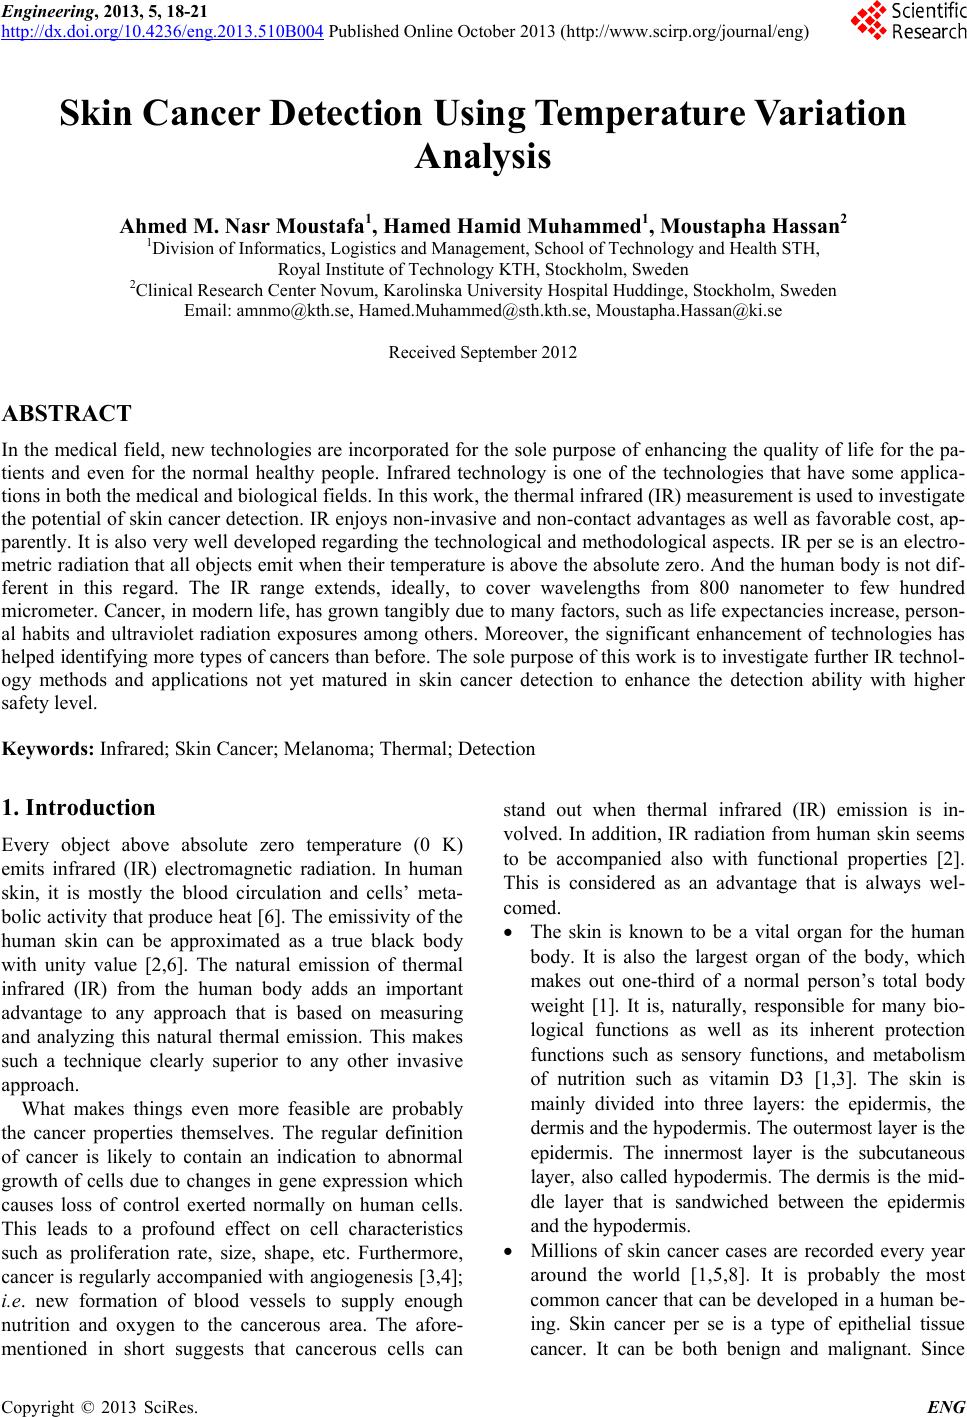
ments were performed simultaneously to obtain a form of
a differential overview that coincided well in time. The
measurements were conducted for a sufficient period of
time and stored for later analysis and investigation.
It is worth mentioning that each sensor was placed di-
rectly above the measured spot at a close distance of 1
cm to form a direct well-localized measurement and to
maximize a solid IR detection. The sensors were con-
nected simultaneously to a computer and had the capabil-
ity of storing two long lists of temperature measurements
vs. the time.
3. Results and Discussion
The obtained experimental results were in the form of
tabulated temperature measurements for the healthy skin
area and the cancerous area in the skin. Both sets of
measurements were simultaneously conducted to achieve
synchronization. These results were stored on the com-
puter internal storage.
The first step of analyzing the acquired data was to
compute a number of statistical parameters for the heal-
thy and the cancerous skin areas for each lab animal.
Thereafter, the next step was to qualitatively compare
these parameters in an efficient and reliable way.
Statistical tests, such as the student-test as well as the
ANOVA test were also used to be able to see if it was
possible to differentiate between the IR emission mea-
surements acquired on a healthy spot and the corres-
ponding measurements that were acquired on a skin can-
cer spot.
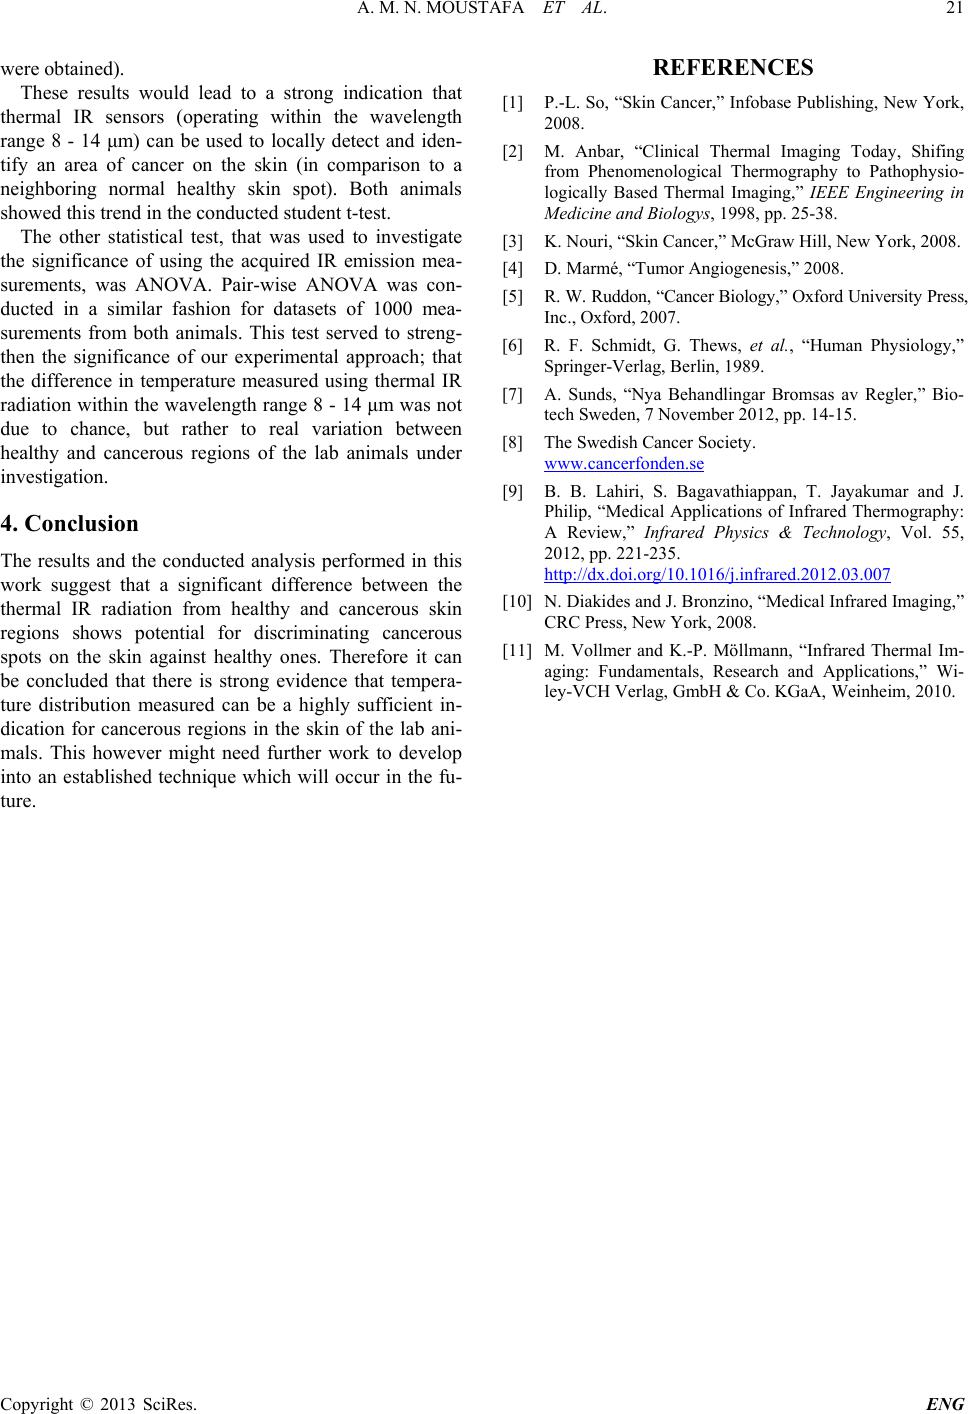
Table 1 displays the r esults for a sample dataset of ten
measurements for the cancerous spot in one animal. The
columns of the table in this figure contain the calculated
values for the mean, medi an , standard deviation, ma xi-
mum, minimum as well as the difference between the
maximum and the minimum values of the ten-measure-
ments sample dataset corresponding to a sufficient period
of time .
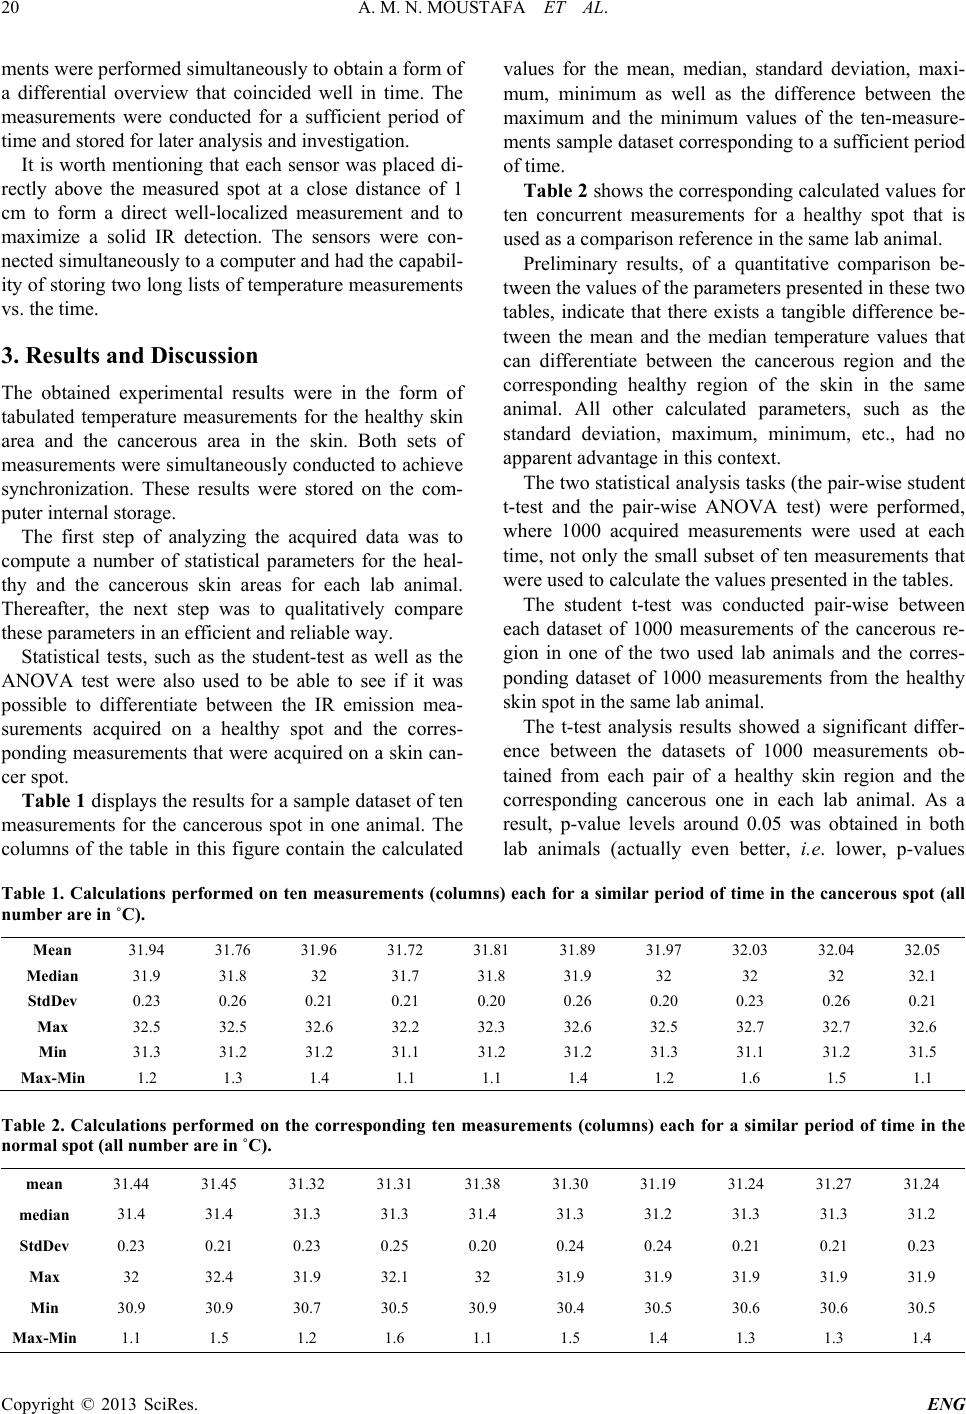
Table 2 shows the corresponding calculated values for
ten concurrent measurements for a healthy spot that is
used as a comparison reference in the same lab animal.
Preliminary results, of a quantitative comparison be-
tween the values of the parameters presented in these two
tables, indicate that there exists a tangible difference be-
tween the mean and the median temperature values that
can differentiate between the cancerous region and the
corresponding healthy region of the skin in the same
animal. All other calculated parameters, such as the
standard deviation, maxi mum, min i mum, etc., had no
apparent advantage in this context.
The two statistical analysis tasks (the pair-wise student
t-test and the pair-wise ANOVA test) were performed,
where 1000 acquired measurements were used at each
time , not only the small subset of ten measurements that
were used to calculate the values presented in the tables.
The student t-test was conducted pair-wise between
each dataset of 1000 measurements of the cancerous re-
gion in one of the two used lab animals and the corres-
ponding dataset of 1000 measurements from the healthy
skin spot in the same lab animal.
The t-test analysis results showed a significant differ-
ence between the datasets of 1000 measurements ob-
tained from each pair of a healthy skin region and the
corresponding cancerous one in each lab animal. As a
result, p-value levels around 0.05 was obtained in both
lab animals (actually even better, i.e. lower, p-values
Table 1. Calculations performed on ten measurements (columns) each for a similar period of time in the cancerous spot (all
number are i n ˚C).
Mean 31.94 31.76 31.96 31.72 31.81 31.89 31.97 32.03 32.04 32.05
Median 31.9 31.8 32 31.7 31.8 31.9 32 32 32 32.1
StdDev 0.23 0.26 0.21 0.21 0.20 0.26 0.20 0.23 0.26 0.21
Max 32.5 32.5 32.6 32.2 32.3 32.6 32.5 32.7 32.7 32.6
Min 31.3 31.2 31.2 31.1 31.2 31.2 31.3 31.1 31.2 31.5
Max-Min 1.2 1.3 1.4 1.1 1.1 1.4 1.2 1.6 1.5 1.1
Table 2. Calculations performed on the corresponding ten measurements (columns) each for a similar period of time in the
normal spot (all number are in ˚C).
mean 31.44 31.45 31.32 31.31 31.38 31.30 31.19 31.24 31.27 31.24
median
31.4 31.4 31.3 31.3 31.4 31.3 31.2 31.3 31.3 31.2
StdDev
0.23 0.21 0.23 0.25 0.20 0.24 0.24 0.21 0.21 0.23
Max 32 32.4 31.9 32.1 32 31.9 31.9 31.9 31.9 31.9
Min 30.9 30.9 30.7 30.5 30.9 30.4 30.5 30.6 30.6 30.5
Max-Min
1.1 1.5 1.2 1.6 1.1 1.5 1.4 1.3 1.3 1.4